The Cosmetics and Skincare Dashboard and skincare industry moves at an incredible pace. New product launches happen every month, beauty trends evolve rapidly, and customer preferences shift constantly. At the same time, businesses must closely monitor sales performance, profit margins, discounts, brands, stores, and regional demand. However, when this data remains locked in static reports or disconnected spreadsheets, decision-making becomes slow and risky.
That is exactly where the Cosmetics and Skincare Dashboard in Power BI becomes a powerful competitive advantage 💄📊✨.
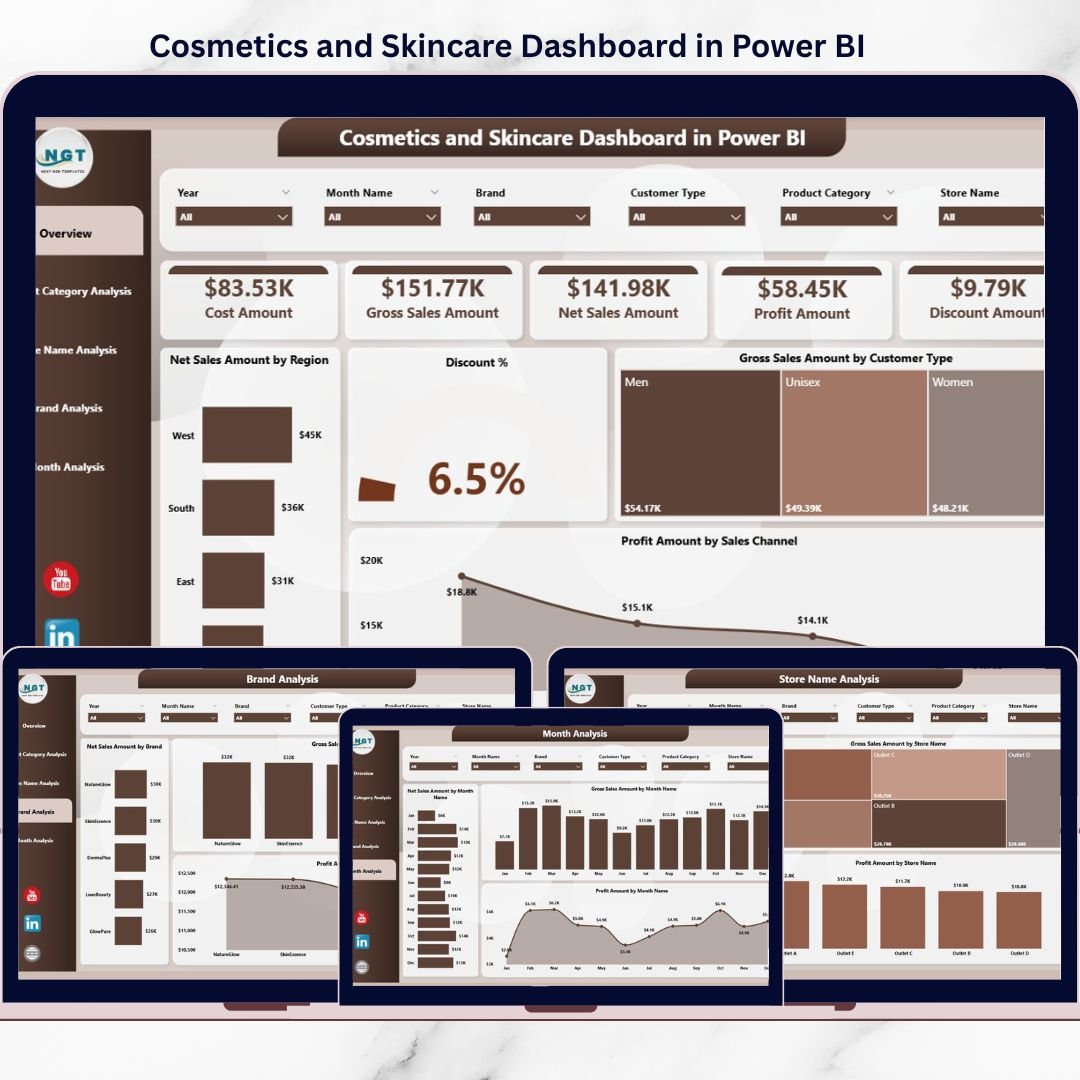
This ready-to-use Power BI dashboard transforms raw cosmetics and skincare sales data into interactive visuals, KPI cards, and trend analysis. Instead of manually preparing reports, decision-makers gain real-time visibility into business performance across brands, product categories, stores, regions, sales channels, and time periods—all within one professional Power BI file.
By combining structured data sources with Power BI’s advanced visualization capabilities, this dashboard helps beauty brands, distributors, and retailers move from intuition-based decisions to data-driven strategy and growth.
## Key Features of Cosmetics and Skincare Dashboard in Power BI 🚀
This dashboard is designed specifically for beauty industry analytics.
📊 Centralized Sales & Profit Monitoring
Track net sales, gross sales, profit, and discounts from a single dashboard.
🎛️ Interactive Power BI Slicers
Filter data instantly by brand, product category, store, region, customer type, sales channel, or month.
📈 Executive KPI Cards
View critical business metrics at a glance without digging into raw data.
📉 Discount & Margin Visibility
Monitor discount percentages and profit trends to protect margins.
🏷️ Brand & Category Performance Analysis
Identify top-performing skincare and cosmetics brands and product lines.
🏬 Store-Level Performance Insights
Compare store-wise sales and profitability to optimize retail strategy.
📅 Monthly & Seasonal Trend Tracking
Understand demand patterns, seasonal peaks, and campaign impact.
⚡ Scalable Power BI Solution
Handles large datasets efficiently and refreshes insights instantly.
## What’s Inside the Cosmetics and Skincare Dashboard in Power BI 📂
This dashboard includes five structured Power BI pages, each answering a critical business question.
🟦 Overview Page
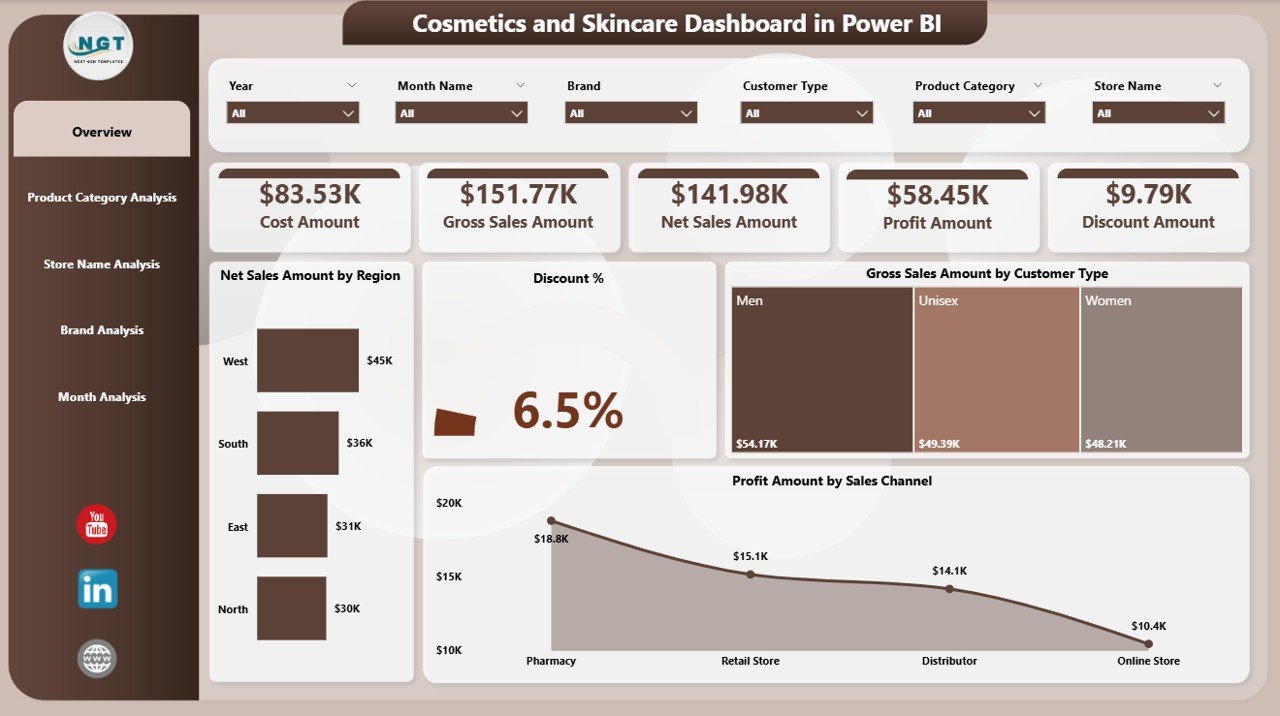
Acts as the control center with visuals such as Net Sales by Region, Discount Percentage, Gross Sales by Customer Type, and Profit by Sales Channel.
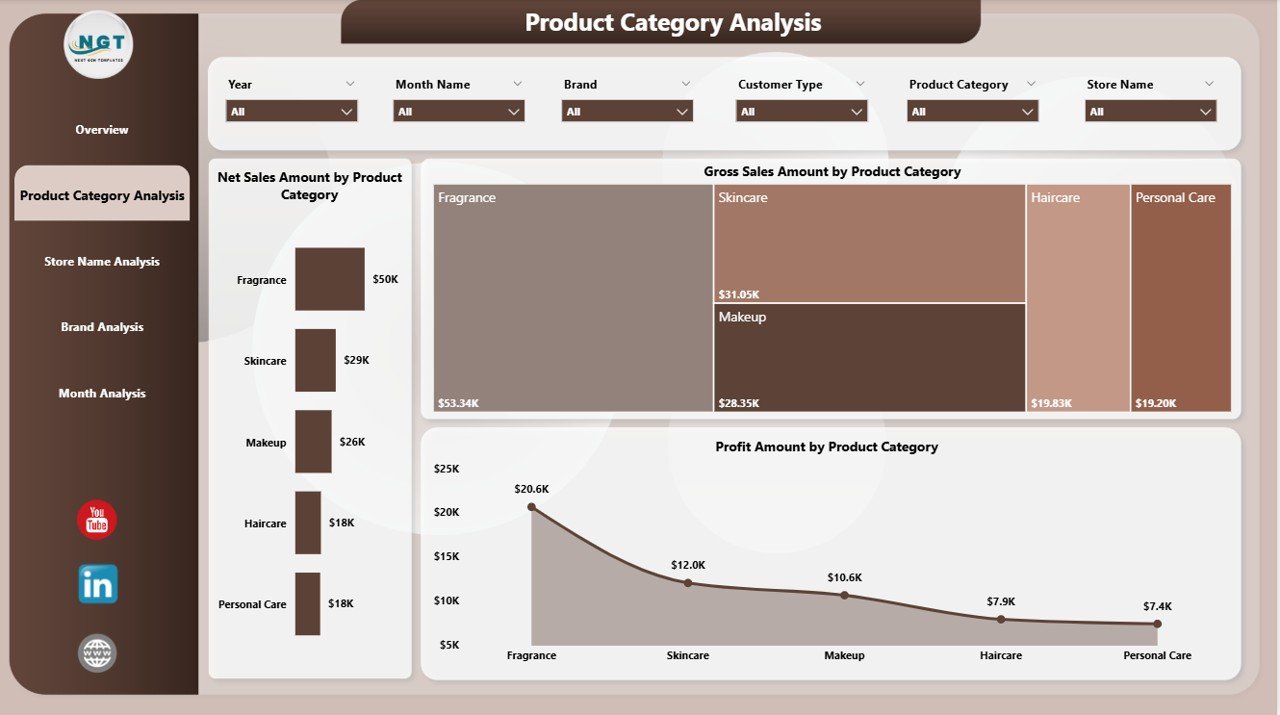
🟦 Product Category Analysis Page
Analyzes net sales, gross sales, and profit across skincare and cosmetics product categories.
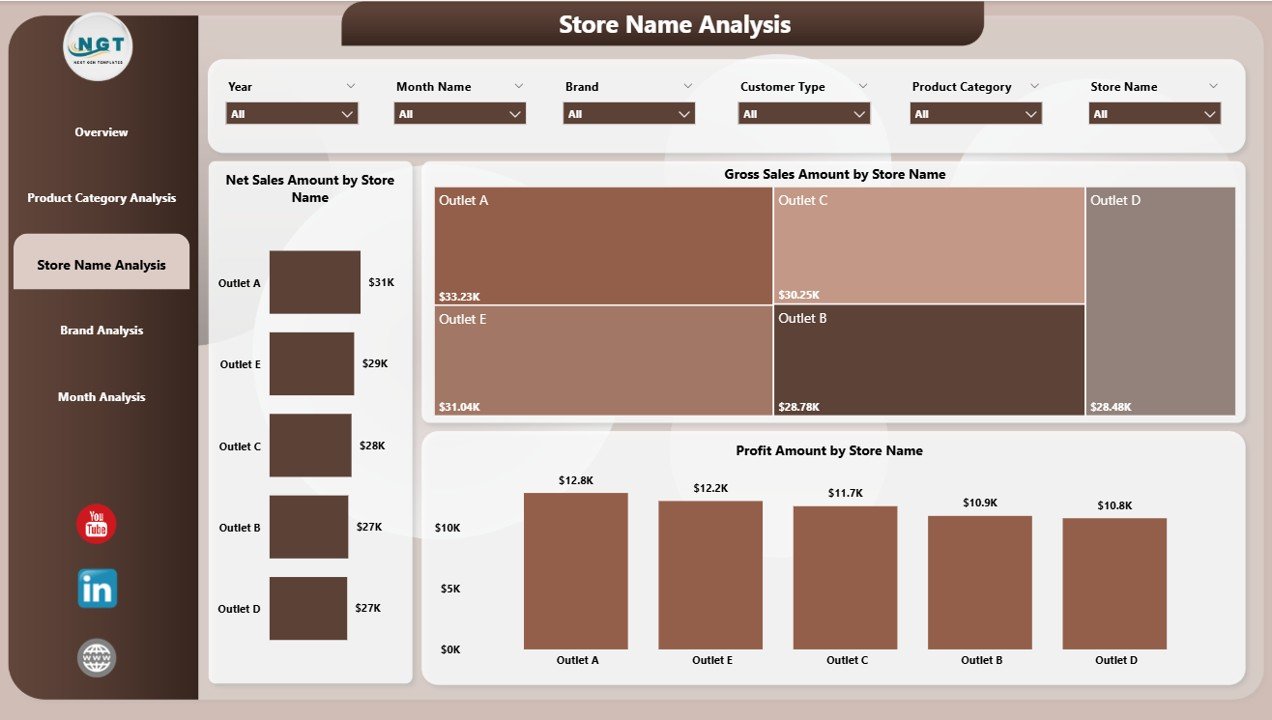
🟦 Store Name Analysis Page
Evaluates store-wise performance to identify top-performing and underperforming locations.
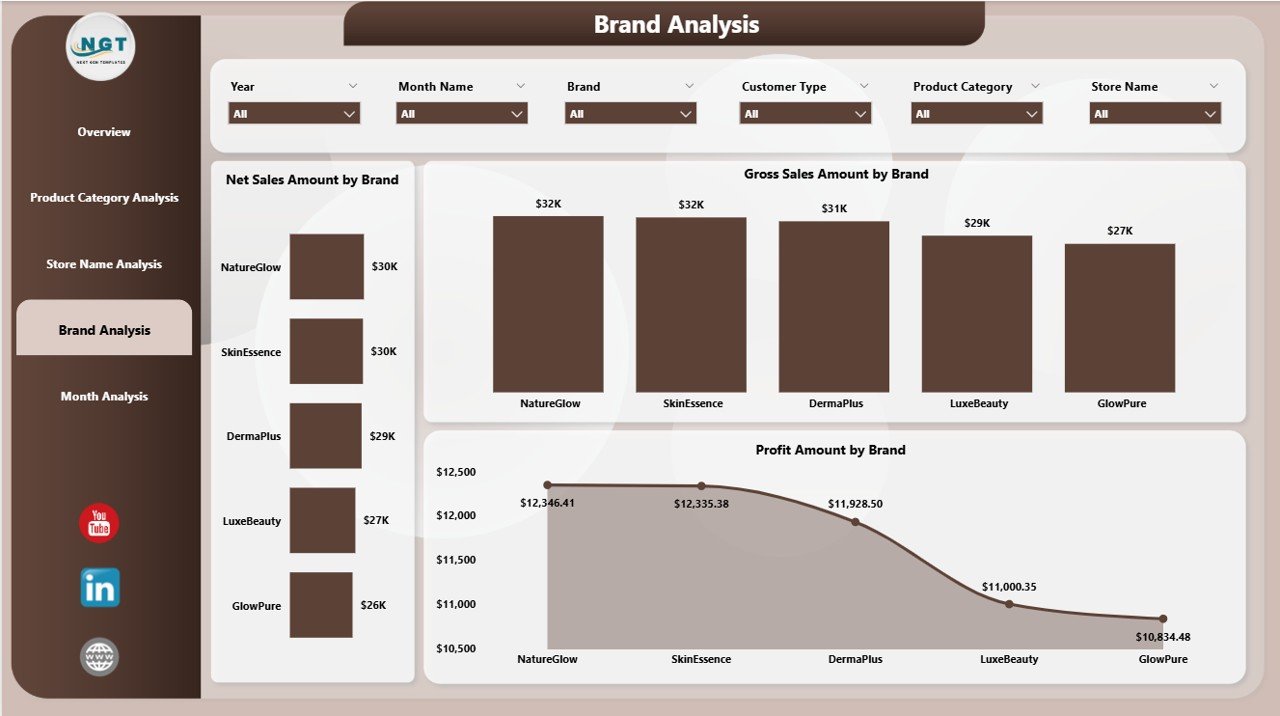
🟦 Brand Analysis Page
Provides brand-level insights for net sales, gross sales, and profit to support portfolio decisions.
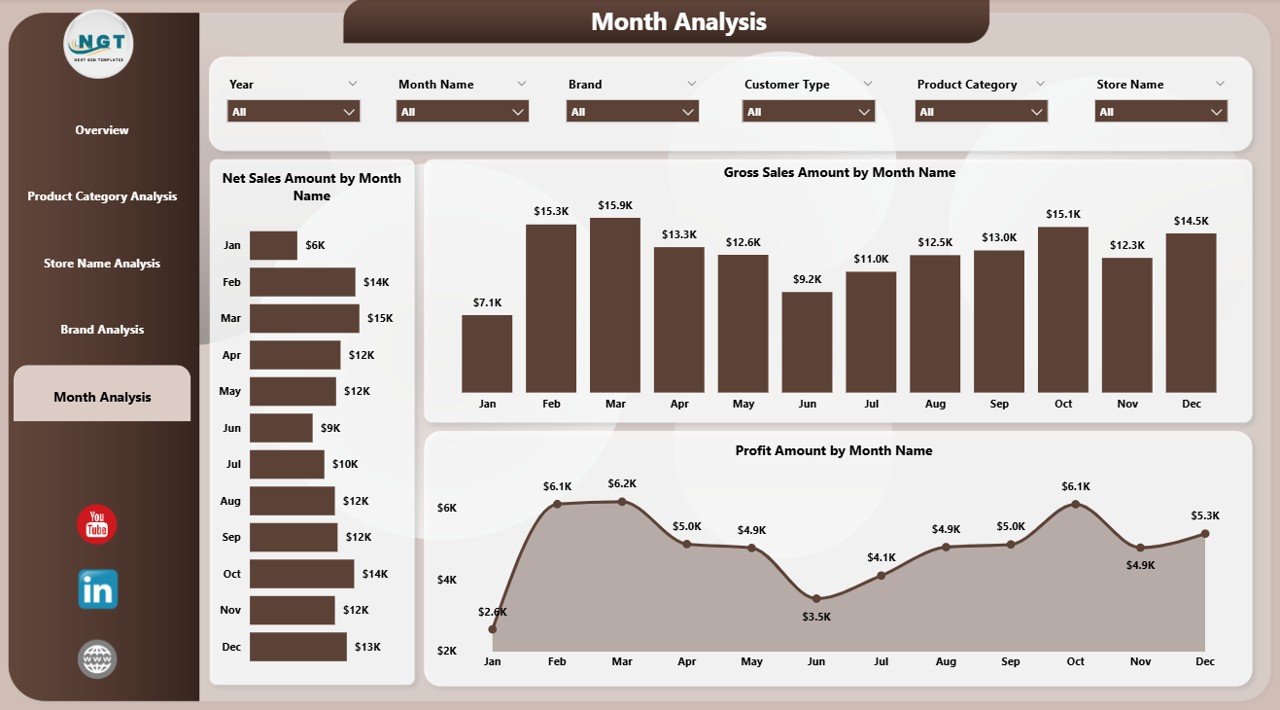
🟦 Month Analysis Page
Tracks monthly trends for net sales, gross sales, and profit to highlight seasonality and growth patterns.
Together, these pages provide a complete, end-to-end performance view for cosmetics and skincare businesses.
## How to Use the Cosmetics and Skincare Dashboard in Power BI 🧩
Using the dashboard is simple and efficient:
1️⃣ Load or connect your cosmetics and skincare sales data
2️⃣ Refresh the Power BI report
3️⃣ Apply slicers to filter by brand, category, store, region, or month
4️⃣ Review KPIs, charts, and trends instantly
5️⃣ Use insights to improve pricing, promotions, inventory, and strategy
Power BI automatically handles calculations and visuals—allowing teams to focus on business decisions, not reporting.
## Who Should Use This Cosmetics and Skincare Dashboard in Power BI 👥
This dashboard is ideal for:
✔️ Cosmetics & Skincare Brand Owners
✔️ Beauty Product Distributors
✔️ Retail & E-commerce Businesses
✔️ Sales & Marketing Teams
✔️ Finance & Operations Teams
✔️ Business Analysts & Decision-Makers
Both technical and non-technical users can use this dashboard confidently.
### Click here to read the Detailed blog post
Visit our YouTube channel to learn step-by-step video tutorials
👉 https://youtube.com/@PKAnExcelExpert


Reviews
There are no reviews yet.