Meeting rooms are valuable workplace assets—but without proper tracking, they often turn into cost centers instead of productivity hubs. Overbooked rooms, unused spaces, frequent cancellations, and scheduling conflicts silently reduce efficiency across organizations.
That is exactly why the Meeting Room Utilization Dashboard in Power BI is a game-changing solution for modern workplaces.
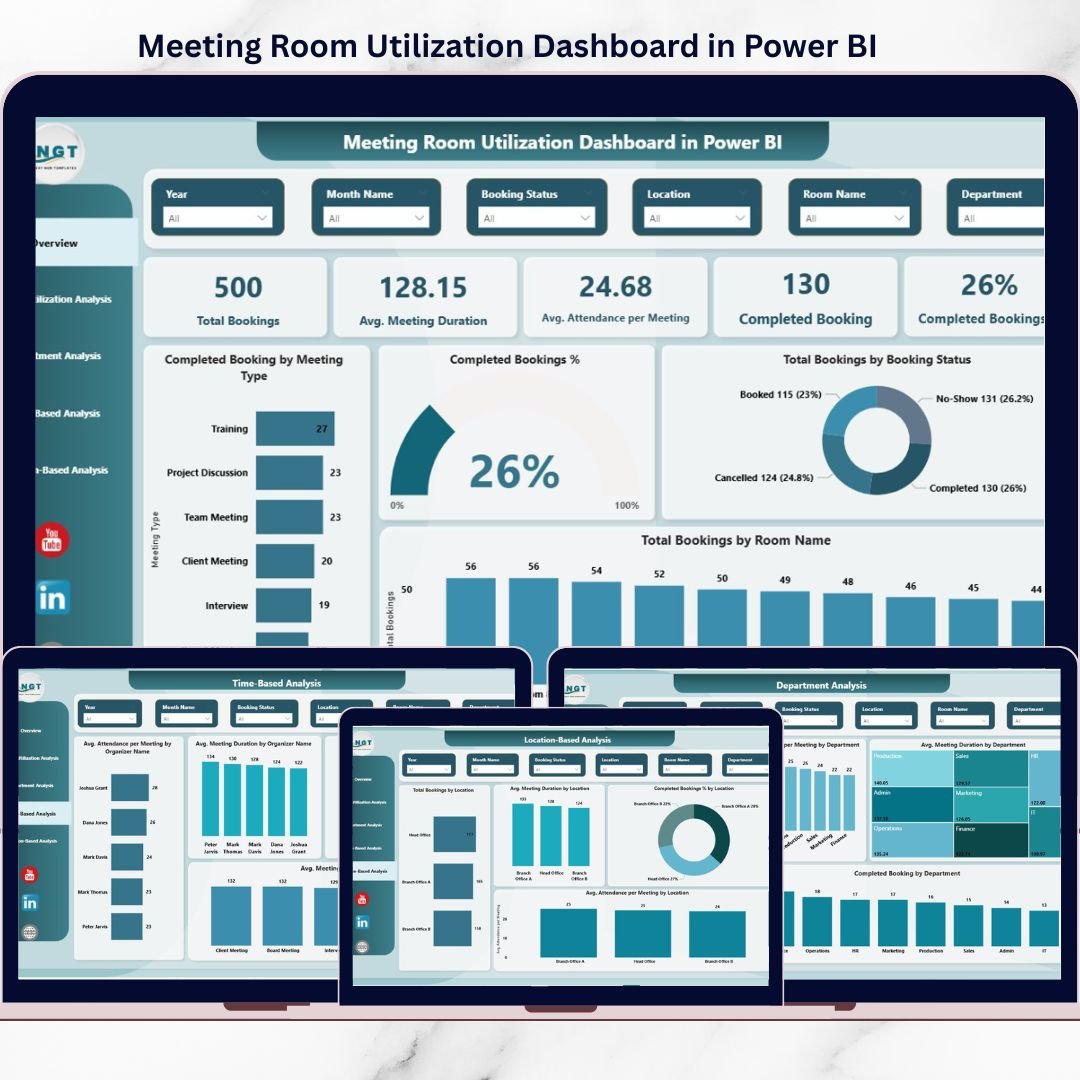
This ready-to-use Power BI dashboard converts raw meeting room booking data into clear, interactive, and decision-ready insights. Instead of relying on scattered calendars, emails, or manual reports, this dashboard gives you complete visibility into how meeting rooms are actually used—by room, department, time, organizer, and location.
Whether you manage a single office or multiple locations, this dashboard helps you optimize space usage, reduce costs, and improve employee experience—all with just a few clicks.
🔑 Key Features of Meeting Room Utilization Dashboard in Power BI
📊 5 Powerful Analysis Pages
Get a complete view of meeting room performance across overview, room usage, department behavior, time trends, and locations.
⏱️ Real-Time Utilization Insights
Instantly track bookings, attendance, duration, cancellations, and completion rates.
🏢 Room-Wise Performance Tracking
Identify overused and underused rooms to improve allocation and reduce space wastage.
👥 Department & Organizer Analysis
Understand which teams and organizers consume the most meeting time.
📍 Location-Based Comparison
Compare meeting room usage across offices to support space planning decisions.
🔄 Easy Excel Integration
Update your Excel data and refresh Power BI—no complex setup required.
🎯 Interactive Slicers & Filters
Analyze data by room, department, location, meeting type, or time period.
📦 What’s Inside the Meeting Room Utilization Dashboard in Power BI
This digital product includes a professionally designed Power BI file with five structured analysis pages:
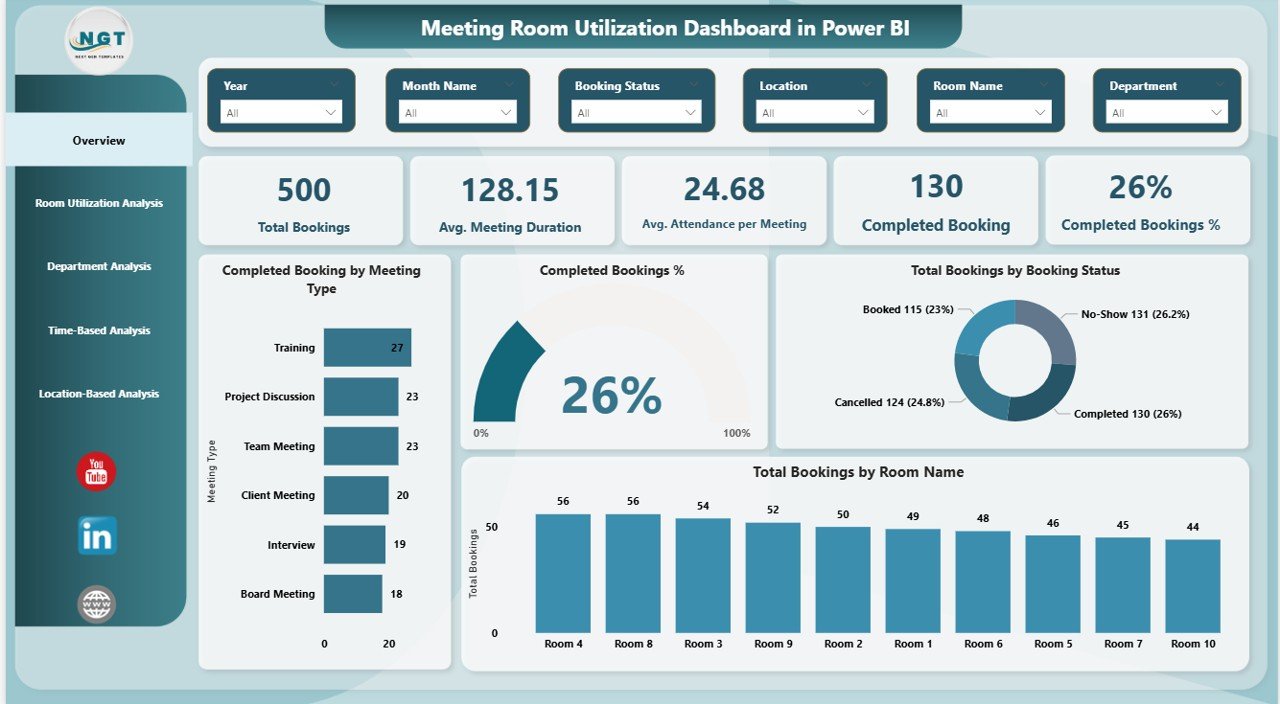
📌 Overview Page
Shows total bookings, average duration, attendance, completed meetings, and booking success rate—ideal for leadership insights.
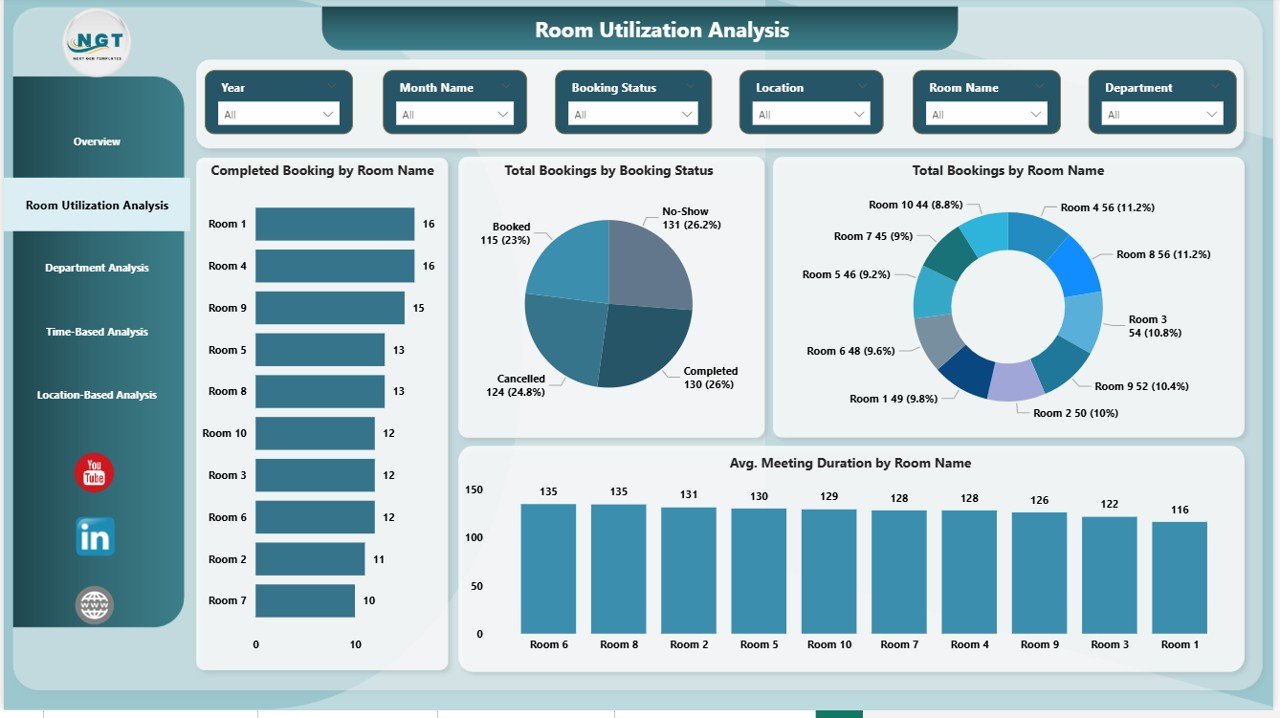
📌 Room Utilization Analysis
Tracks bookings, room types, booking status, and duration by room name.
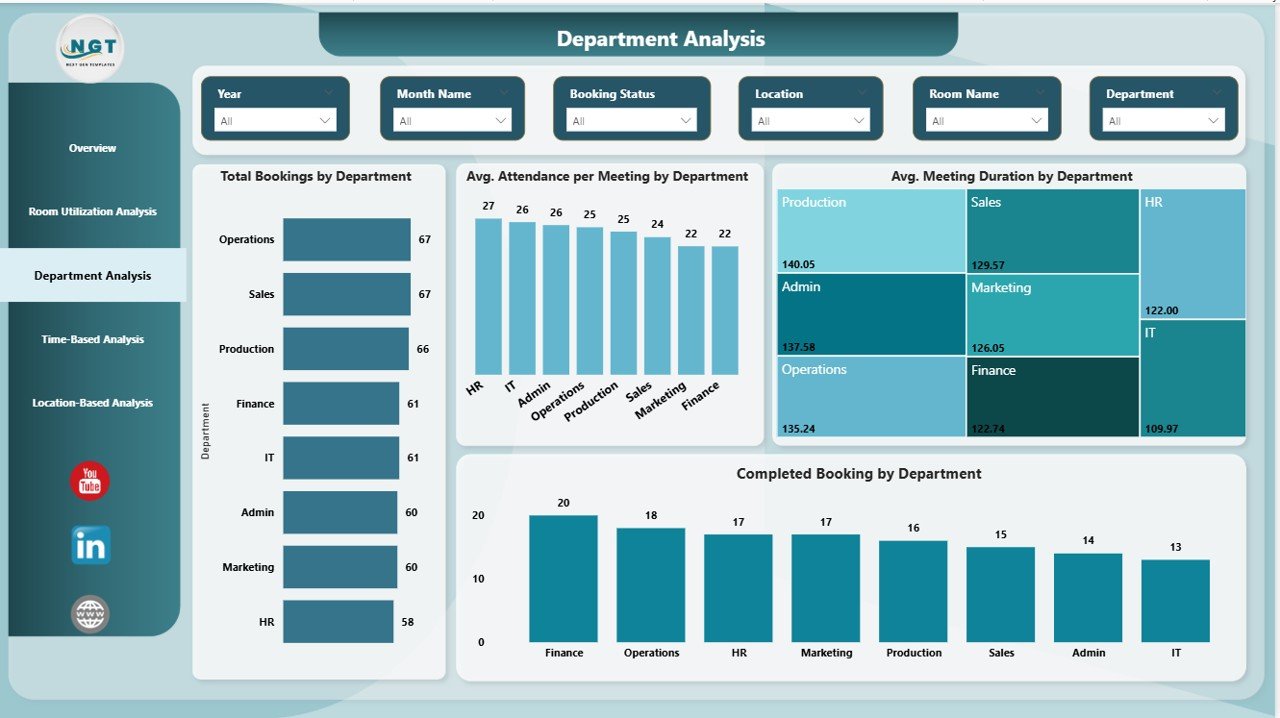
📌 Department Analysis
Analyzes how departments use meeting rooms, including attendance and meeting length.
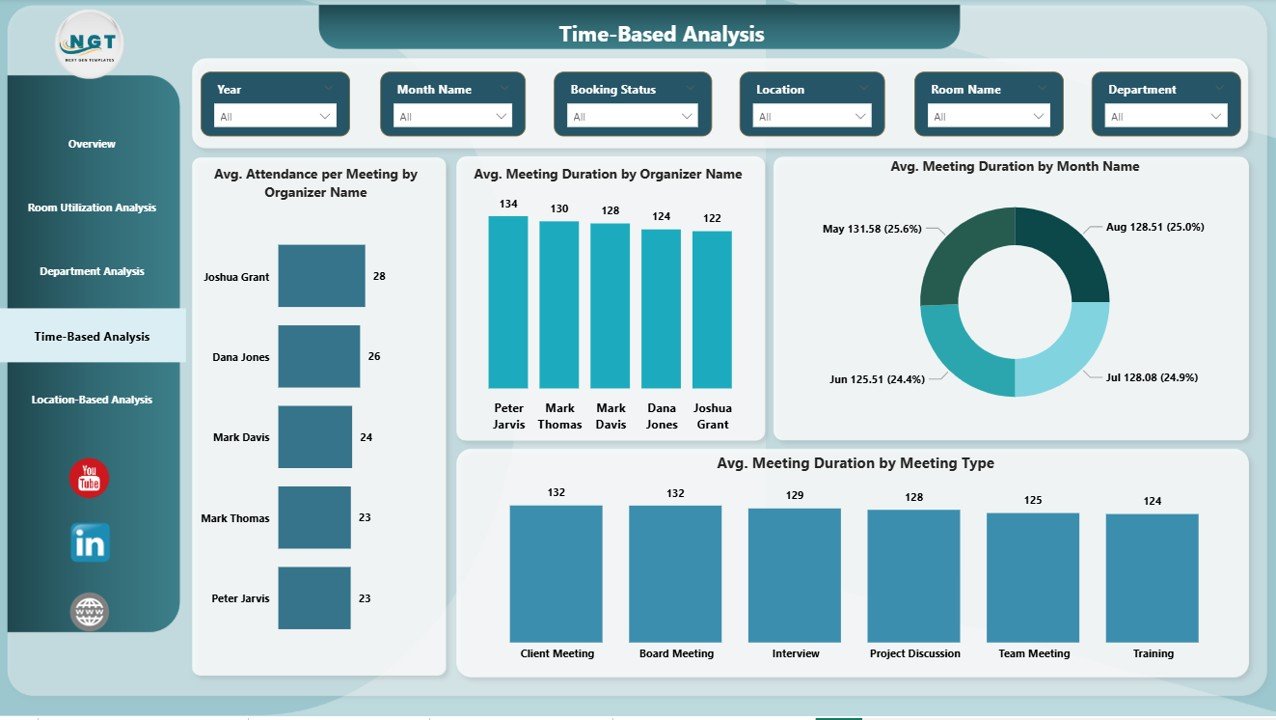
📌 Time-Based Analysis
Highlights trends by organizer, month, and meeting type to reduce meeting fatigue.
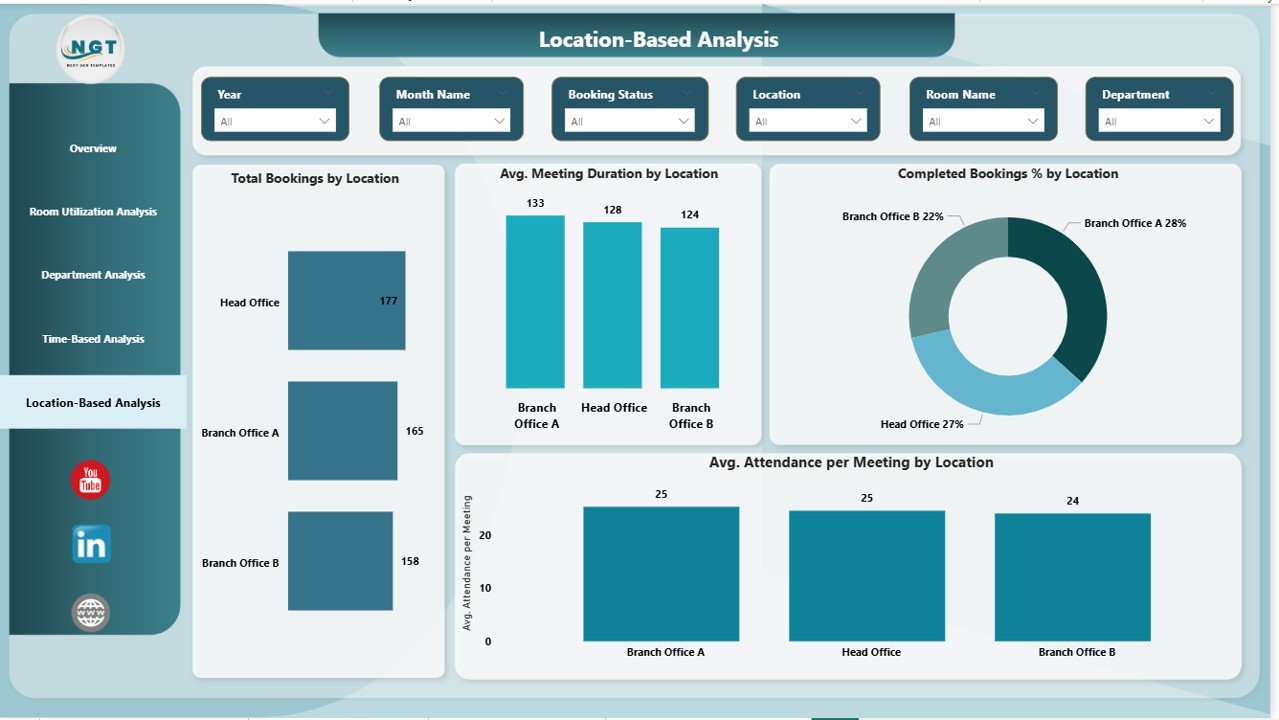
📌 Location-Based Analysis
Compares utilization, attendance, and completion rates across locations.
Each page is designed for quick understanding, clean visuals, and actionable insights.
⚙️ How to Use the Meeting Room Utilization Dashboard in Power BI
Using this dashboard is simple—even for non-technical users:
1️⃣ Maintain your meeting room booking data in Excel
2️⃣ Load the data into the Power BI file
3️⃣ Refresh the dashboard
4️⃣ Use slicers to filter by room, department, time, or location
5️⃣ Instantly analyze utilization patterns and trends
No advanced Power BI skills are required. The dashboard is ready to use and easy to maintain.
👥 Who Can Benefit from This Meeting Room Utilization Dashboard in Power BI
🏢 Facility Managers – Optimize room usage and reduce real estate costs
👩💼 HR Teams – Improve employee experience and meeting culture
🧾 Office Administrators – Manage bookings more efficiently
📊 Leadership Teams – Make data-driven workspace decisions
💻 IT & Operations Teams – Support analytics-driven workplace planning
If your organization conducts meetings, this dashboard delivers value.
Click here to read the Detailed blog post
Watch the step-by-step video tutorial:
Visit our YouTube channel to learn step-by-step video tutorials


Reviews
There are no reviews yet.