Legal Advisory KPI Dashboard teams operate under constant pressure. They manage compliance, contracts, litigation, regulatory matters, and strategic advisory work, all while meeting strict deadlines and minimizing organizational risk. However, measuring legal performance remains a challenge. Many legal departments still rely on emails, spreadsheets, and static reports. As a result, visibility is limited, trends are missed, and leadership struggles to evaluate legal efficiency.
That is exactly where the Legal Advisory KPI Dashboard in Power BI becomes a transformative solution ⚖️📊.
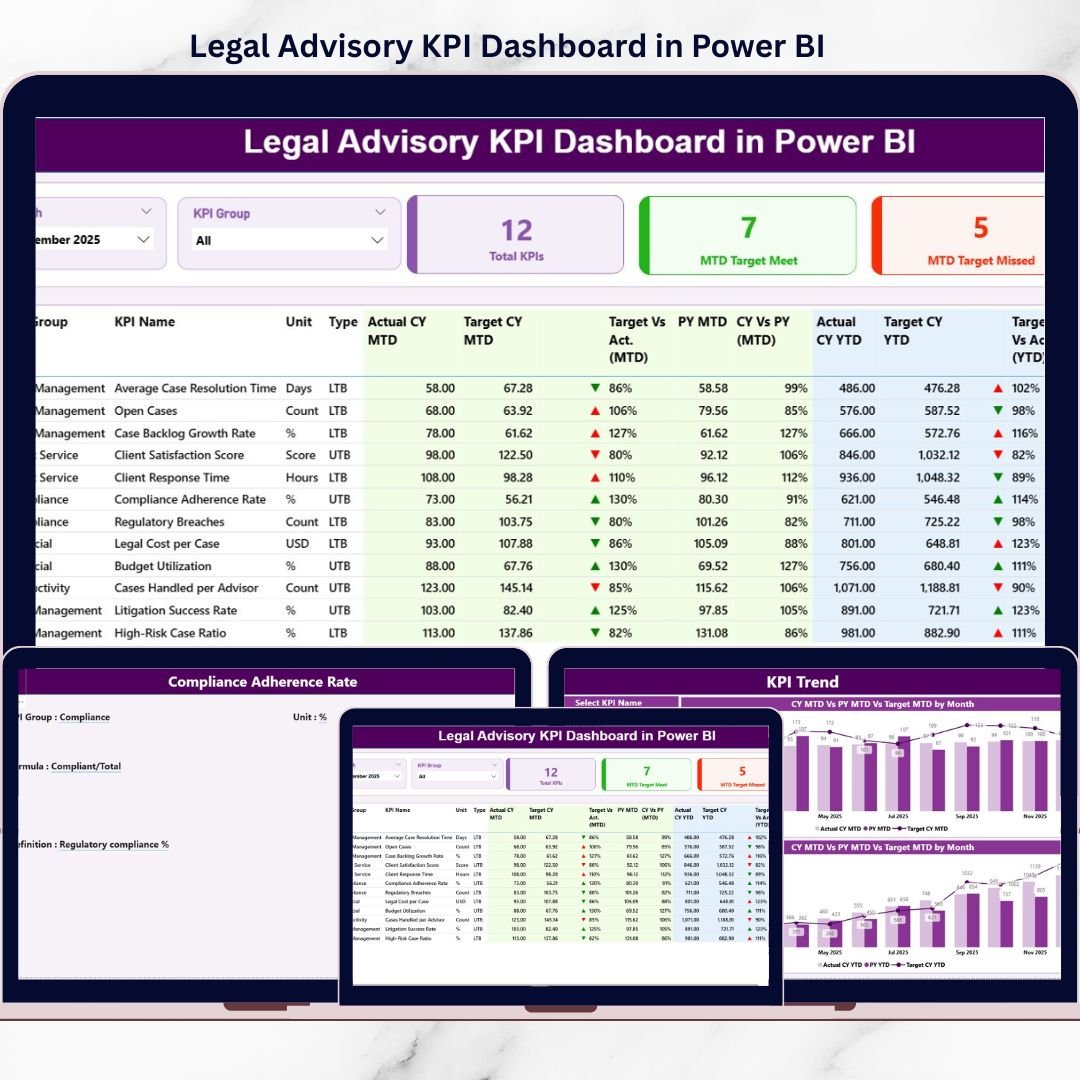
This ready-to-use Power BI dashboard helps legal advisory teams track, analyze, and monitor key legal KPIs in a centralized, interactive, and visual environment. Instead of manual tracking and reactive reporting, teams gain real-time insights into legal performance, supported by structured KPIs and clear comparisons.
By combining Excel-based data input with Power BI’s interactive analytics, this dashboard enables legal teams to move from fragmented reporting to data-driven legal management.
## Key Features of Legal Advisory KPI Dashboard in Power BI 🚀
This dashboard is designed to bring clarity and control to legal performance tracking.
📊 Centralized Legal KPI Monitoring
Track all legal advisory KPIs in one Power BI dashboard.
🎛️ Interactive Month & KPI Group Slicers
Filter insights instantly by reporting month and KPI category.
📈 MTD & YTD Performance Tracking
Monitor Month-to-Date and Year-to-Date actuals against targets and previous year values.
🚦 Visual Performance Indicators
Green ▲ and red ▼ icons instantly highlight KPI status.
📉 Trend Analysis with Combo Charts
Analyze MTD and YTD performance trends for better foresight.
📂 Excel-Based Data Source
Update data easily in Excel without technical complexity.
⚡ Power BI Interactivity
Drill, filter, and explore legal insights dynamically.
## What’s Inside the Legal Advisory KPI Dashboard in Power BI 📂
This dashboard includes three well-structured Power BI pages, supported by a clean Excel data model.
🟦 Summary Page
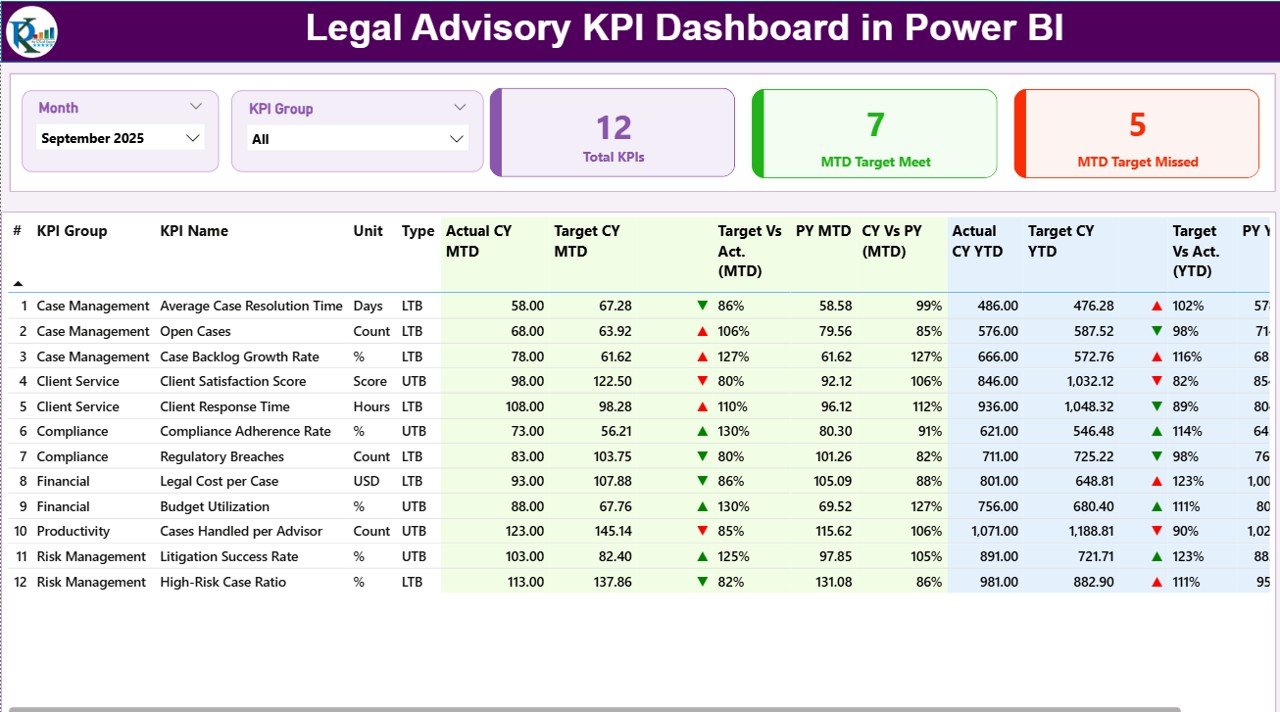
The main performance view showing KPI cards, slicers, and a detailed KPI table with MTD and YTD comparisons.
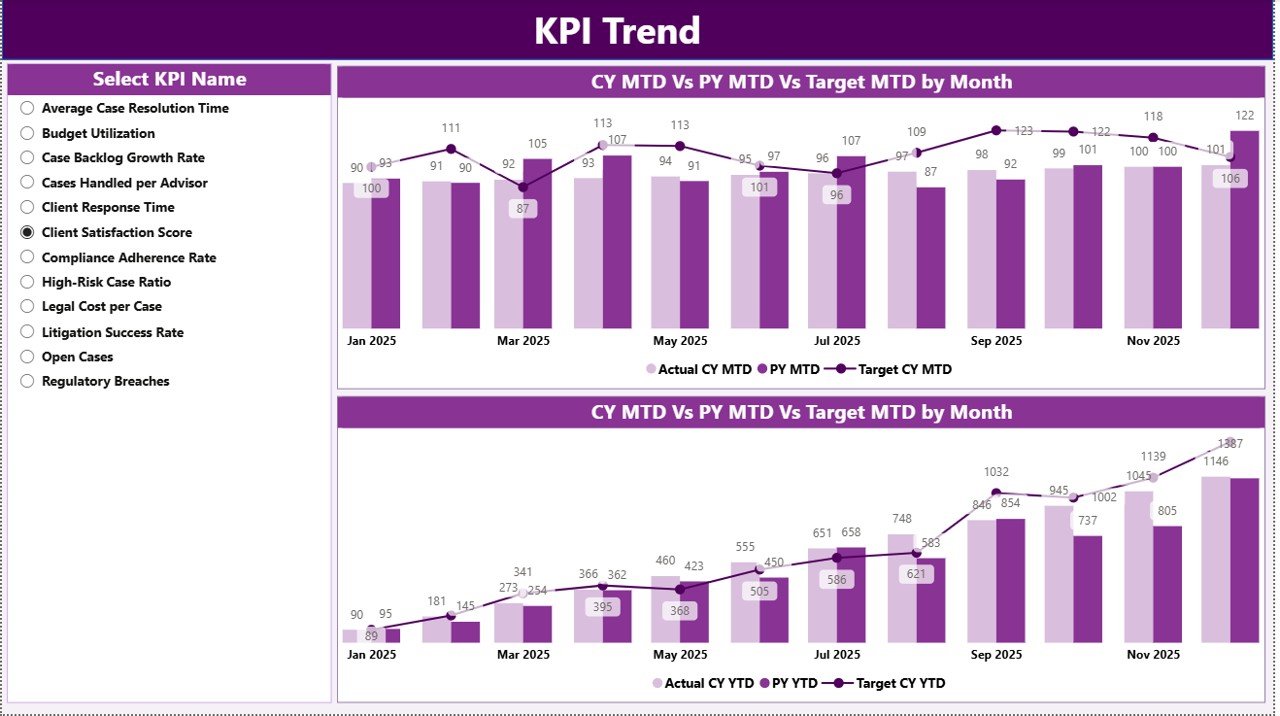
🟦 KPI Trend Page
Displays MTD and YTD combo charts for selected KPIs, helping teams analyze improvement or decline over time.
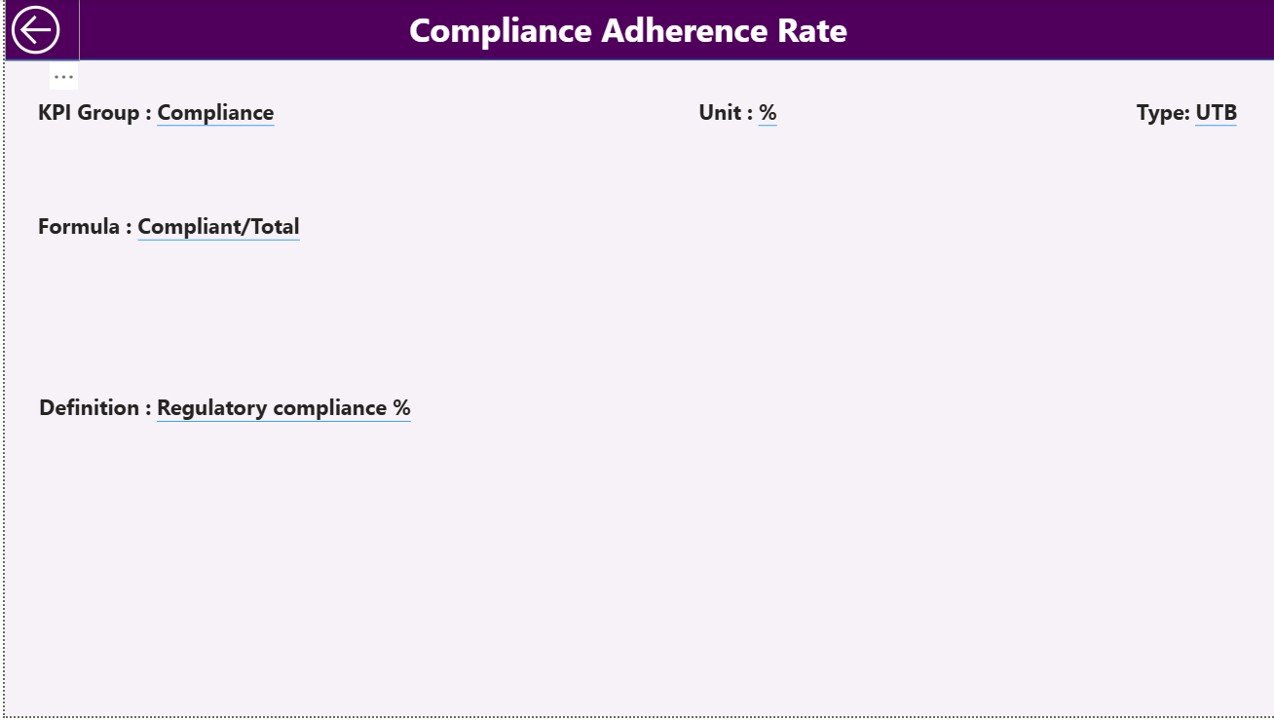
🟦 KPI Definition Page
A drill-through reference page displaying KPI formula, definition, unit, and type (LTB or UTB).
The Excel data source includes:
• Input_Actual Sheet – Stores actual MTD and YTD values
• Input_Target Sheet – Stores target MTD and YTD values
• KPI Definition Sheet – Documents KPI structure and logic
Together, these components create a robust legal performance analytics framework.
## How to Use the Legal Advisory KPI Dashboard in Power BI 🧩
Using the dashboard is simple and business-friendly:
1️⃣ Update actual values in the Excel Input_Actual sheet
2️⃣ Enter targets in the Input_Target sheet
3️⃣ Maintain KPI details in the KPI Definition sheet
4️⃣ Refresh the Power BI file
5️⃣ Use slicers, tables, and charts to analyze performance
Power BI automatically handles calculations and visuals—allowing teams to focus on legal decisions, not reporting.
## Who Can Benefit from This Legal Advisory KPI Dashboard in Power BI 👥
This dashboard is ideal for:
✔️ Legal Advisory Teams
✔️ Corporate Legal Departments
✔️ Compliance & Risk Officers
✔️ Legal Operations Managers
✔️ General Counsels
✔️ Executive & Leadership Teams
Both technical and non-technical users can adopt this dashboard easily.
### Click here to read the Detailed blog post
Visit our YouTube channel to learn step-by-step video tutorials
👉 YouTube.com/@PKAnExcelExpert


Reviews
There are no reviews yet.