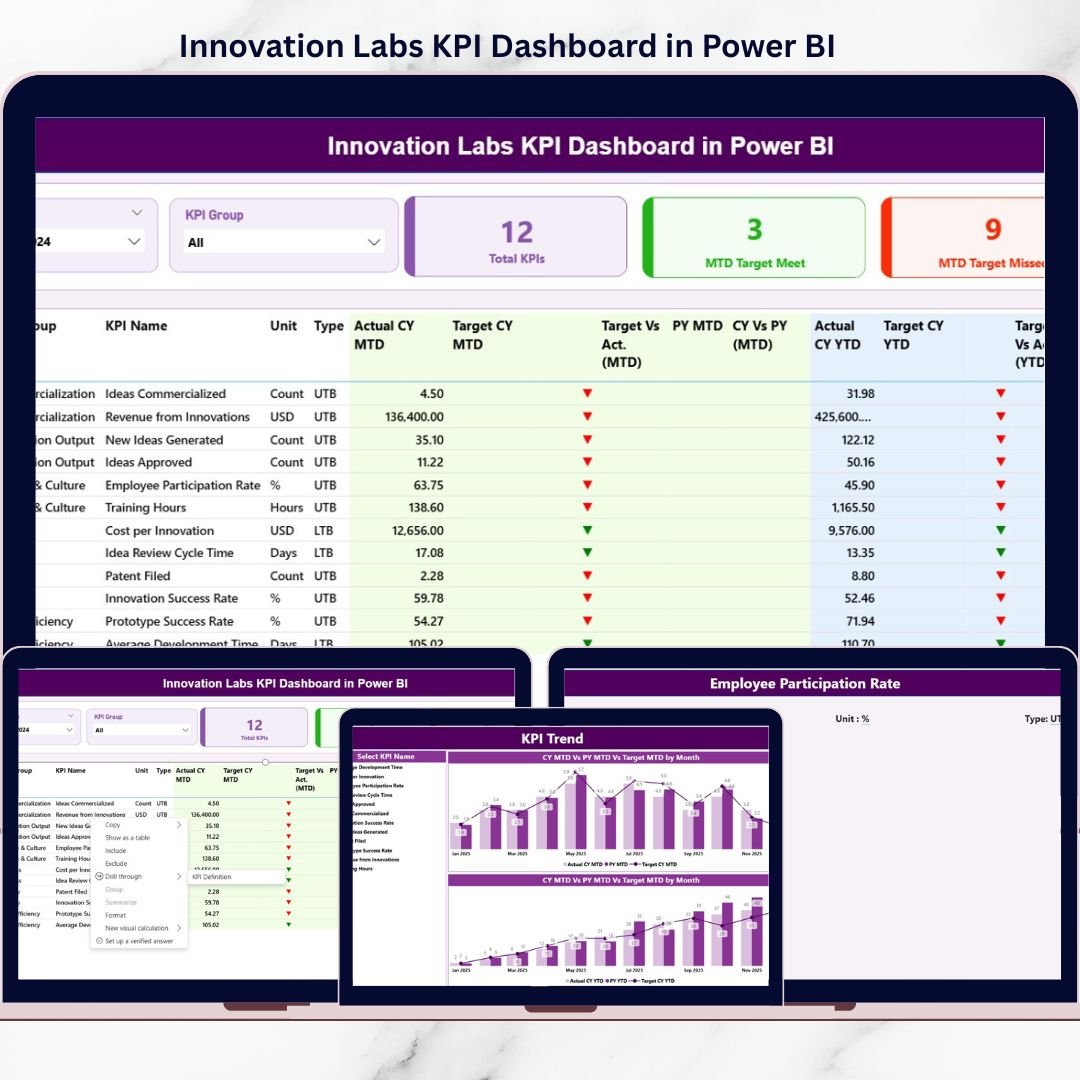
Innovation labs are where bold ideas take shape—but without proper measurement, innovation quickly turns into guesswork. That is exactly why the Innovation Labs KPI Dashboard in Power BI is a must-have solution for modern organizations that want to turn creativity into measurable business outcomes.
This ready-to-use Power BI dashboard is designed to help innovation teams, R&D leaders, and decision-makers track performance, monitor targets, and evaluate innovation success with absolute clarity. Instead of managing scattered Excel files, static charts, or manual reports, this dashboard brings all innovation KPIs into one centralized, interactive, and visual analytics platform.
By connecting Power BI directly to Excel, this dashboard ensures flexibility and ease of use. You simply update the Excel input sheets, refresh Power BI, and instantly see updated insights—no complex formulas or technical expertise required.
## 🚀 Key Features of Innovation Labs KPI Dashboard in Power BI
✨ Centralized Innovation Performance Tracking
Monitor all innovation KPIs in one structured Power BI dashboard.
📊 MTD & YTD KPI Monitoring
Track Month-to-Date and Year-to-Date actuals, targets, and trends effortlessly.
🎯 Target vs Actual Analysis
Instantly identify KPIs that are met or missed using visual indicators.
📈 Year-over-Year Comparisons
Analyze performance growth by comparing current year data with previous year values.
🎛️ Interactive Slicers
Filter data by Month and KPI Group to focus on what matters most.
🔍 Detailed KPI Performance Table
View KPI-level breakdown with units, types (UTB/LTB), targets, actuals, and variances.
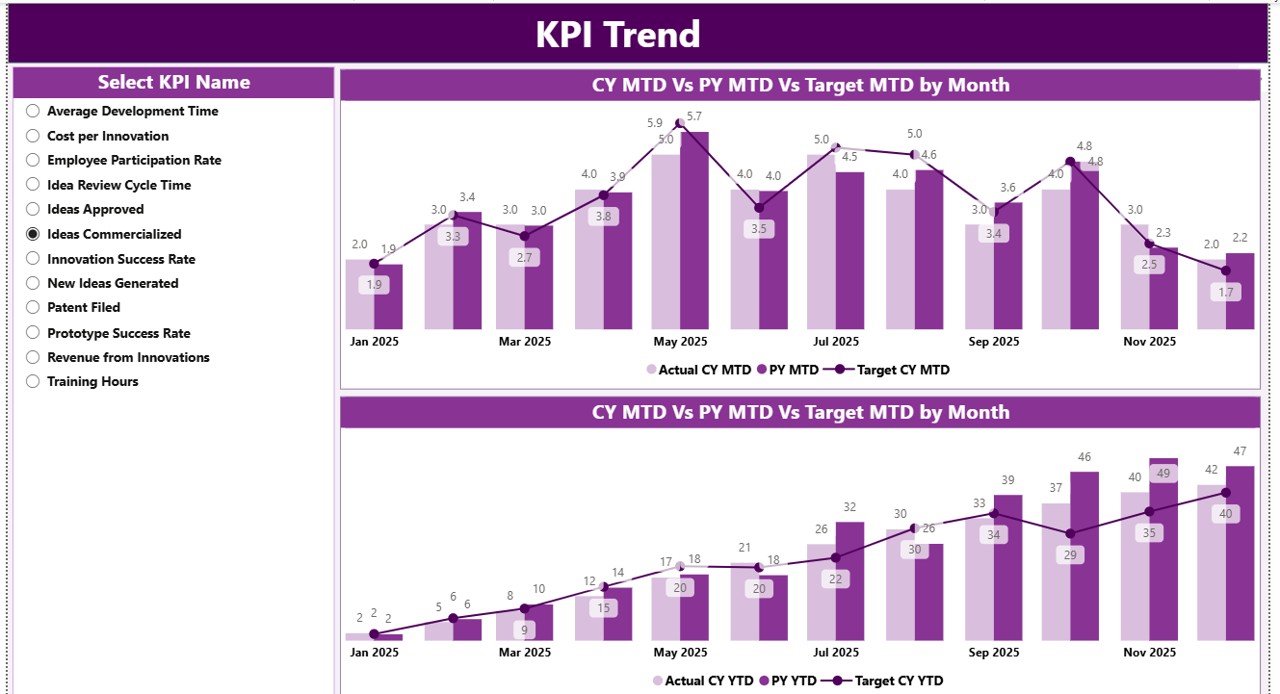
📉 Trend Analysis with Combo Charts
Analyze MTD and YTD trends using dynamic charts for deeper insights.
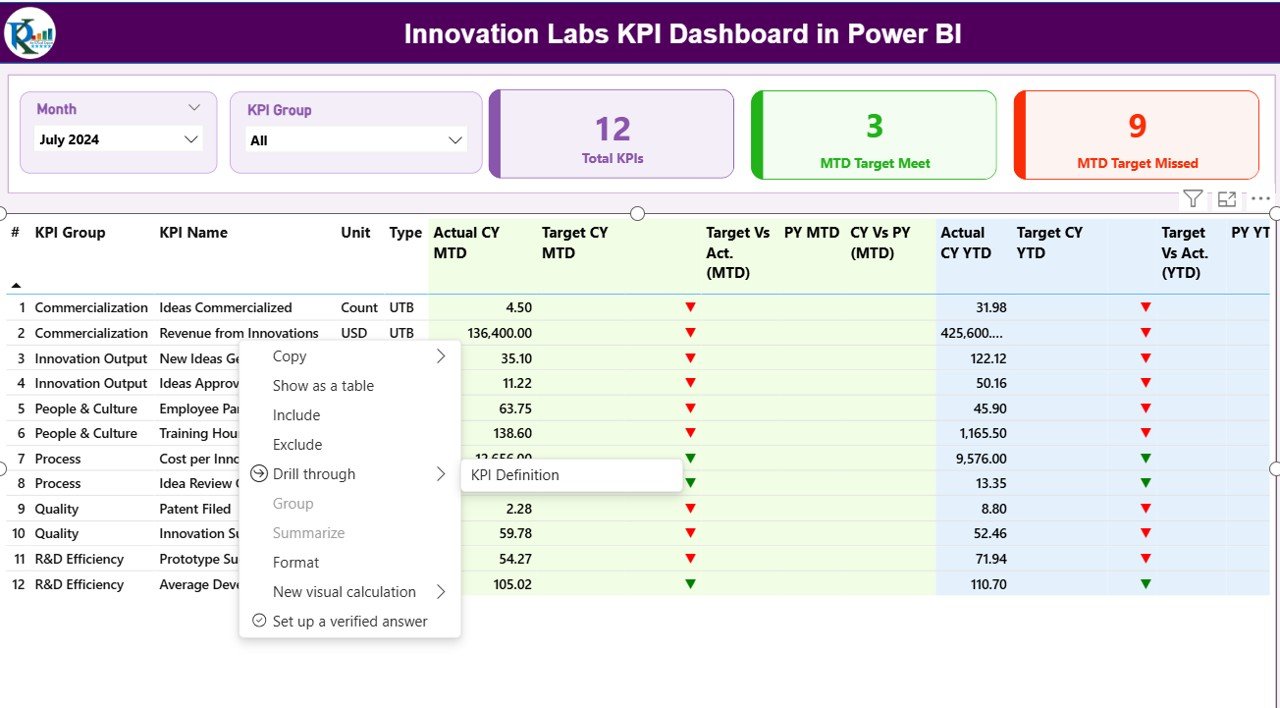
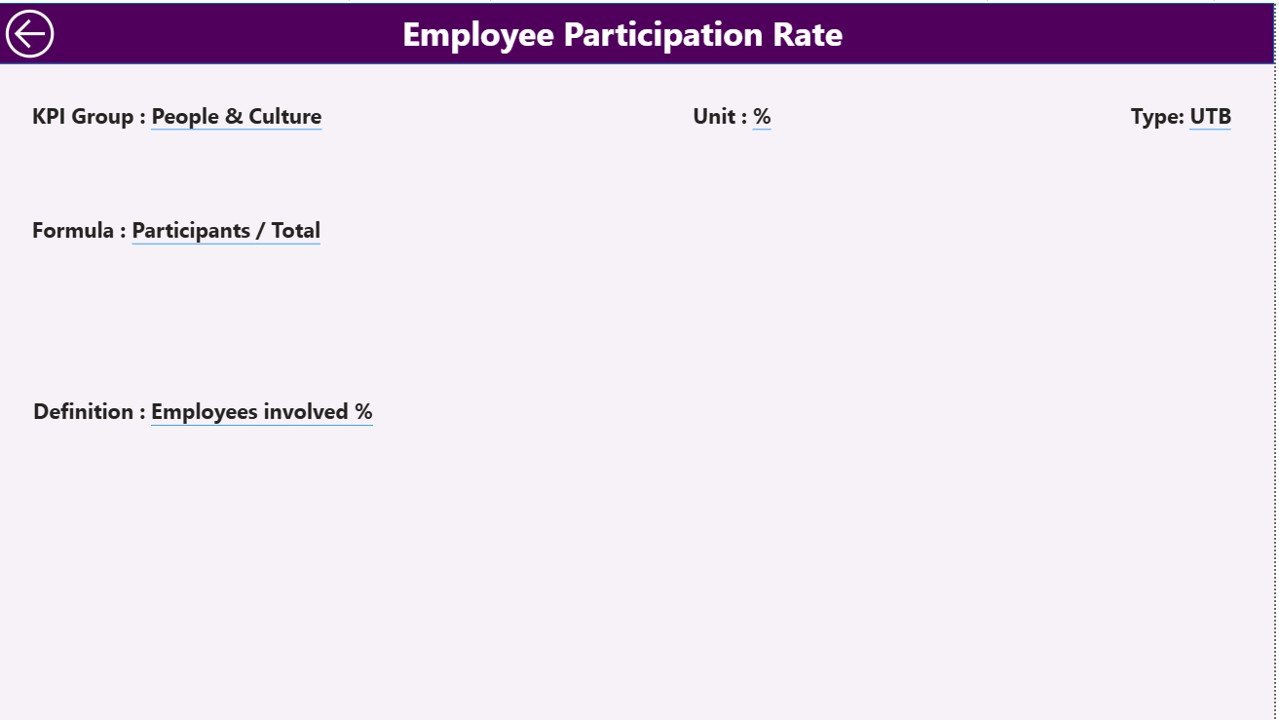
📘 KPI Definition Drill-Through Page
Access KPI formulas, definitions, units, and logic instantly with drill-through functionality.
## 📦 What’s Inside the Innovation Labs KPI Dashboard in Power BI
This Power BI file includes three professionally designed pages, each serving a specific purpose:
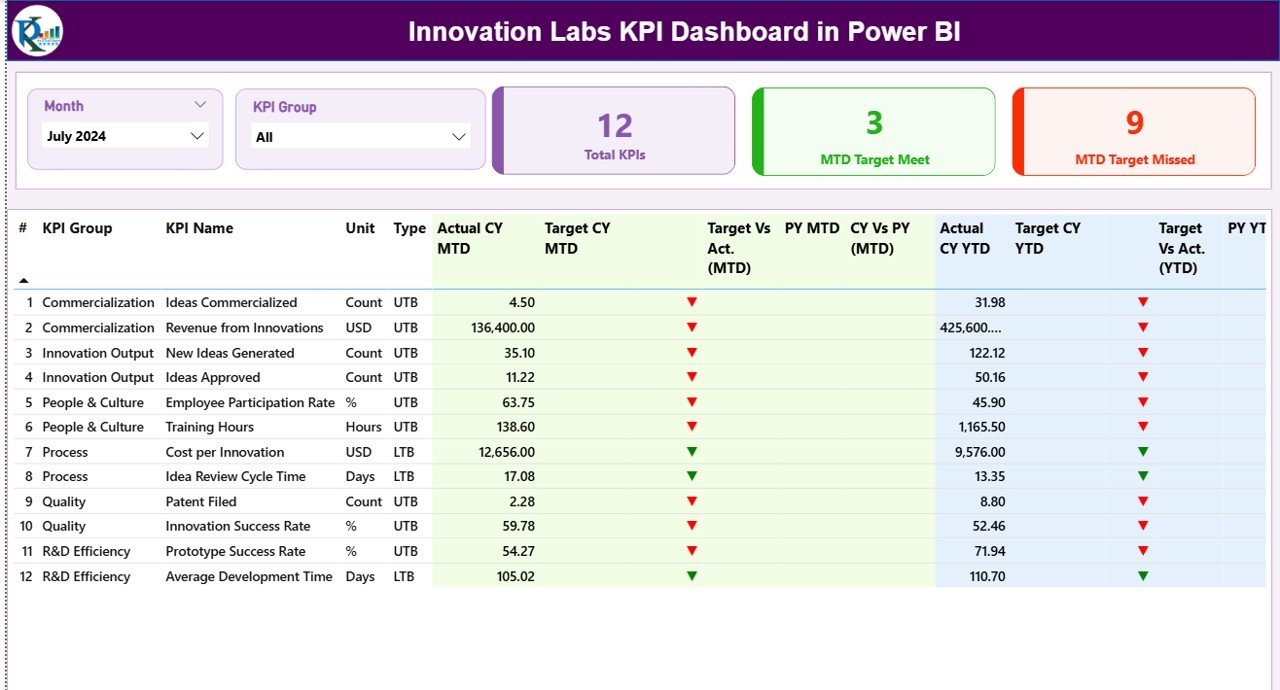
📌 Summary Page
A complete snapshot of innovation performance with slicers, KPI cards, and a detailed KPI table showing MTD and YTD metrics along with performance icons.
📌 KPI Trend Page
Analyze KPI movement across months using combo charts that compare Actual vs Target vs Previous Year for both MTD and YTD.
📌 KPI Definition Page
A drill-through page that displays KPI formulas, definitions, units, and UTB/LTB logic to ensure transparency and governance.
The dashboard connects to three Excel input sheets:
-
Input_Actual – Enter MTD and YTD actual values
-
Input_Target – Enter MTD and YTD target values
-
KPI Definition – Maintain KPI master data
## 🛠️ How to Use the Innovation Labs KPI Dashboard in Power BI
Using this dashboard is simple and user-friendly:
1️⃣ Update KPI actuals and targets in the Excel input sheets
2️⃣ Open the Power BI file
3️⃣ Click Refresh
4️⃣ Use slicers to filter by Month or KPI Group
5️⃣ Analyze performance, trends, and gaps instantly
No Power BI Service is required. Everything works seamlessly in Power BI Desktop.
## 👥 Who Can Benefit from This Innovation Labs KPI Dashboard in Power BI
This dashboard is ideal for:
🏢 Innovation Labs & R&D Teams
📊 Innovation Managers & Program Leads
🚀 Digital Transformation Teams
📈 Strategy & Business Excellence Teams
🧠 CXOs & Leadership Teams
🏭 Organizations running pilots, experiments, or innovation initiatives
If your team values clarity, accountability, and data-driven innovation, this dashboard is built for you.
Click here to read the detailed blog post
Watch the step-by-step video tutorial:


Reviews
There are no reviews yet.