In a world where data privacy failures can destroy trust overnight, organizations cannot afford delayed reports, scattered spreadsheets, or unclear compliance metrics. Data Privacy Offices are expected to track regulations, monitor risks, respond to incidents, and report performance—all with speed and accuracy.
That’s where the Data Privacy Office KPI Dashboard in Excel becomes a powerful advantage.
This ready-to-use Excel dashboard helps privacy teams monitor, measure, and manage data privacy performance from a single file. Instead of reacting to issues after they occur, this dashboard enables proactive compliance, structured reporting, and confident decision-making—without expensive BI tools.
🚀 Key Feature of Data Privacy Office KPI Dashboard in Excel
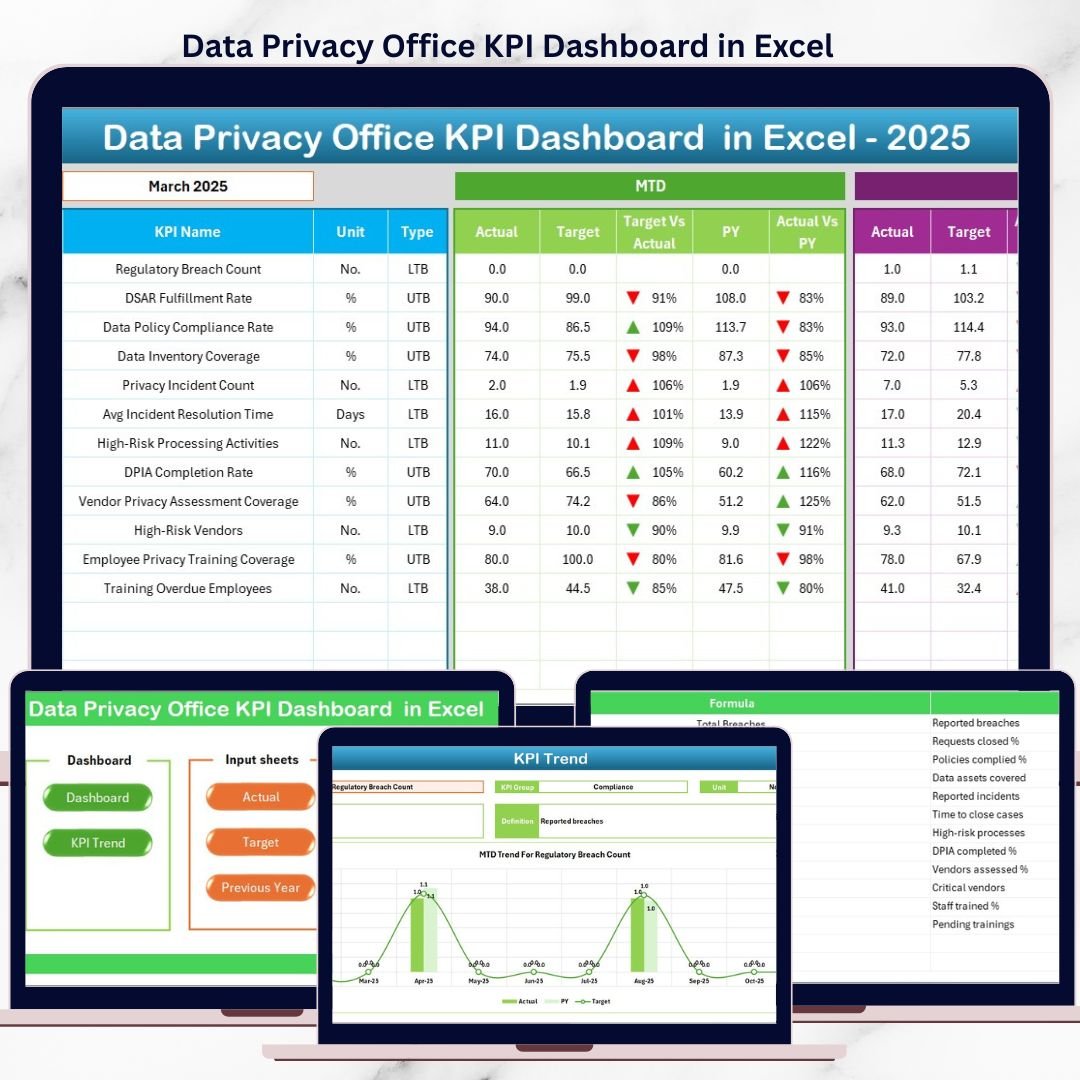
📌 Centralized KPI Monitoring
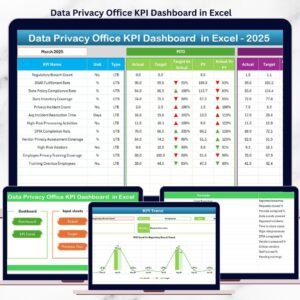
Track all critical data privacy KPIs in one structured and interactive Excel dashboard.
📌 MTD & YTD Performance Tracking
Instantly compare Month-to-Date and Year-to-Date actuals against targets and previous year values.
📌 Target vs Actual & PY Comparisons
Built-in comparisons help identify gaps, improvements, and compliance risks quickly.
📌 Interactive Month Selection
Change the reporting month using a drop-down and watch the entire dashboard update automatically.
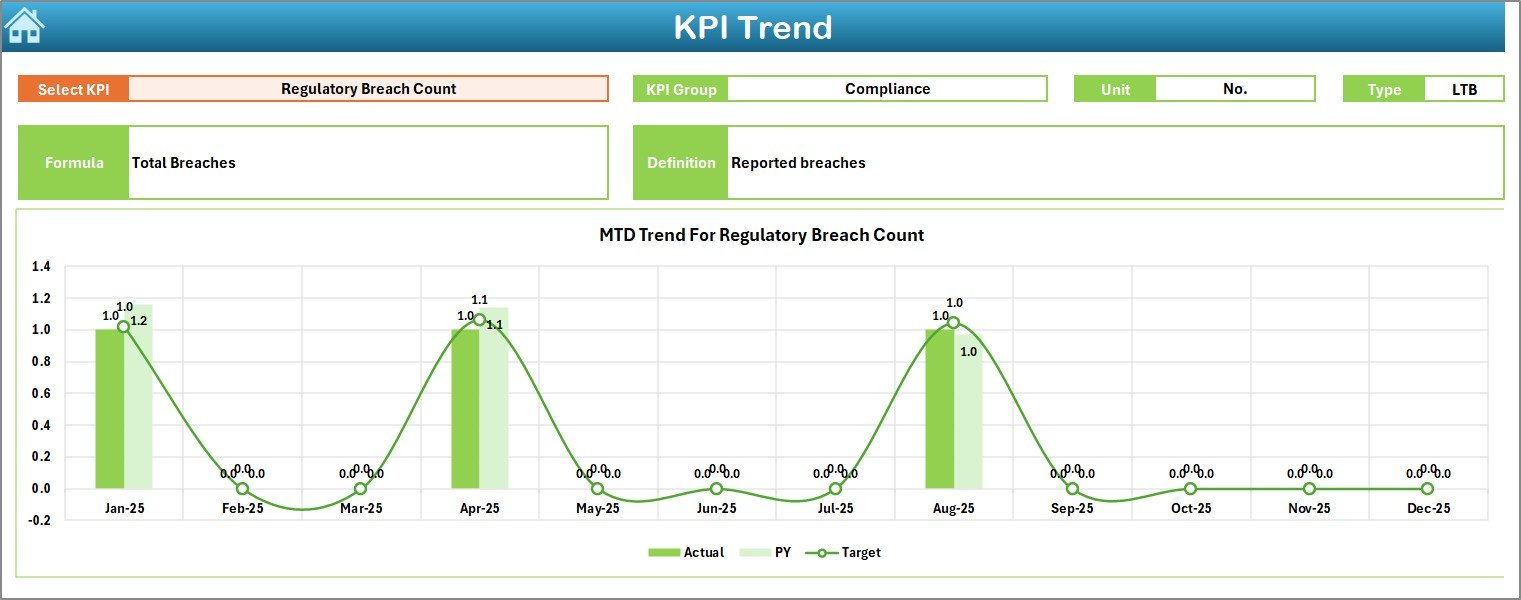
📌 Trend Analysis with Visuals
Identify patterns and risks using MTD and YTD trend charts for each KPI.
📌 Conditional Formatting Indicators
Up/down arrows and visual cues highlight positive and negative performance instantly.
📌 Excel-Native & Easy to Maintain
No macros, no external tools—just clean formulas, drop-downs, and charts.
📦 What’s Inside the Data Privacy Office KPI Dashboard in Excel
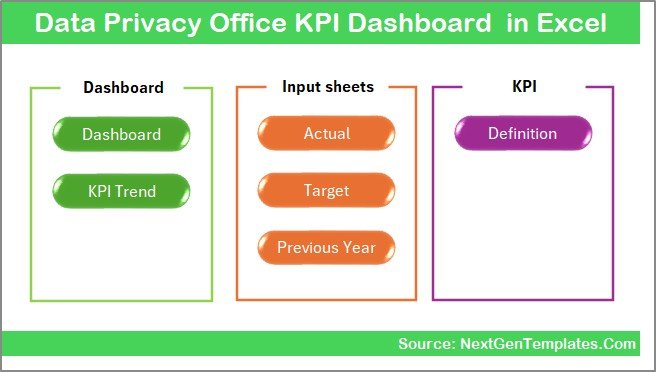
📄 Summary Page (Index Sheet)
A clean navigation hub with clickable buttons to move across all major sections easily.
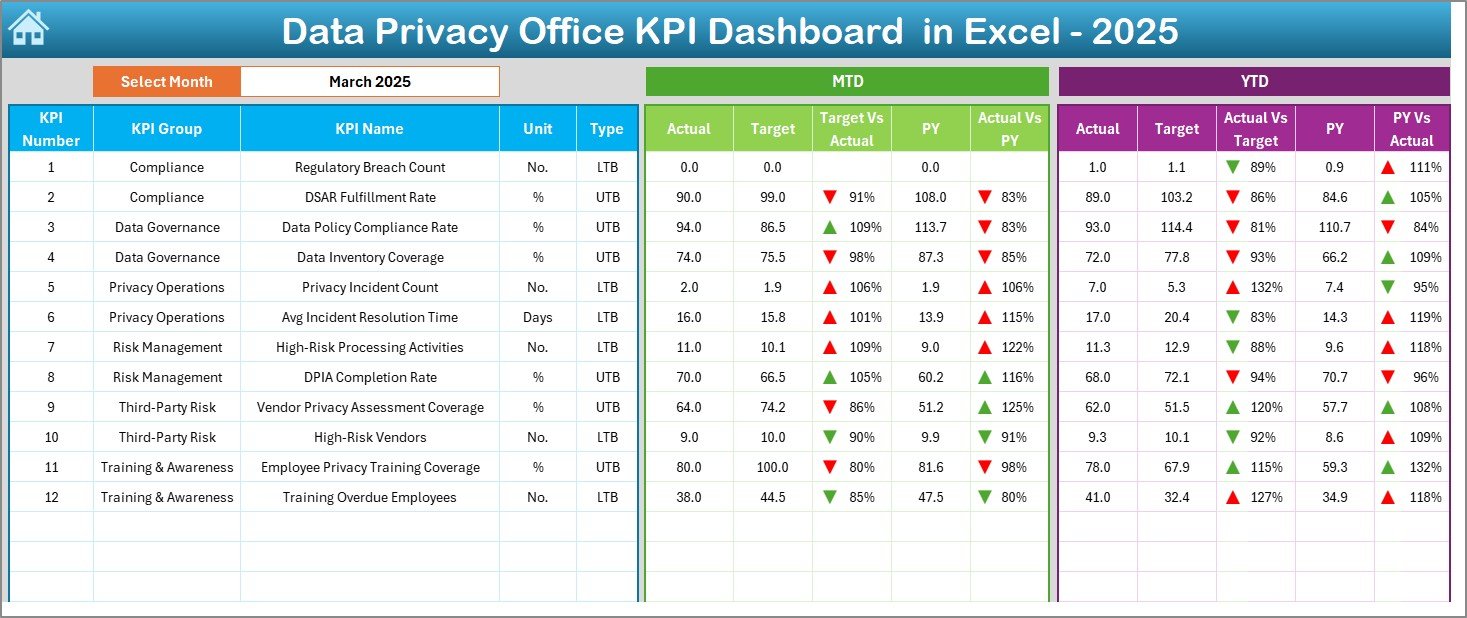
📊 Dashboard Sheet
The main executive view showing:
-
MTD Actual vs Target
-
MTD Actual vs Previous Year
-
YTD Actual vs Target
-
YTD Actual vs Previous Year
📈 Trend Sheet
Deep KPI-level analysis with:
-
KPI selector drop-down
-
KPI group, unit, type, formula, and definition
-
MTD & YTD trend charts
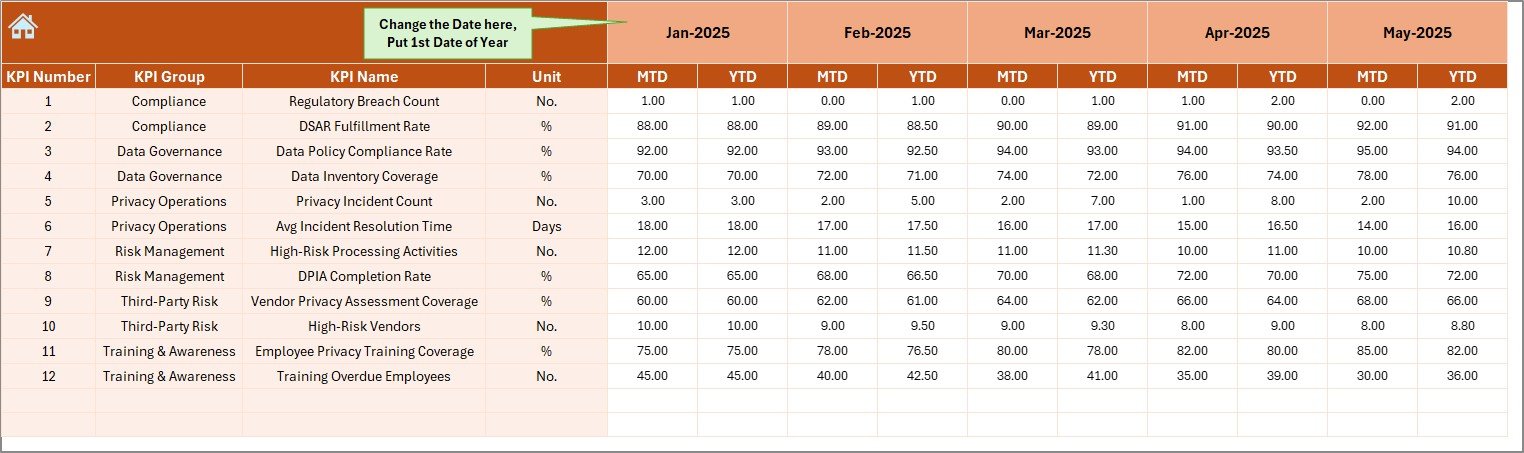
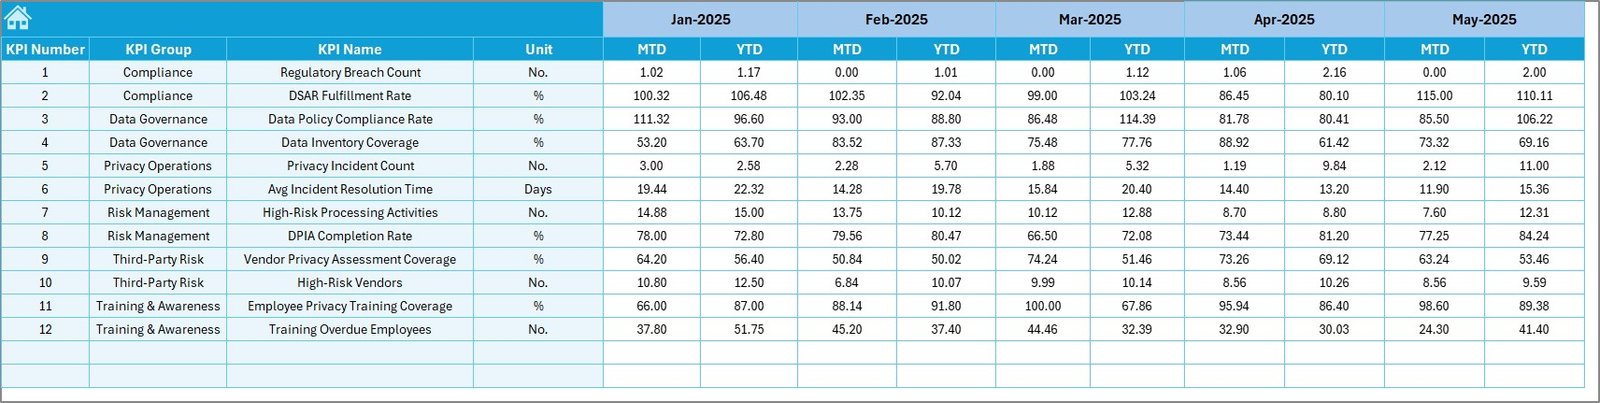
🧮 Actual Numbers Input Sheet
Simple data entry for monthly actual KPI values with dynamic month control.
🎯 Target Sheet
Dedicated sheet to store MTD and YTD targets without disturbing historical data.
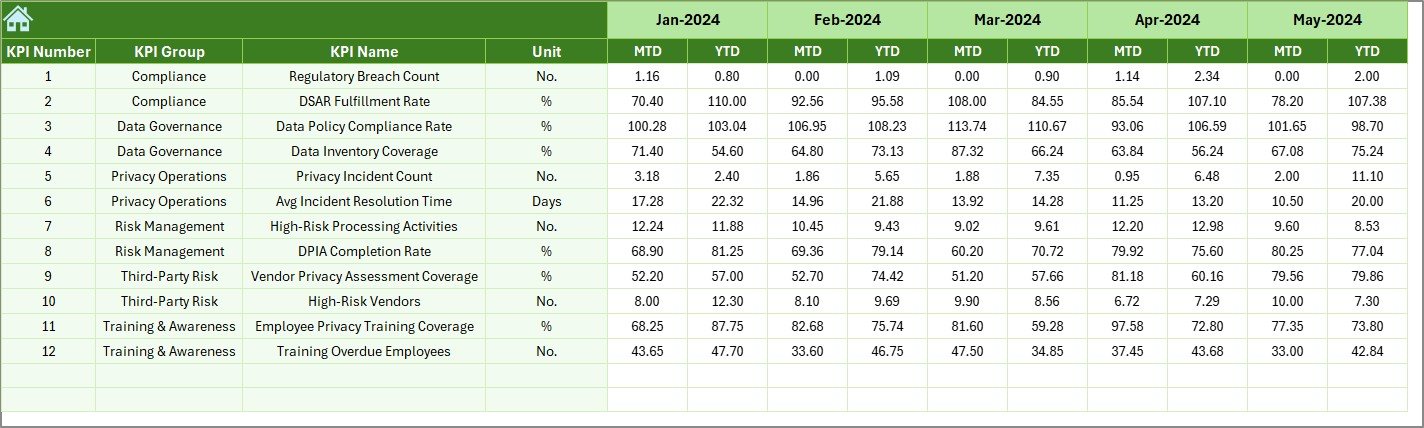
📂 Previous Year Numbers Sheet
Supports year-over-year benchmarking and performance evaluation.
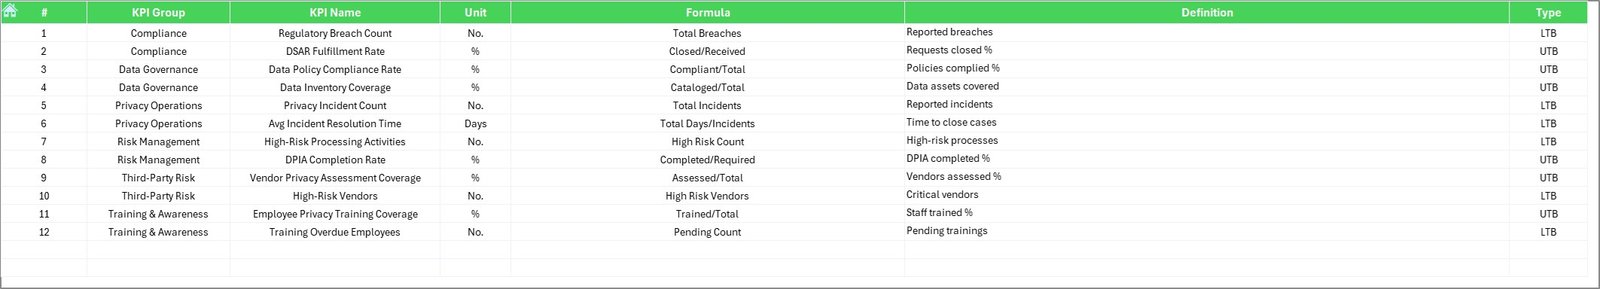
📘 KPI Definition Sheet
Centralized KPI governance with names, formulas, units, and definitions.
🛠️ How to Use the Data Privacy Office KPI Dashboard in Excel
1️⃣ Enter monthly actual KPI values in the Actual Numbers sheet
2️⃣ Maintain targets in the Target Sheet
3️⃣ Update previous year data once for benchmarking
4️⃣ Select the reporting month from the dashboard drop-down
5️⃣ Review MTD, YTD, Target, and PY comparisons instantly
6️⃣ Analyze trends and risks using the Trend Sheet
7️⃣ Share executive-ready insights with leadership and auditors
No advanced Excel skills required—basic Excel knowledge is enough.
👥 Who Can Benefit from This Data Privacy Office KPI Dashboard
✅ Data Protection Officers (DPOs)
✅ Privacy & Compliance Managers
✅ Risk and Governance Teams
✅ Internal Audit Teams
✅ Legal & Regulatory Teams
✅ Senior Management & Leadership
Whether you manage GDPR, HIPAA, or internal privacy frameworks, this dashboard adapts easily to your needs.
Click here to read the Detailed Blog Post
Watch the step-by-step video tutorial:
Visit our YouTube channel to learn step-by-step video tutorials


Reviews
There are no reviews yet.