
Managing client billing should be simple—but in reality, late payments, partial invoices, and unclear follow-ups make it one of the biggest financial challenges for businesses. If you are still tracking invoices using scattered Excel files or manual reports, you are likely losing visibility, time, and cash.
That is exactly why the Client Billing Dashboard in Power BI is a must-have solution for finance teams, service providers, and growing organizations.
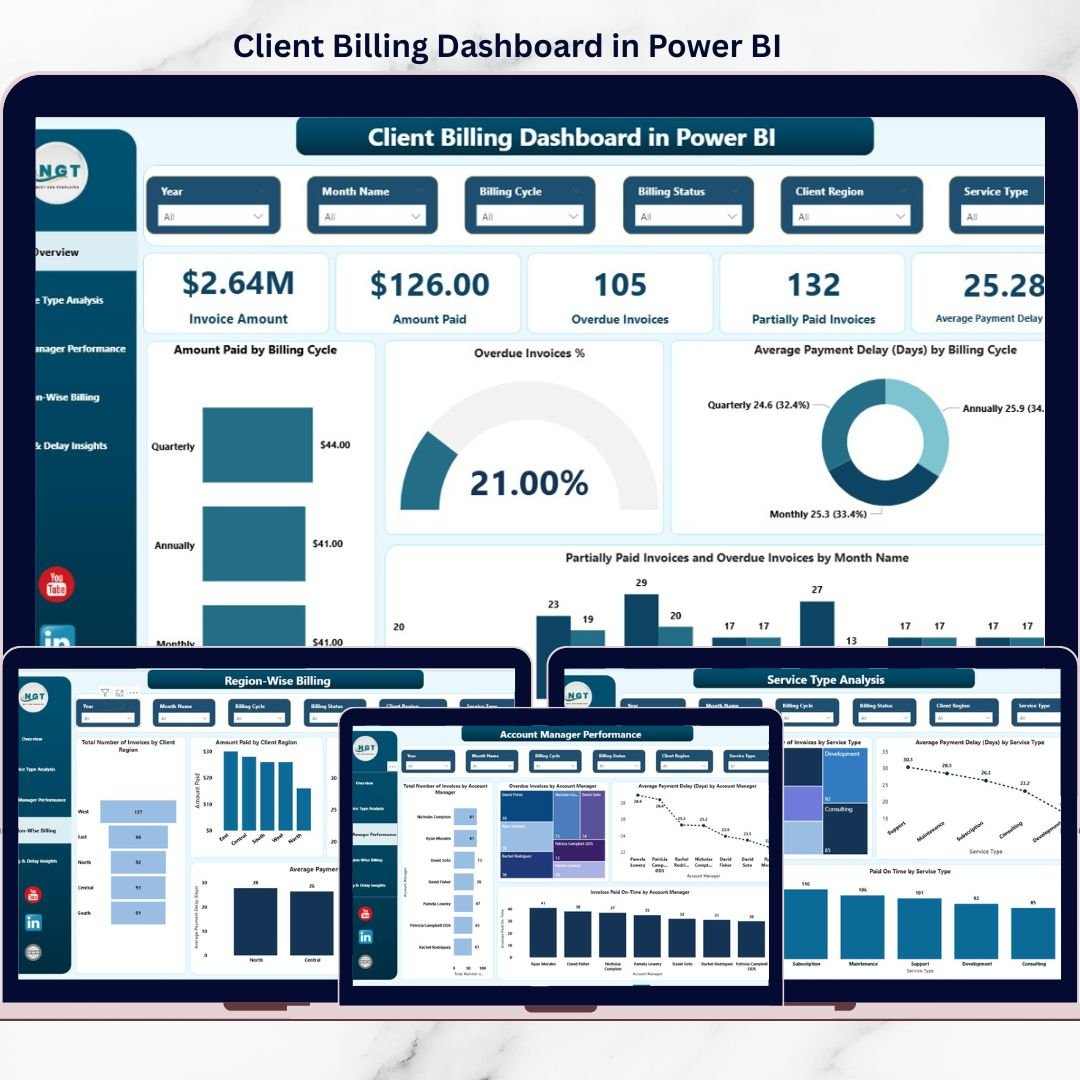
This ready-to-use Power BI dashboard converts raw billing data into clear, interactive, and actionable insights. Instead of chasing spreadsheets, you can instantly monitor paid invoices, overdue amounts, partial payments, and payment delays—all in one powerful dashboard.
Designed with simplicity and performance in mind, this dashboard helps you move from reactive billing management to proactive cash-flow control.
🚀 Key Features of Client Billing Dashboard in Power BI
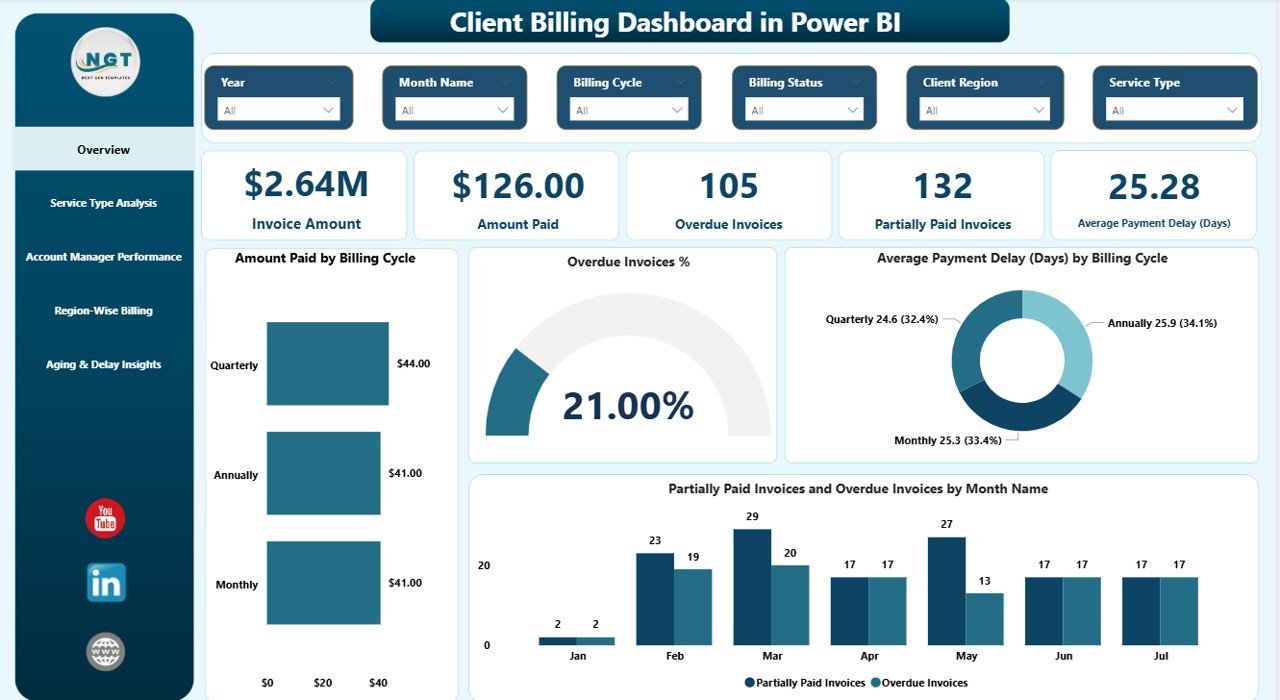
📊 Complete Billing Overview
Track total invoice amount, amount paid, partially paid invoices, overdue percentage, and average payment delay in one glance.
⏱️ Payment Delay Analysis
Identify late payments instantly using average payment delay metrics across billing cycles, regions, services, and managers.
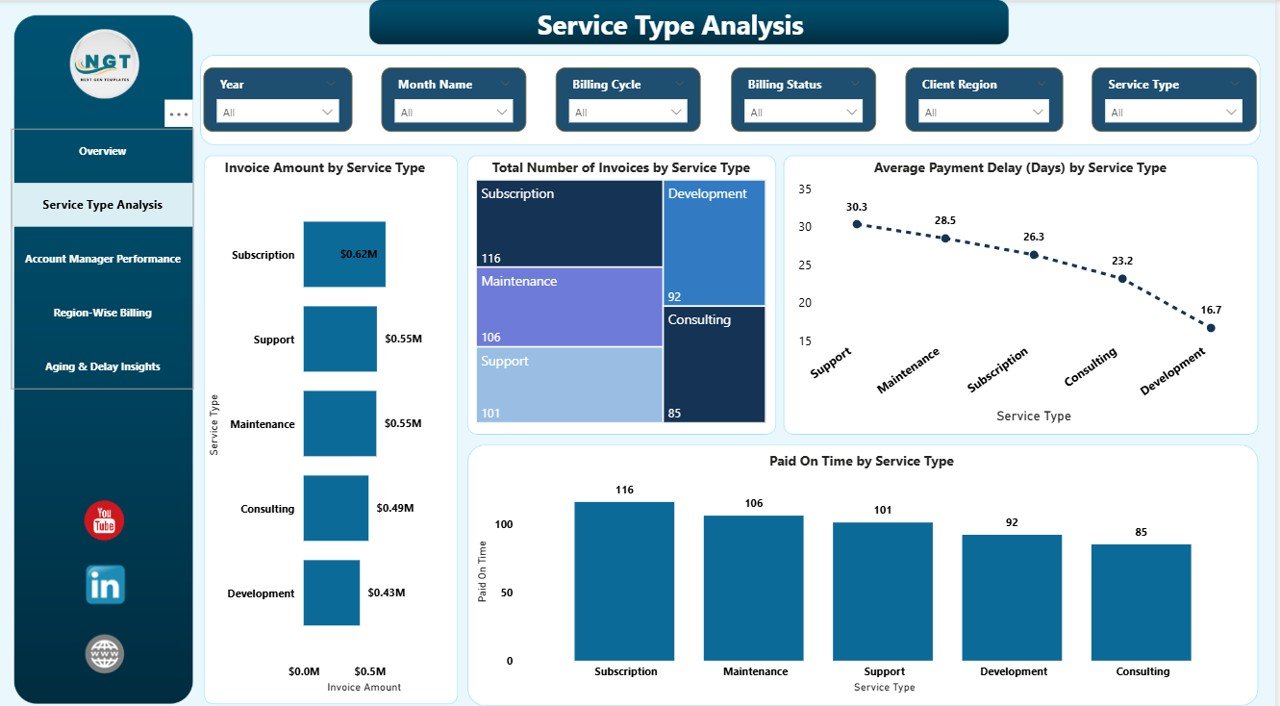
📈 Service-Wise Billing Insights
Understand which services generate maximum revenue and which face the highest payment delays.
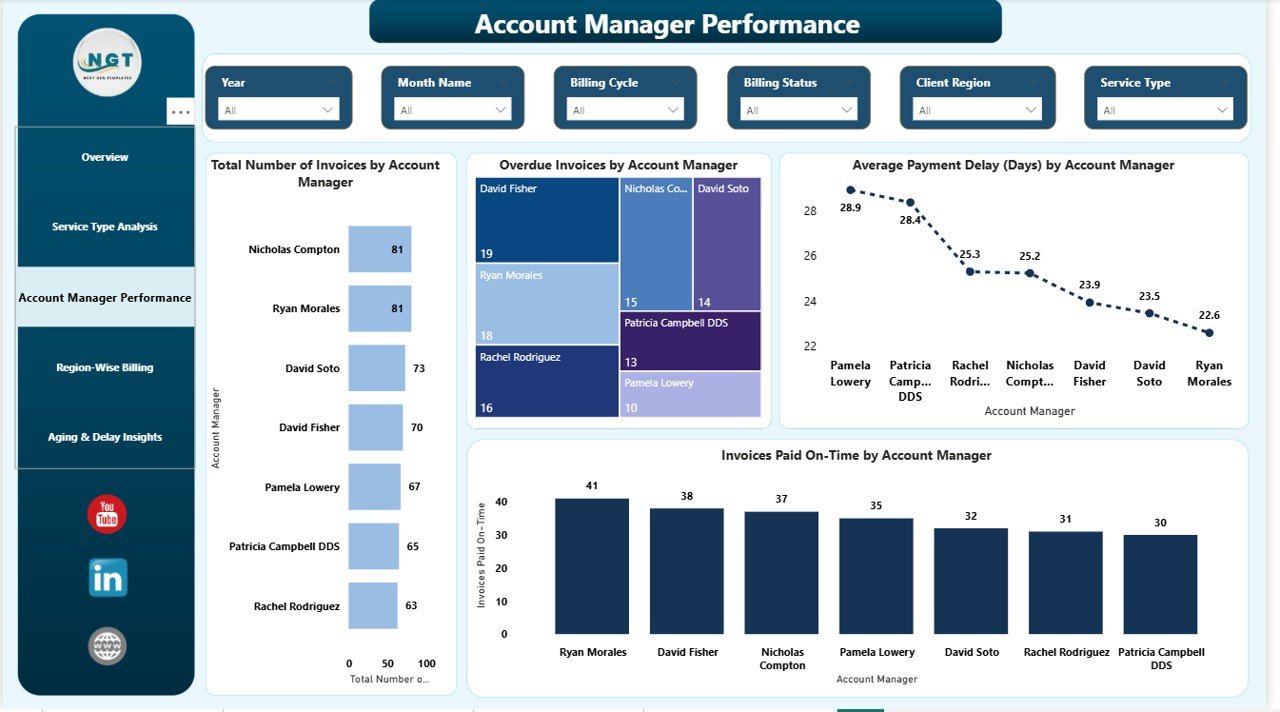
👤 Account Manager Performance Tracking
Monitor invoice workload, overdue risks, and follow-up effectiveness for each account manager.
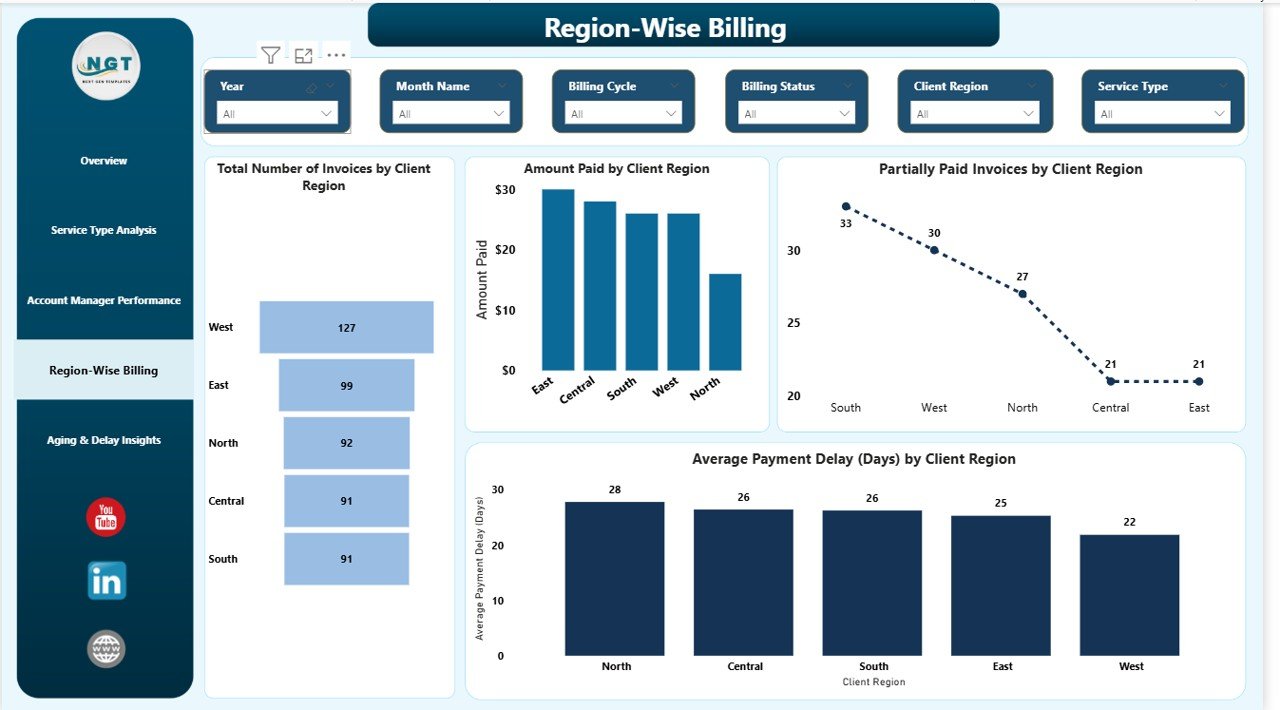
🌍 Region-Wise Billing Performance
Analyze payment behavior by client region and optimize credit policies accordingly.
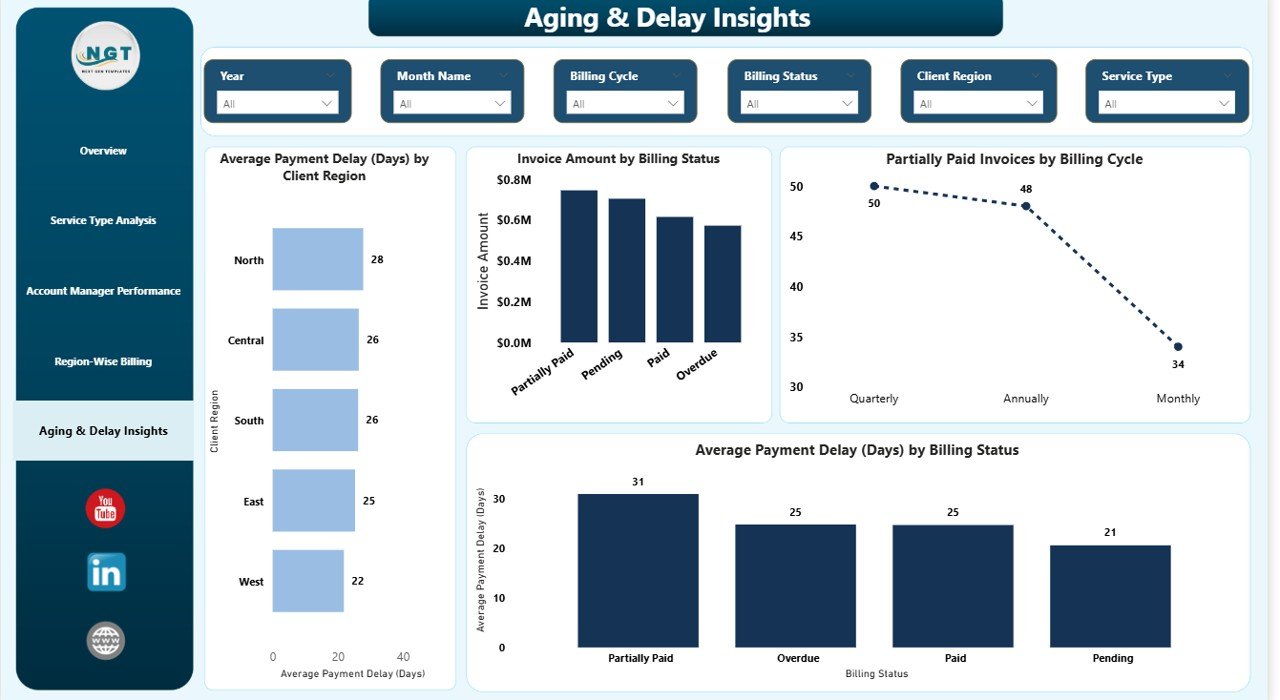
🔎 Aging & Risk Analysis
Spot high-risk invoices using billing status and aging trends to prioritize collections.
🎯 Interactive Filters & Drill-Downs
Use slicers to analyze data by billing cycle, service type, region, and manager—no technical skills required.
🔄 Easy Data Refresh
Simply update your Excel or data source and refresh Power BI to get instant insights.
📦 What’s Inside the Client Billing Dashboard in Power BI
📄 Overview Page – High-level billing health snapshot
📄 Service Type Analysis Page – Billing performance by service category
📄 Account Manager Performance Page – Manager-wise billing accountability
📄 Region-Wise Billing Page – Geographic payment behavior analysis
📄 Aging & Delay Insights Page – Invoice aging and payment risk tracking
Each page is carefully designed to answer critical billing questions and support faster decision-making.
🛠️ How to Use the Client Billing Dashboard in Power BI
1️⃣ Update invoice and payment data in your Excel or source file
2️⃣ Open the Power BI dashboard
3️⃣ Click Refresh to update all visuals
4️⃣ Use filters to analyze billing by month, region, service, or manager
5️⃣ Take action on overdue and high-risk invoices
No complex setup. No advanced Power BI skills required.
👥 Who Can Benefit from This Client Billing Dashboard in Power BI
💼 Finance Managers & CFOs
📑 Accounts Receivable Teams
🏢 Business Owners & Founders
📊 Operations & Revenue Leaders
🤝 Account & Client Managers
Even non-technical users can easily explore insights and take data-driven actions.
Click here to read the Detailed Blog Post
Watch the step-by-step video tutorial:


Reviews
There are no reviews yet.