Running a modern pharmacy is no longer just about dispensing medicines. You must manage prescriptions, track workflow stages, reduce delays, monitor staff efficiency, and ensure patients receive fast and accurate service every day. Unfortunately, many pharmacies still depend on manual reports or scattered spreadsheets. As a result, workflow bottlenecks remain hidden, delays increase, and customer satisfaction suffers.
That is exactly why the Pharmacy Workflow Bottleneck Analysis Dashboard in Power BI is a must-have analytics solution for pharmacies that want to operate smarter, faster, and more efficiently 🚀.
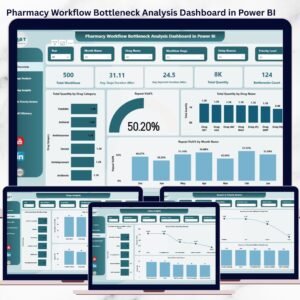
This ready-to-use Power BI dashboard helps you identify workflow delays, uncover inefficiencies, track repeat visits, and monitor staff and branch performance—all in one interactive and visual report. Instead of guessing where problems exist, you see them clearly and fix them confidently.
## 🔑 Key Feature of Pharmacy Workflow Bottleneck Analysis Dashboard in Power BI
📊 Interactive Workflow Monitoring – Instantly analyze pharmacy workflows with dynamic visuals and slicers
⏱️ Bottleneck Identification – Detect stages causing delays and excessive waiting time
🔄 Repeat Visit Tracking – Identify inefficiencies that force customers to revisit
👩⚕️ Staff Performance Insights – Measure efficiency and workload distribution
🏥 Branch-Level Comparison – Compare performance across locations and priorities
⚡ Real-Time Data Refresh – Update insights instantly as data changes
📈 Clear Visual Analytics – Replace complex spreadsheets with easy-to-read charts
## 📦 What’s Inside the Pharmacy Workflow Bottleneck Analysis Dashboard
This Power BI dashboard includes five professionally designed analytical pages, each focused on solving a specific operational challenge:
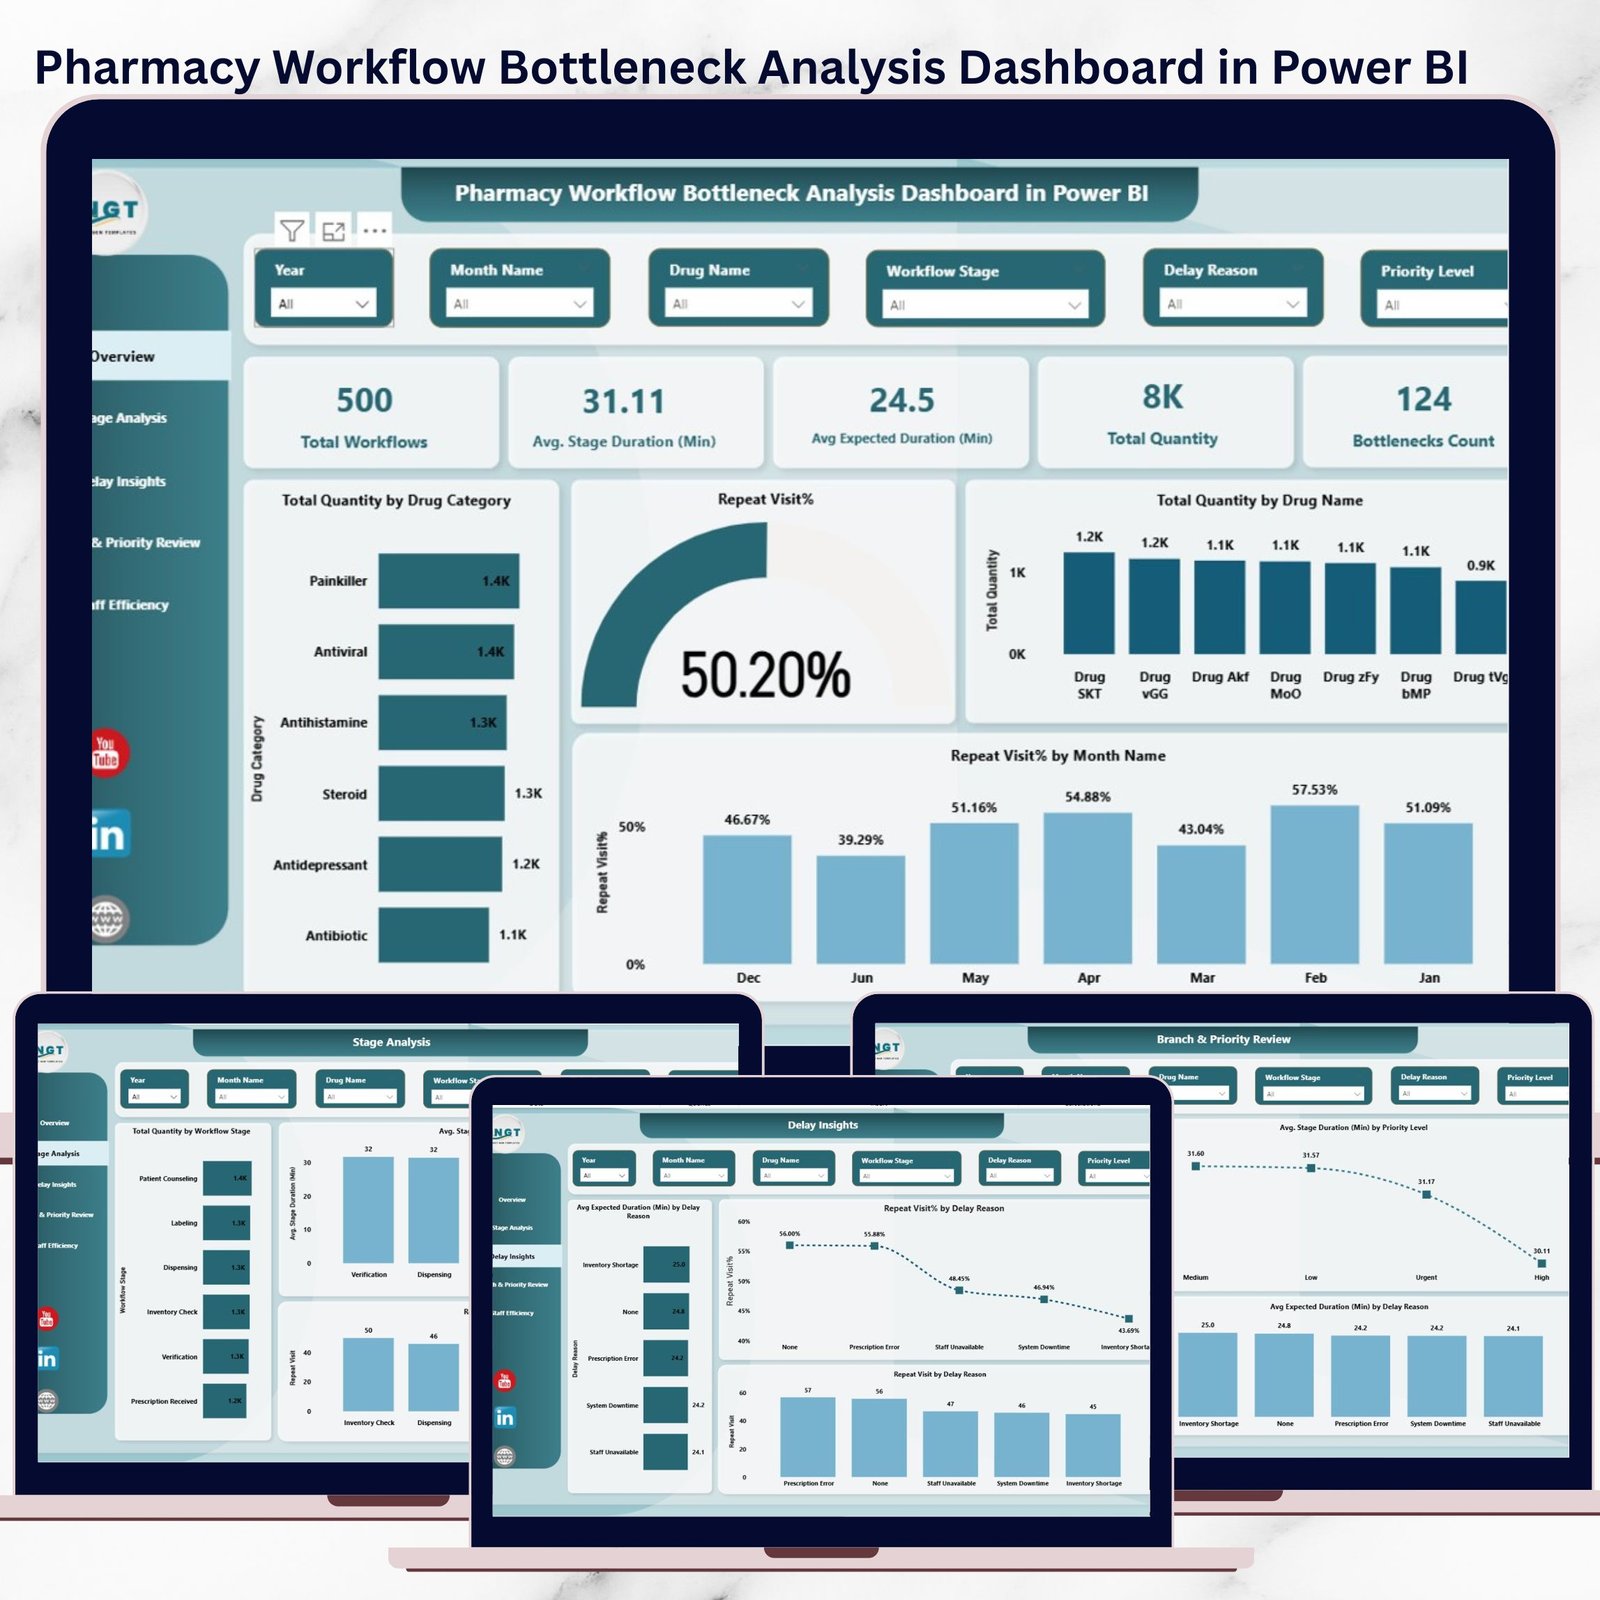
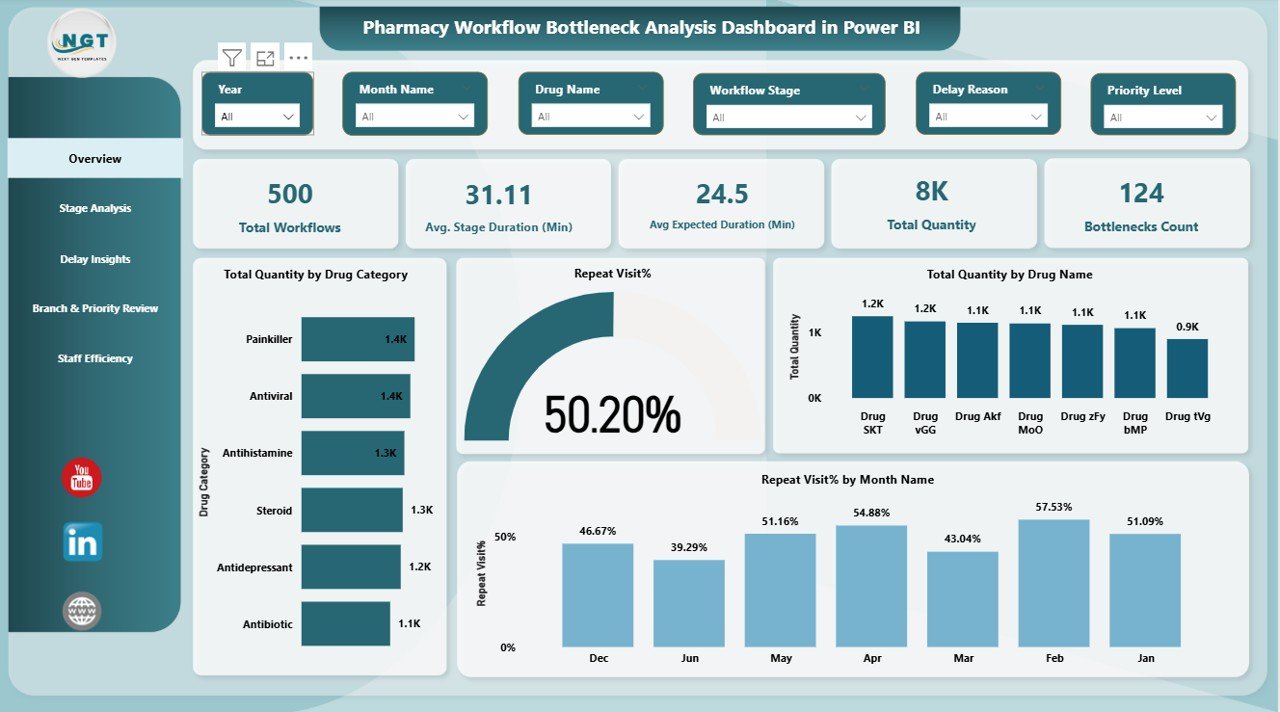
🧭 Overview Page
Get a high-level snapshot of pharmacy performance, including total workflows, average stage duration, bottleneck count, repeat visit percentage, and total quantity processed.
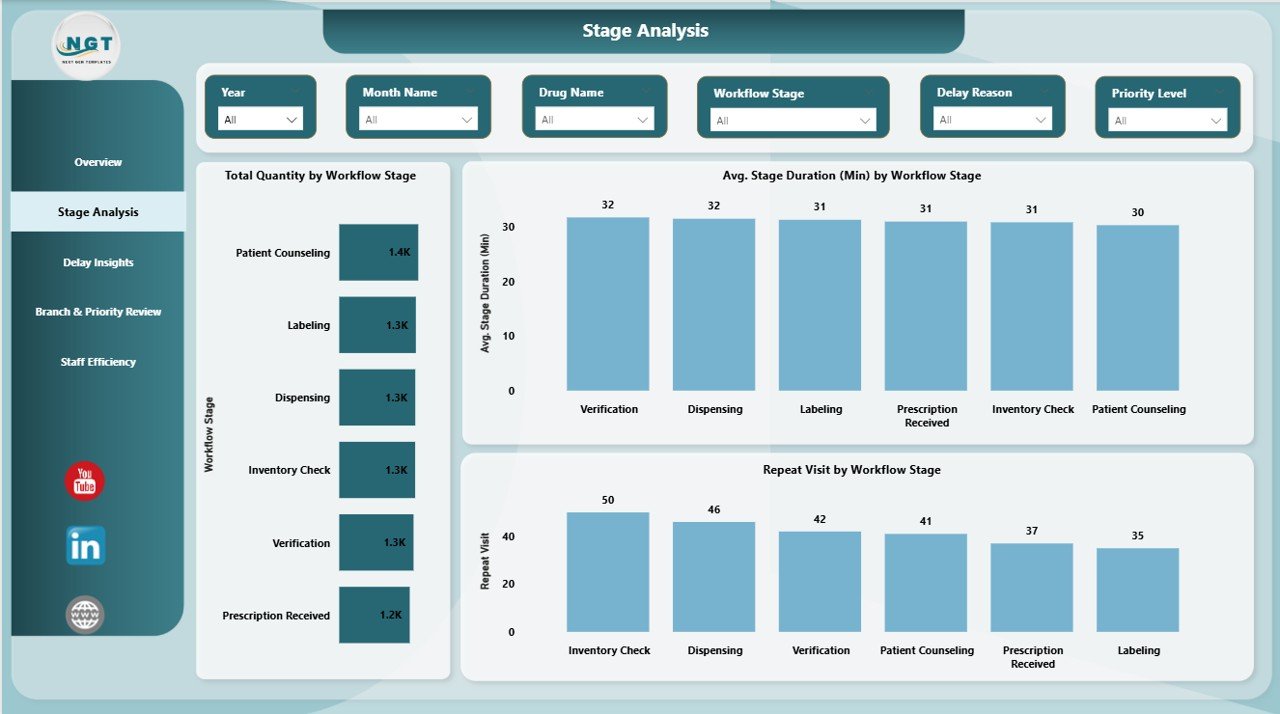
🔍 Stage Analysis Page
Identify which workflow stages—such as intake, verification, dispensing, or billing—cause the most delays.
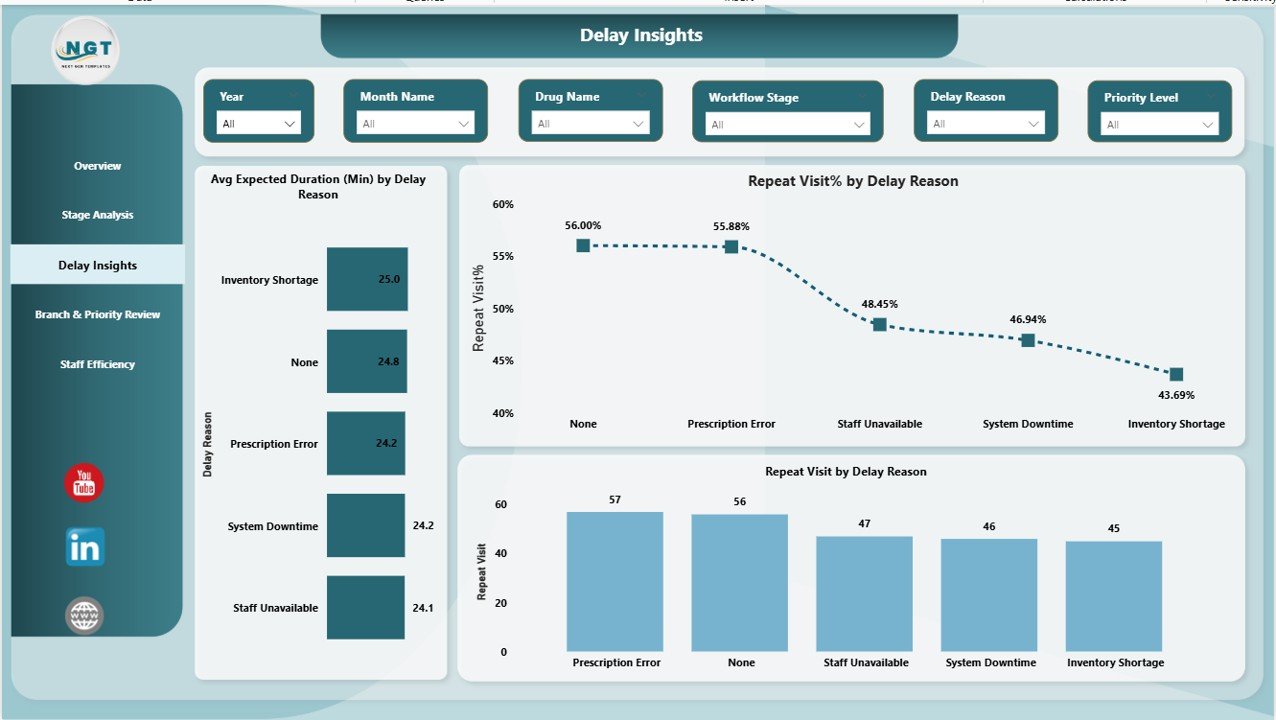
⏳ Delay Insights Page
Understand why delays occur by analyzing delay reasons, expected duration, and repeat visits linked to each reason.
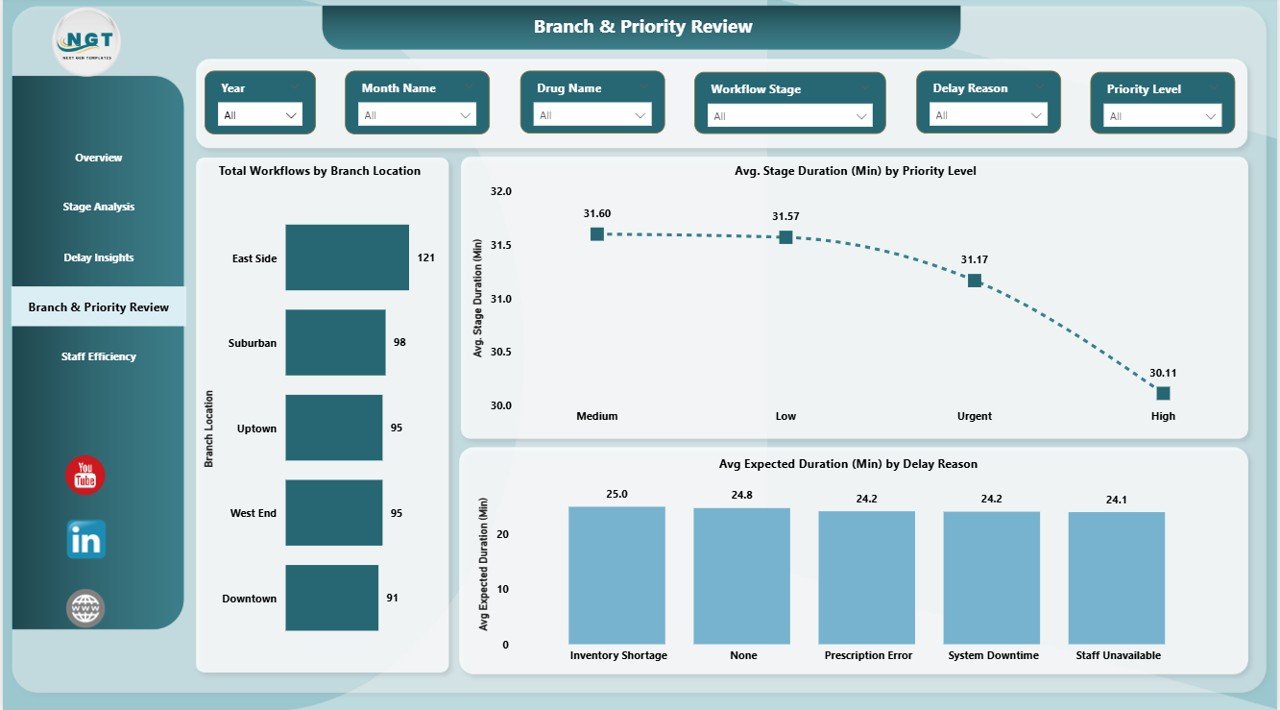
🏢 Branch & Priority Review Page
Compare workflows by branch location and urgency level to detect underperforming areas.
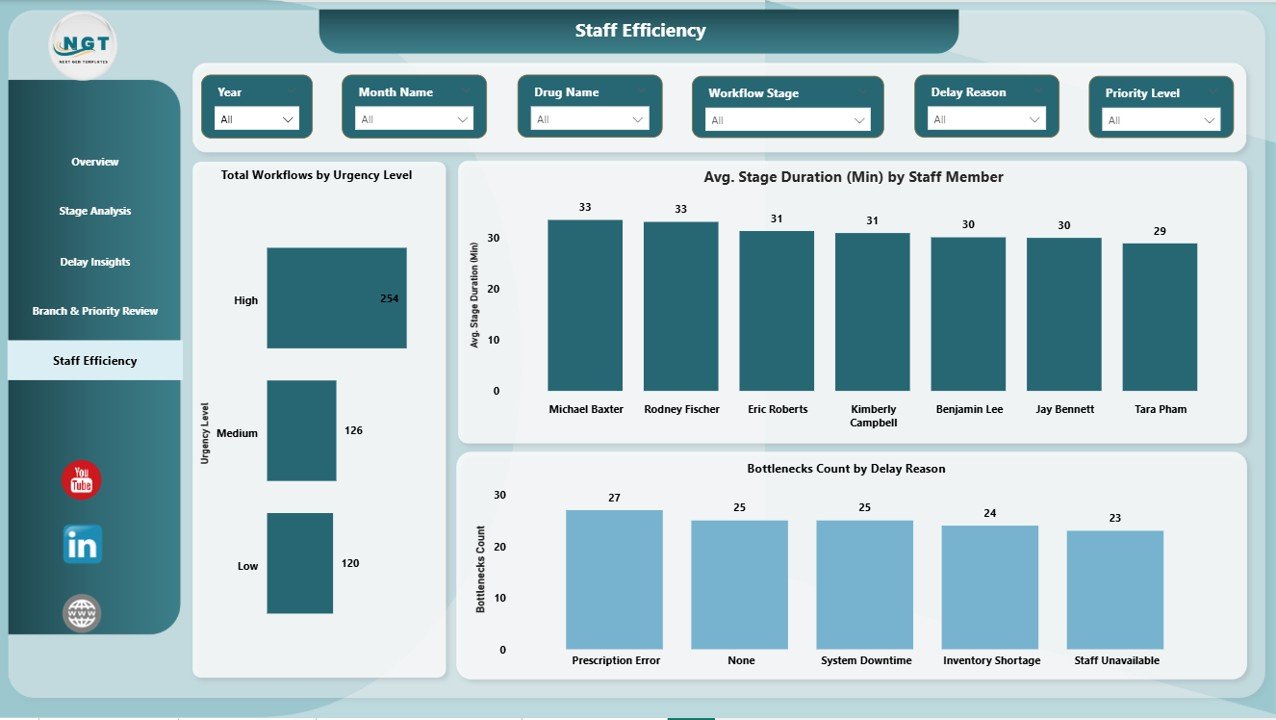
👥 Staff Efficiency Page
Evaluate staff productivity, workload balance, and bottlenecks associated with team members.
Each page includes interactive filters, making deep analysis simple and fast.
## 🛠️ How to Use the Pharmacy Workflow Bottleneck Analysis Dashboard
Using this dashboard is simple—even for non-technical users 👍
1️⃣ Load your pharmacy workflow data into Power BI
2️⃣ Refresh the dashboard to update insights
3️⃣ Use slicers to filter by branch, staff, stage, or time period
4️⃣ Identify bottlenecks, delays, and inefficiencies
5️⃣ Take corrective action and track improvements over time
No complex setup. No advanced Power BI skills required.
## 👨⚕️ Who Can Benefit from This Pharmacy Workflow Dashboard
This dashboard is ideal for:
✔️ Pharmacy Owners
✔️ Operations Managers
✔️ Store & Branch Managers
✔️ Quality & Compliance Teams
✔️ Healthcare Administrators
✔️ Pharmacy Analysts
Whether you manage a single pharmacy or multiple branches, this dashboard delivers clear and actionable insights.
By using this dashboard, pharmacies experience faster prescription turnaround, reduced patient wait time, improved staff productivity, and better service quality. Instead of reacting late, you stay proactive and in control.
Click here to read the Detailed blog post
Watch the step-by-step video tutorial:
🎥 Visit our YouTube channel to learn step-by-step video tutorials


Reviews
There are no reviews yet.