Running a small business without clear performance tracking is like driving without a dashboard. You work hard every day, yet you still wonder whether sales are improving, costs are under control, or targets are being met. That is exactly why the Small Business KPI Scorecard in Excel becomes a must-have performance management tool for modern small businesses.
This ready-to-use Excel scorecard helps you track, analyze, and monitor key business KPIs in one centralized place. Instead of managing multiple Excel files and manual reports, you get a structured, visual, and easy-to-understand scorecard that shows exactly where your business stands. Moreover, the template works perfectly for owners, managers, and analysts who want clarity without complexity.
Because it is built in Excel, you do not need expensive BI tools or advanced technical skills. You simply update data and instantly see results.
## 🚀 Key Features of Small Business KPI Scorecard in Excel
✅ Track up to 10 KPIs in one clean view, helping you focus only on what truly matters
✅ MTD (Month-to-Date) and YTD (Year-to-Date) analysis, so performance remains visible at all times
✅ Actual vs Target and Actual vs Previous Year comparisons, enabling quick gap identification
✅ Dynamic dropdown selections for month and performance type
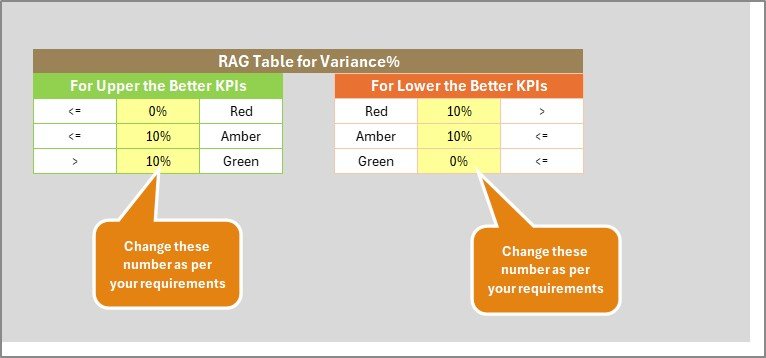
✅ Visual indicators and conditional formatting, making performance status easy to understand
✅ No advanced Excel knowledge required, fully beginner-friendly
✅ Flexible structure, allowing easy KPI customization
Because of these features, this scorecard becomes a powerful decision-making companion for small business owners.
## 📦 What’s Inside the Small Business KPI Scorecard in Excel
This digital product includes four professionally designed worksheets, each with a clear purpose:
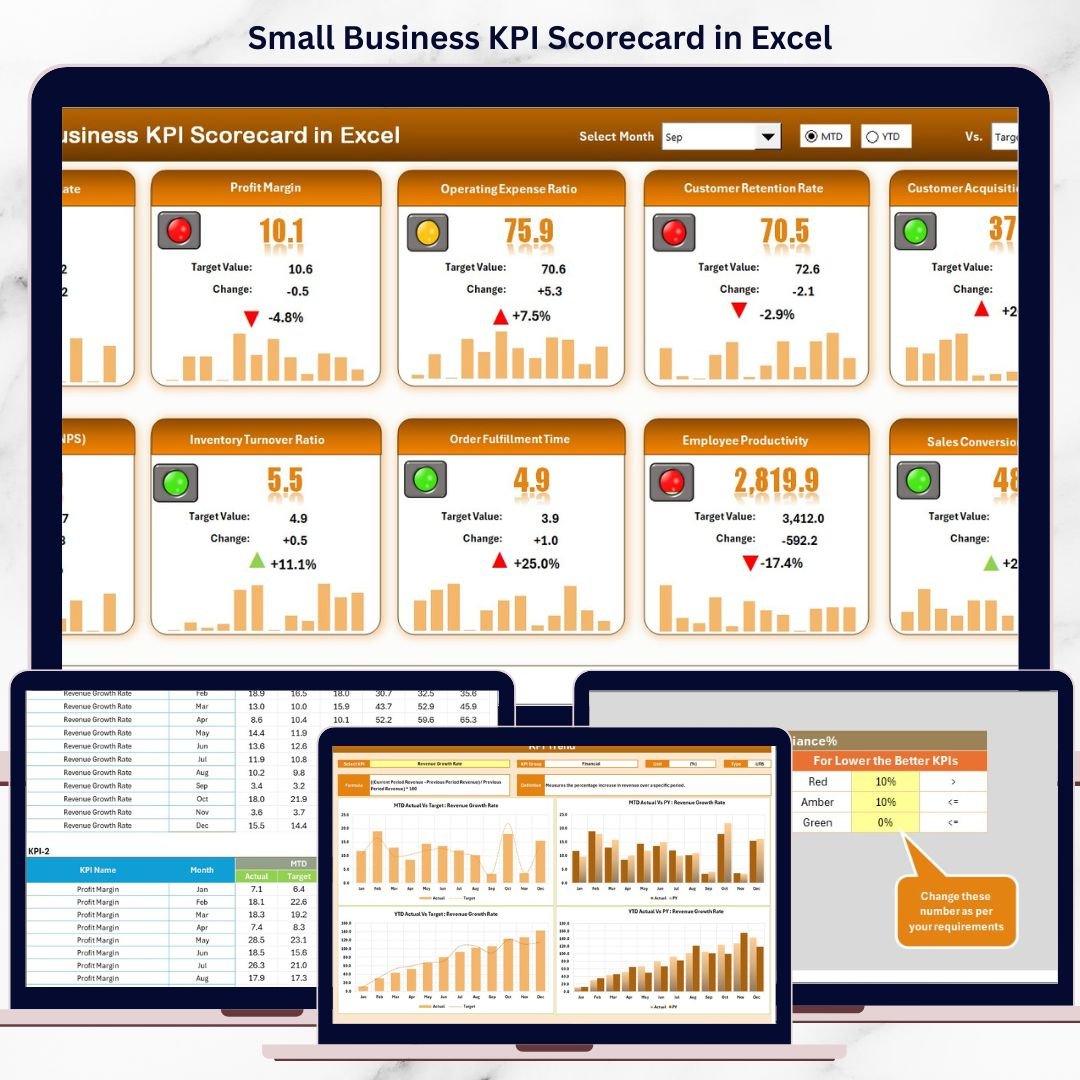
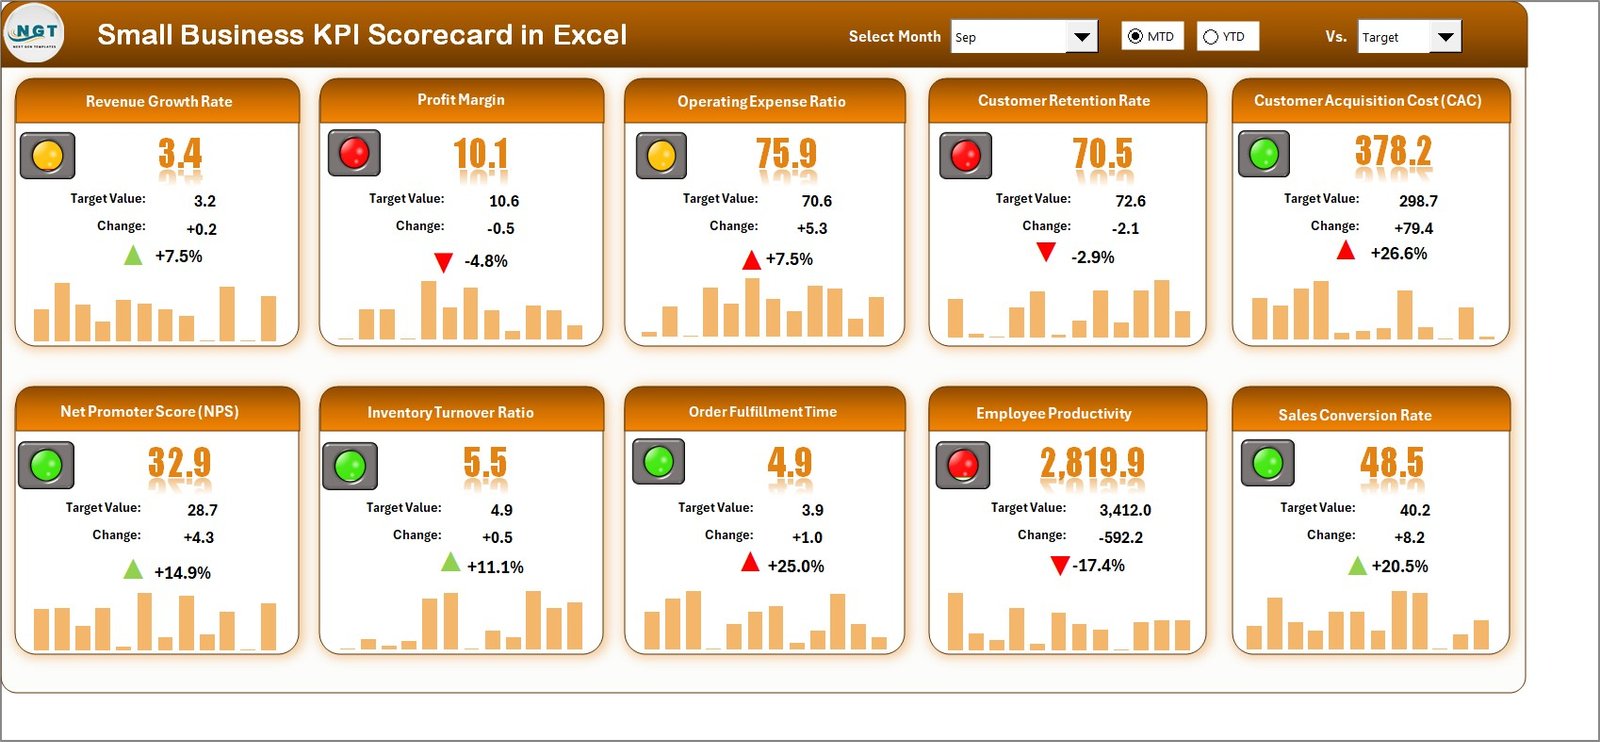
📊 Scorecard Sheet
The main dashboard where all KPIs appear in one view. You can select the month and switch between MTD and YTD. As a result, all KPI numbers update instantly with visual indicators.
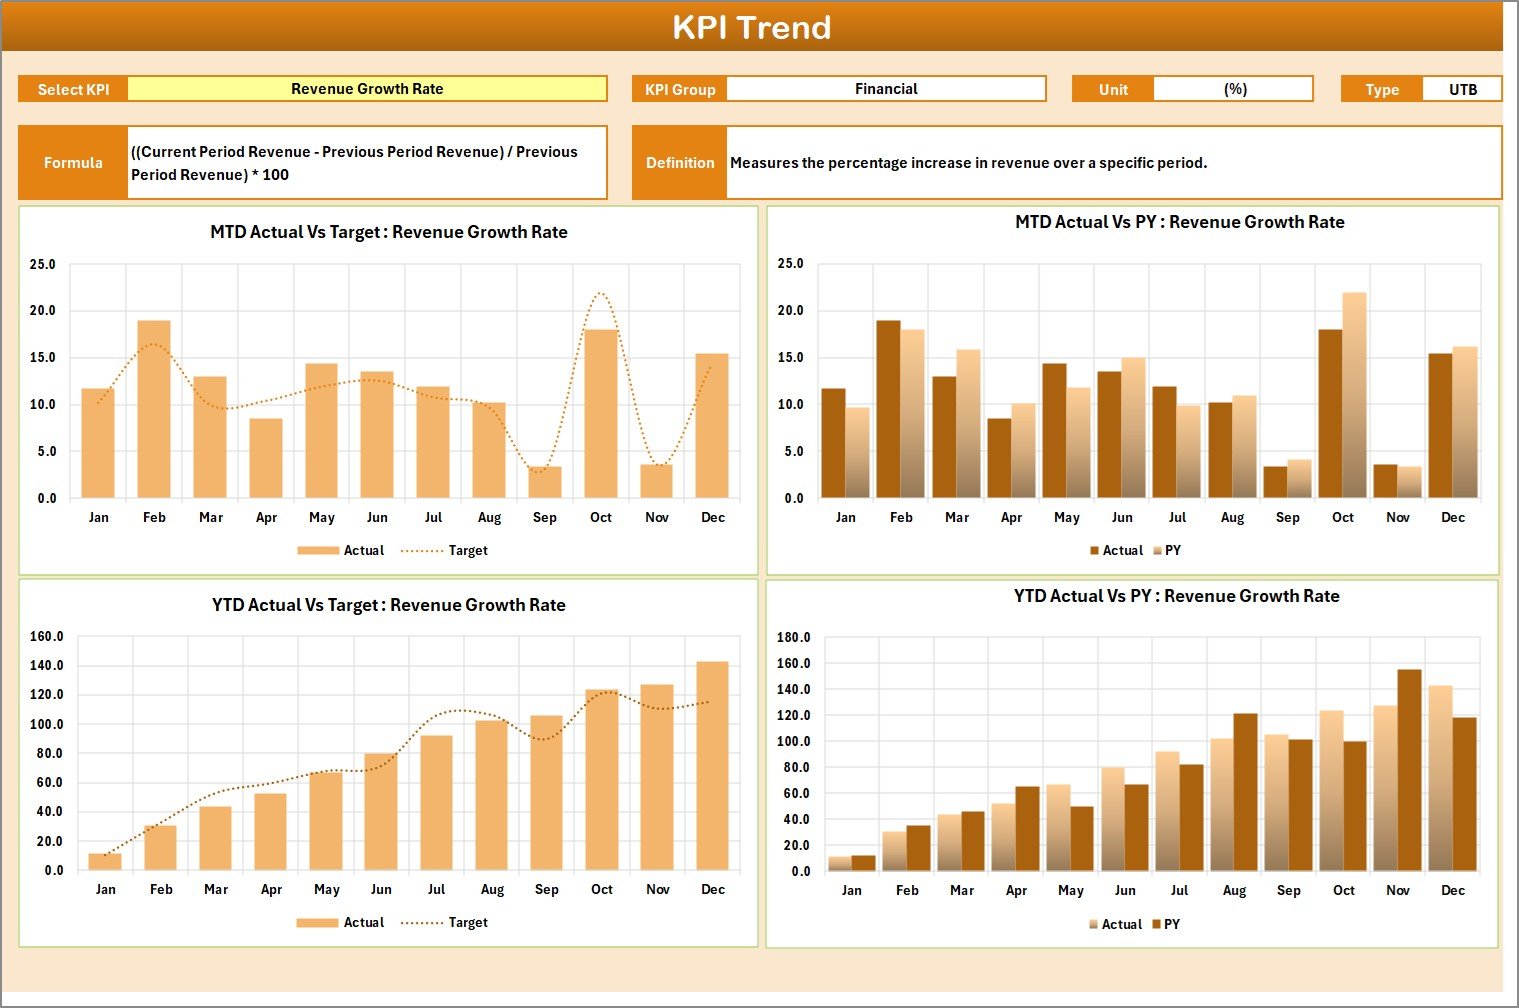
📈 KPI Trend Sheet
This sheet allows you to select a KPI from a dropdown and analyze trends over time. It displays KPI group, unit, KPI type (Lower the Better or Upper the Better), formula, definition, and trend charts for Actual, Target, and Previous Year values.
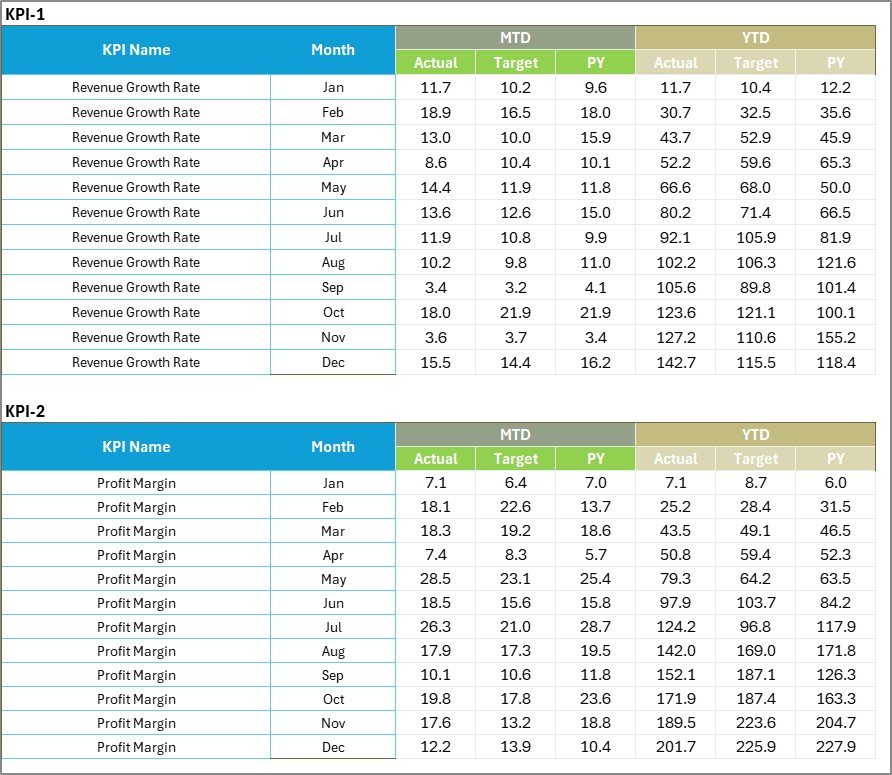
🧾 Input Data Sheet
This is where you enter actual values, targets, and historical data. The entire scorecard depends on this sheet, making updates fast and simple.
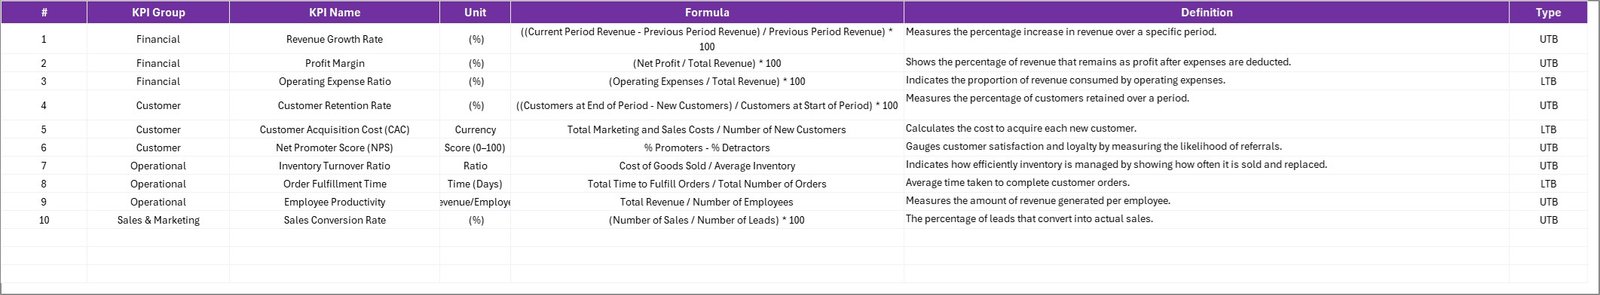
📘 KPI Definition Sheet
This sheet provides clarity by documenting KPI name, group, unit, formula, and definition. It ensures consistent understanding across teams.
## 🛠️ How to Use the Small Business KPI Scorecard in Excel
Using this KPI scorecard is straightforward and user-friendly:
1️⃣ Enter actual and target values in the Input Data Sheet
2️⃣ Select the month and MTD or YTD option in the Scorecard Sheet
3️⃣ Instantly review performance using visual indicators
4️⃣ Analyze trends using the KPI Trend Sheet
5️⃣ Update data regularly to keep insights accurate
Because everything runs on formulas, Excel handles calculations automatically.
## 👥 Who Can Benefit from This Small Business KPI Scorecard in Excel
This product is ideal for:
👤 Small business owners
📊 Business analysts
🏪 Retail and service businesses
📈 Startups and entrepreneurs
💼 Managers and team leaders
📋 Consultants supporting small businesses
If you want better visibility, faster decisions, and structured performance tracking, this KPI scorecard is made for you.
Click here to read the detailed blog post
Watch the step-by-step video tutorial:


Reviews
There are no reviews yet.