Smart cities manage dozens—sometimes hundreds—of projects at the same time. Infrastructure upgrades, digital transformation initiatives, sustainability programs, mobility solutions, and public service improvements all move in parallel. However, when project data remains scattered across spreadsheets, emails, and static reports, visibility disappears, risks grow, and decision-making slows down.
That is exactly why the Smart Cities Project Management Dashboard in Power BI becomes an essential solution. 🚀
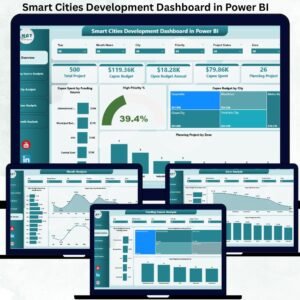
This professionally designed Power BI dashboard transforms complex smart city project data into clear KPIs, interactive visuals, and actionable insights. As a result, city planners, project managers, and government leaders gain complete control over budgets, costs, progress, delays, and performance—across departments, cities, and project types.
Built for modern urban governance, this dashboard enables clarity, accountability, and confident decision-making.
Key Features of Smart Cities Project Management Dashboard in Power BI 🔑
📊 Centralized Project Visibility
Track all smart city projects in one interactive Power BI dashboard.
📈 Planned Budget vs Actual Cost Analysis
Monitor cost variance in real time to prevent overruns early.
🏙️ City-Wise & Department-Wise Performance Tracking
Compare project execution across cities and departments effortlessly.
⏱️ Progress & Delay Monitoring
Identify in-progress and delayed projects before issues escalate.
🧭 Interactive Slicers & Filters
Analyze data by city, department, project manager, project type, or time period.
📅 Monthly Trend Analysis
Understand how budgets, costs, and variance evolve over time.
⚡ Faster, Data-Driven Decisions
Replace manual reporting with instant visual insights.
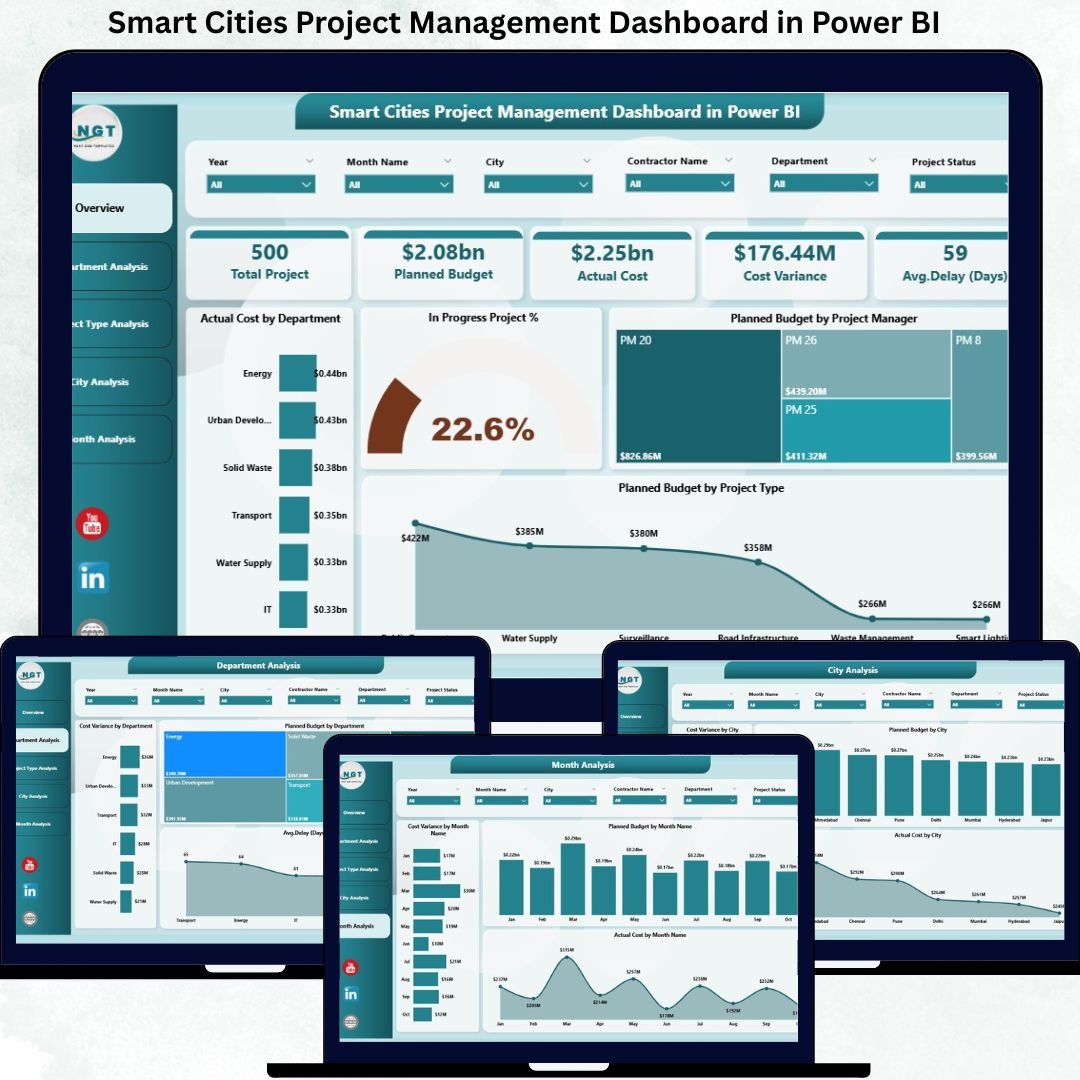
What’s Inside the Smart Cities Project Management Dashboard in Power BI 📁
This ready-to-use Power BI solution includes five structured analytical pages, each designed to answer a specific project-management question.
📄 Overview Page
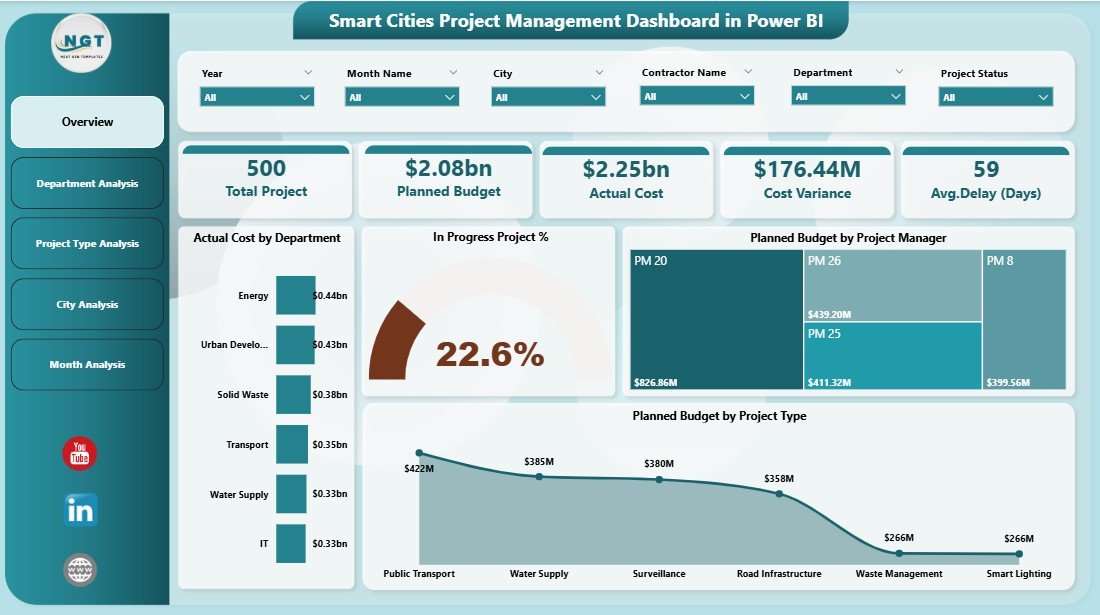
The executive command center that delivers an instant snapshot of overall project health.
Includes:
-
KPI Cards: Actual Cost, Planned Budget, In-Progress Project %, Cost Variance
-
Actual Cost by Department
-
In-Progress Project %
-
Planned Budget by Project Manager
-
Planned Budget by Project Type
This page allows leadership to spot budget concentration, workload imbalance, and risk areas within seconds.
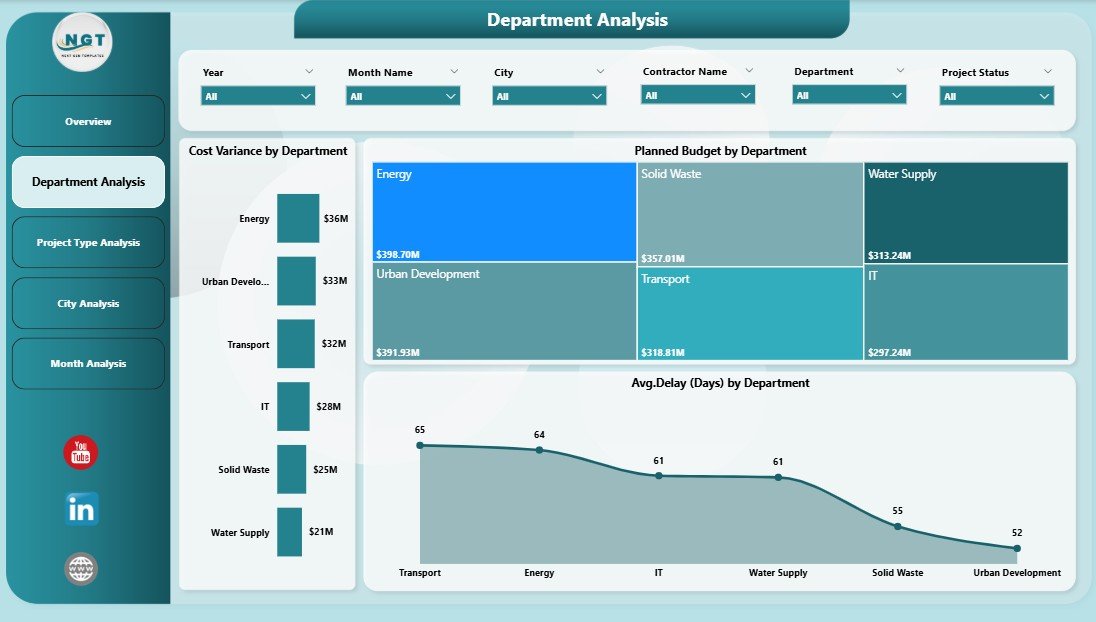
📄 Department Analysis Page
Focuses on how individual departments perform against budgets and timelines.
Includes:
-
Cost Variance by Department
-
Planned Budget by Department
-
Average Delay by Department
Helps identify departments that consistently exceed budgets or face delays.
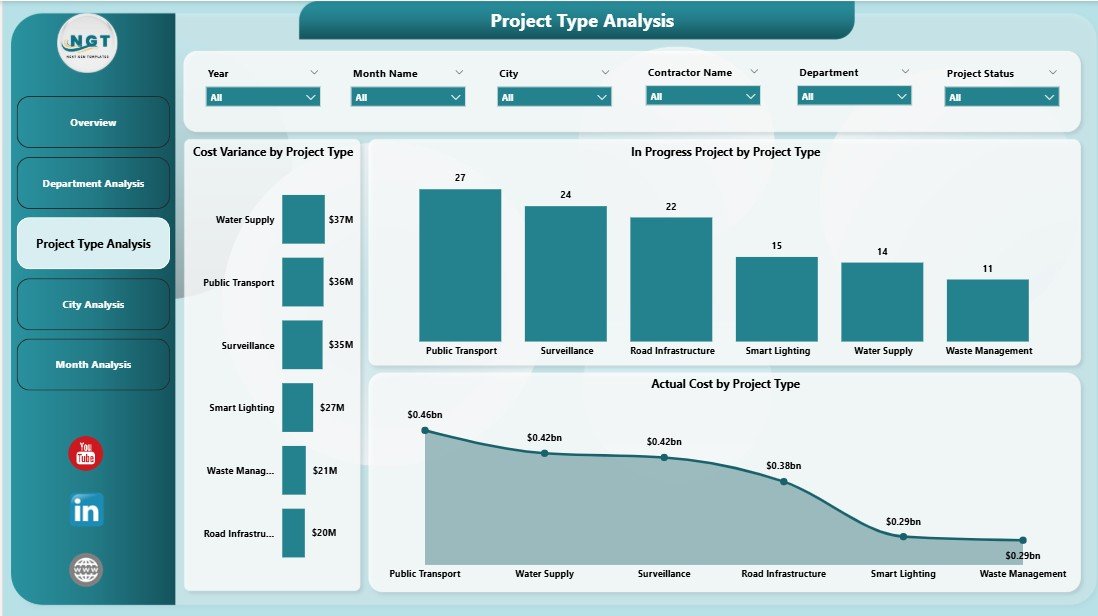
📄 Project Type Analysis Page
Analyzes performance by project category such as infrastructure, IT, sustainability, or transport.
Includes:
-
Cost Variance by Project Type
-
In-Progress Projects by Project Type
-
Actual Cost by Project Type
Supports smarter planning and prioritization of future smart city initiatives.
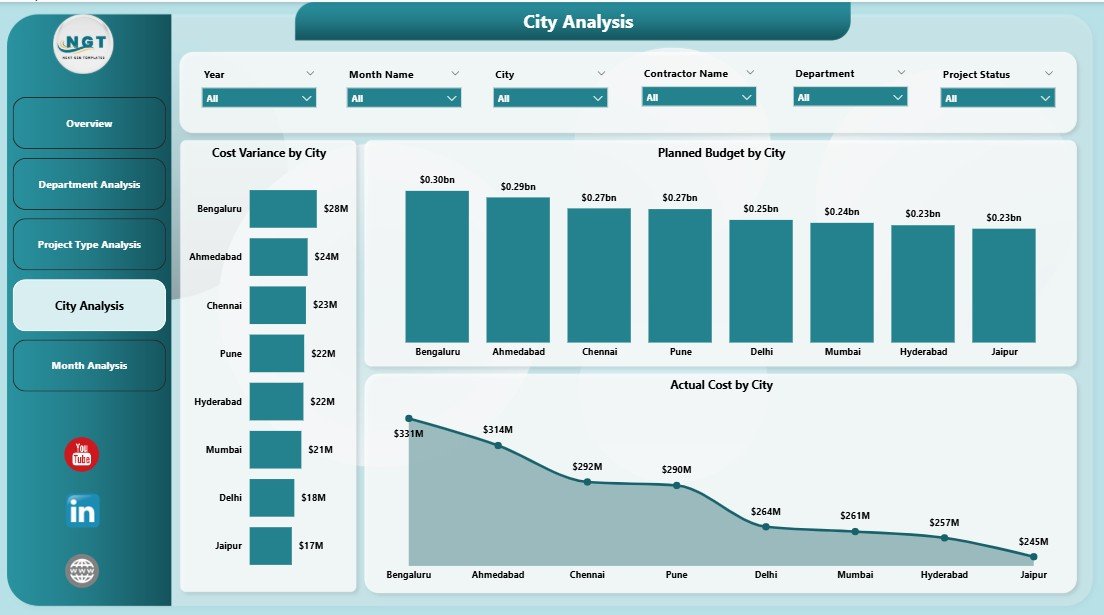
📄 City Analysis Page
Provides city-level insights for multi-city smart programs.
Includes:
-
Cost Variance by City
-
Planned Budget by City
-
Actual Cost by City
Enables benchmarking between cities and supports better regional planning.
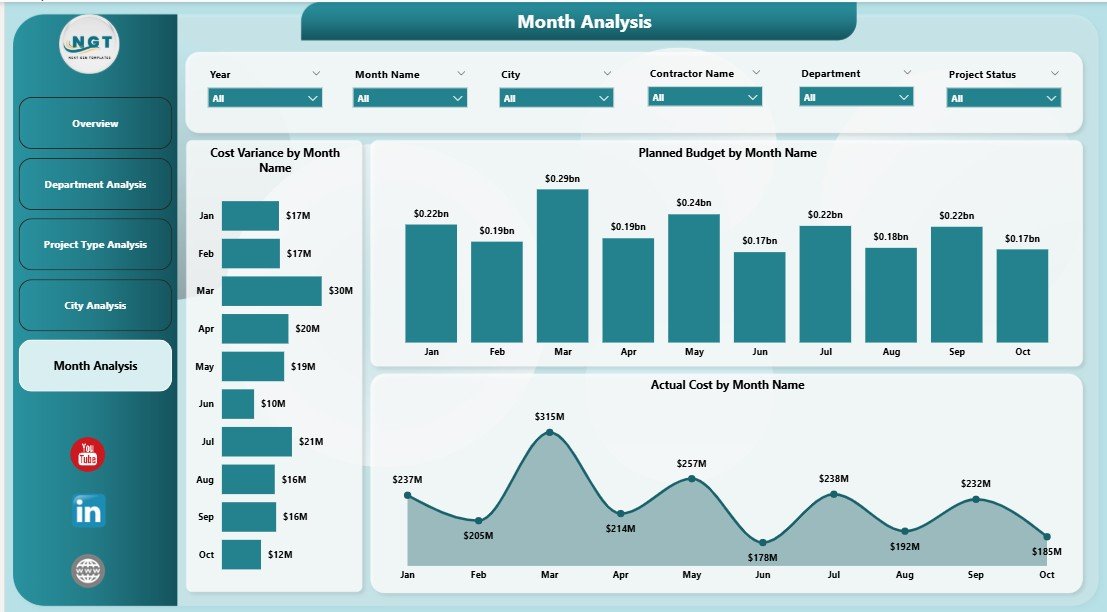
📄 Monthly Trends Page
Tracks how project performance changes over time.
Includes:
-
Cost Variance by Month
-
Planned Budget by Month
-
Actual Cost by Month
Helps forecast future risks, budget requirements, and seasonal spending patterns.
How to Use the Smart Cities Project Management Dashboard in Power BI 🛠️
1️⃣ Connect project data from Excel, ERP systems, or project tools
2️⃣ Refresh the Power BI dashboard
3️⃣ Use slicers to filter by city, department, project type, or manager
4️⃣ Review KPIs, variance, and delays instantly
5️⃣ Use insights for reviews, planning, and governance
No advanced technical expertise is required. The dashboard is intuitive and user-friendly.
Who Can Benefit from This Smart Cities Project Dashboard 👥
🏙️ Smart City Authorities & Municipal Leaders – Monitor citywide projects
🏛️ Urban Planners & PMOs – Track multi-department initiatives
📊 Project Managers – Control cost and progress
💰 Finance & Budget Teams – Improve budget oversight
👔 Government Decision-Makers – Enable transparent governance
Ideal for both small smart city programs and large, multi-city deployments.


Reviews
There are no reviews yet.