A/B Testing KPI Dashboard is the backbone of modern digital optimization. From website conversions and app experiences to pricing experiments and marketing campaigns, businesses rely on testing to decide what truly works. However, running experiments alone is not enough. Without clear, consistent, and comparable performance tracking, even the best experiments fail to deliver long-term value. That is exactly why the A/B Testing KPI Dashboard in Power BI becomes a must-have analytics solution for data-driven teams.
This ready-to-use Power BI dashboard transforms scattered experiment results into a centralized, structured, and decision-ready performance system. Instead of managing multiple Excel sheets, static reports, or disconnected tools, teams can track all A/B testing KPIs in one interactive dashboard. As a result, marketers, product teams, and growth leaders gain instant clarity on which tests succeed, which miss targets, and how performance evolves month-to-date (MTD) and year-to-date (YTD).
Because this dashboard uses Excel as the data source and Power BI for visualization, it balances simplicity with analytical power. You update numbers in Excel, refresh the Power BI file, and immediately see updated KPIs, trend charts, and performance indicators. Therefore, teams spend less time compiling reports and more time optimizing experiments.
🔑 Key Features of A/B Testing KPI Dashboard in Power BI
📊 Centralized Experiment KPI Tracking – Monitor all A/B testing KPIs in one structured dashboard
🎯 MTD & YTD Performance Analysis – Track short-term momentum and long-term impact
📈 Target vs Actual Comparisons – Instantly see which KPIs meet or miss targets
🔺 Visual Status Indicators – Green ▲ and red ▼ icons highlight success or risk
📉 Historical Comparison (CY vs PY) – Compare current performance with previous year
🧠 Drill-Through KPI Definitions – Ensure clarity and consistency across teams
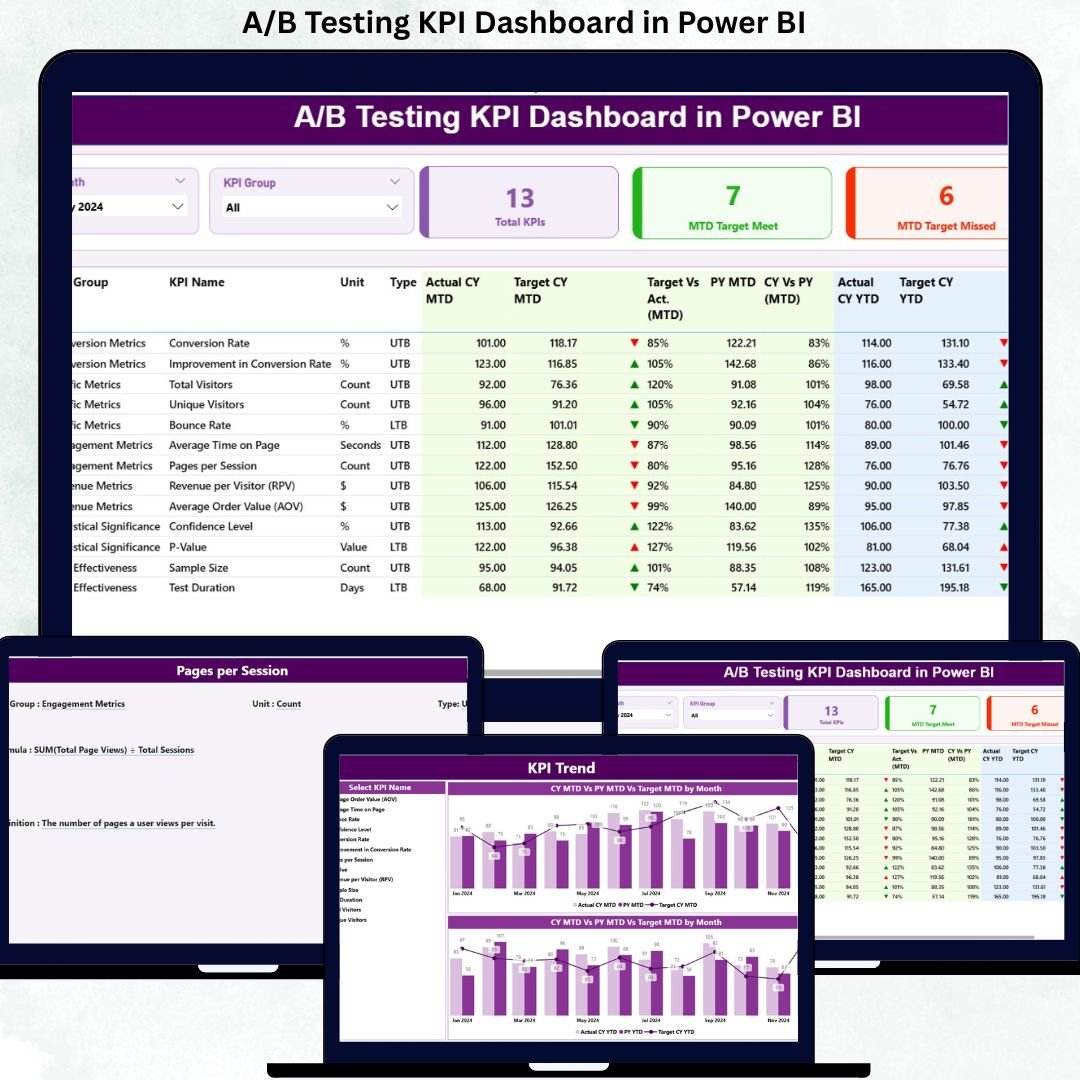
📂 What’s Inside the A/B Testing KPI Dashboard in Power BI
This dashboard includes three professionally designed Power BI pages, supported by a structured Excel data model:
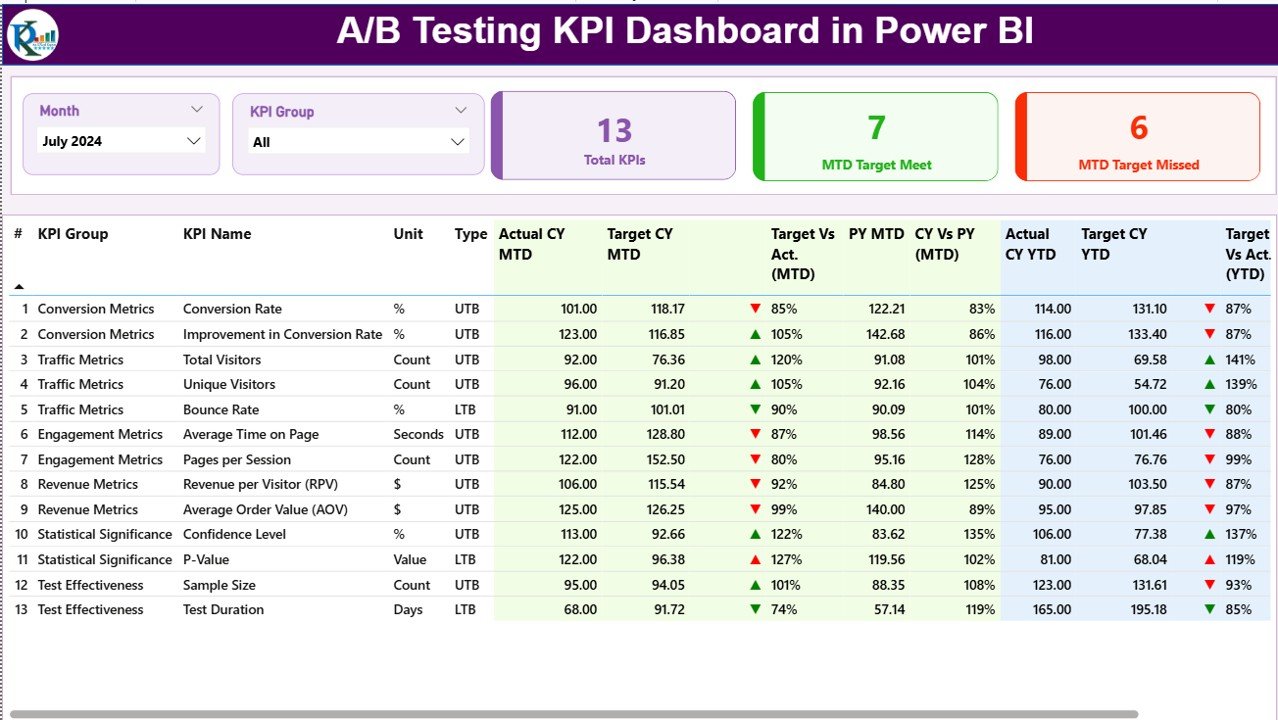
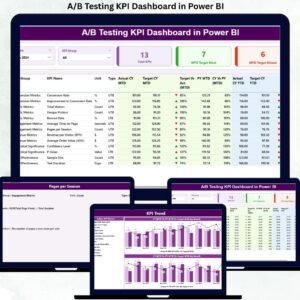
📌 Summary Page – The command center of the dashboard
-
Month slicer and KPI Group slicer
-
KPI cards: Total KPIs Count, MTD Target Met, MTD Target Missed
-
Detailed KPI table with:
-
Actual vs Target (MTD & YTD)
-
Status icons
-
CY vs PY comparisons
-
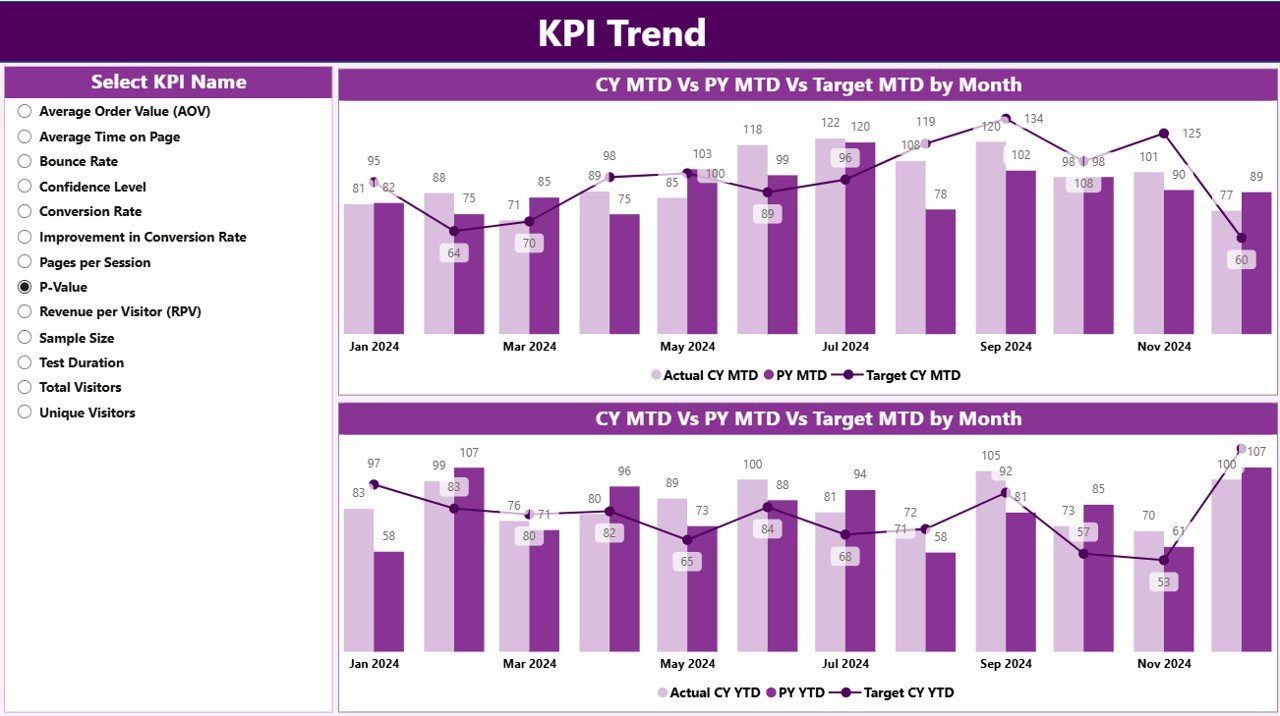
📈 KPI Trend Page – Performance over time
-
KPI Name slicer
-
MTD Trend combo chart (Actual CY, PY, Target)
-
YTD Trend combo chart (Actual CY, PY, Target)
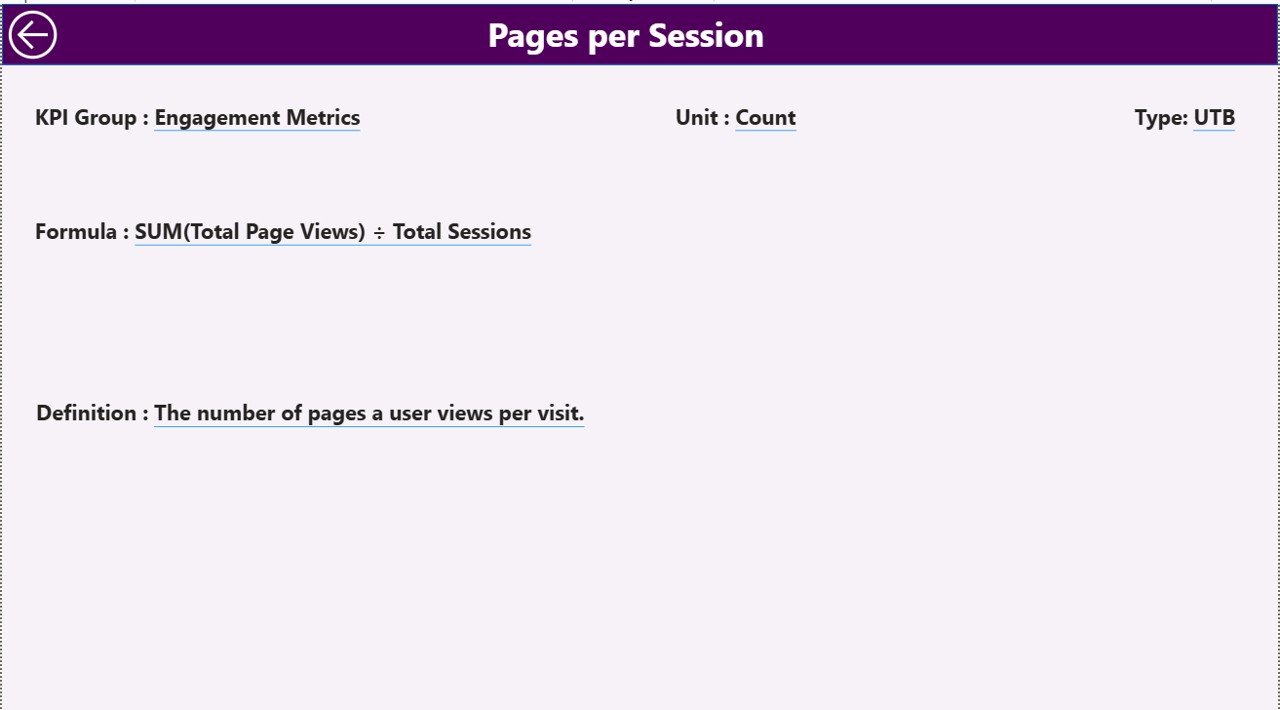
📘 KPI Definition Page (Drill-Through)
-
KPI Number, Group, Name
-
Unit, Formula, Definition
-
KPI Type (UTB / LTB)
-
Back button for smooth navigation
📄 Excel Data Source (3 Sheets)
-
Input_Actual – Actual MTD & YTD values
-
Input_Target – Target MTD & YTD values
-
KPI Definition – KPI metadata and logic
▶️ How to Use the A/B Testing KPI Dashboard in Power BI
1️⃣ Enter actual KPI values in the Input_Actual Excel sheet
2️⃣ Enter target KPI values in the Input_Target Excel sheet
3️⃣ Define KPI logic in the KPI Definition sheet
4️⃣ Refresh the Power BI dashboard
5️⃣ Use slicers, tables, and trend charts to analyze performance
No advanced Power BI skills are required for day-to-day use.
👥 Who Can Benefit from This A/B Testing KPI Dashboard in Power BI
This dashboard is ideal for:
🚀 Growth & CRO Teams
📊 Digital Marketing Teams
🧪 Product & Experimentation Teams
🛒 E-commerce & SaaS Businesses
📈 Data & Business Analysts
🎯 Leadership & Strategy Teams
Anyone running experiments can benefit from this dashboard.
### 👉 Click here to read the Detailed Blog Post
Visit our YouTube channel to learn step-by-step video tutorials.


Reviews
There are no reviews yet.