The media and entertainment industry runs on speed, creativity, and data. Every single day, studios, OTT platforms, broadcasters, and digital creators track revenue, production costs, marketing spend, ratings, views, platforms, and regional performance. However, when this information is scattered across multiple Excel files and reports, decision-making becomes slow and unreliable.
That is exactly where the Media and Entertainment Dashboard in Excel delivers powerful value 🎯.
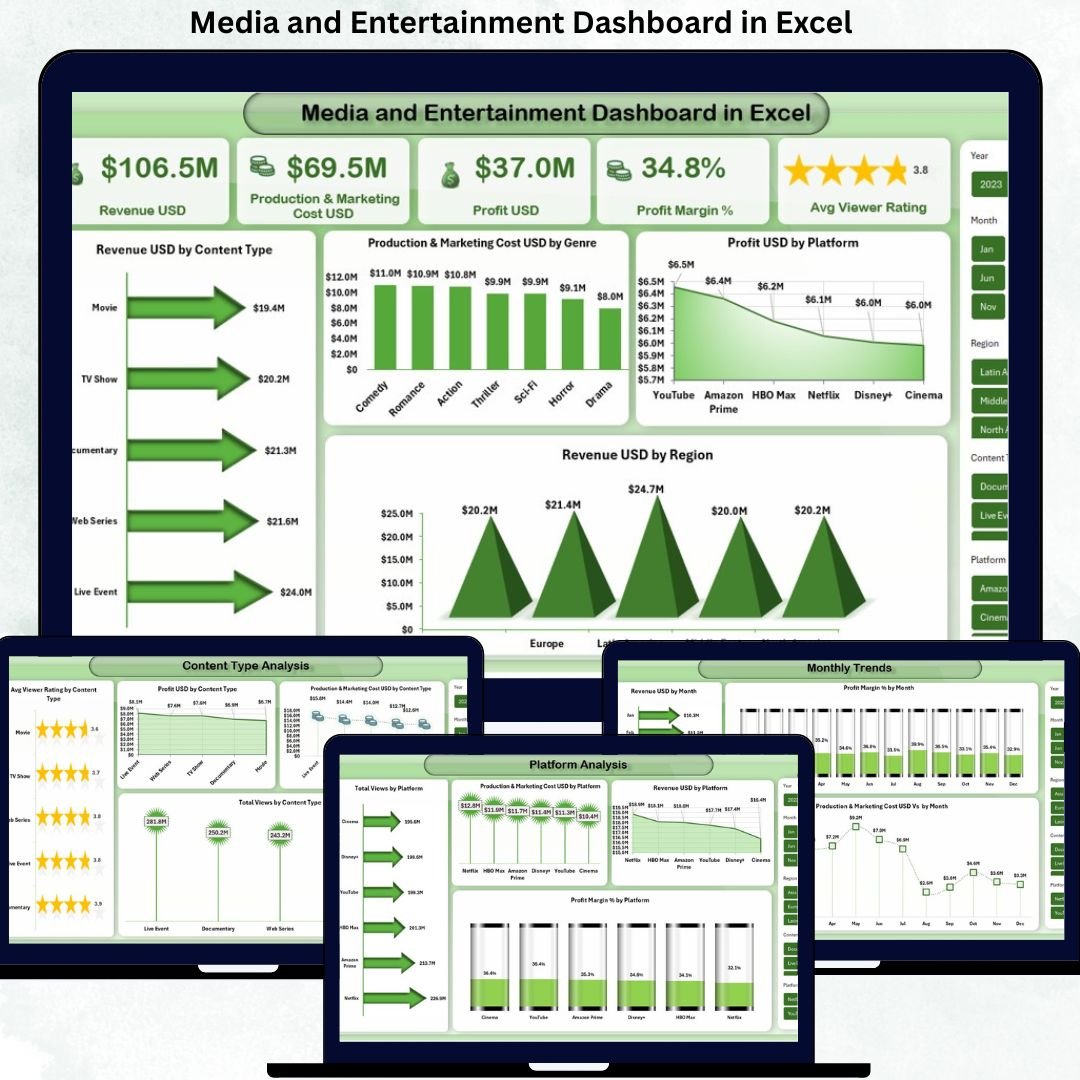
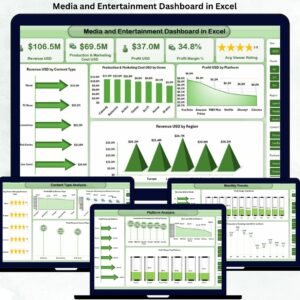
This ready-to-use Excel dashboard transforms raw media data into a clear, visual, and decision-ready performance system. Instead of spending hours building reports, this dashboard allows you to instantly track profitability, audience engagement, platform performance, and monthly trends—all in one professional Excel file.
## 🚀 Key Features of Media and Entertainment Dashboard in Excel
✨ Centralized KPI Tracking – Monitor revenue, costs, profits, profit margin, and viewer ratings from a single dashboard
📊 Multi-Dimensional Analysis – Analyze performance by content type, platform, region, and month
📈 Interactive Charts & KPIs – Instantly spot trends, risks, and opportunities
🧠 Decision-Focused Design – Built for fast insights, not just reporting
🧩 Excel-Based & Flexible – No complex tools or software required
⚡ Time-Saving & Efficient – Eliminate manual reporting and repetitive analysis
Because everything is visual and structured, leadership teams can make confident decisions without digging into raw data.
## 📂 What’s Inside the Media and Entertainment Dashboard in Excel
This dashboard includes five powerful analytical sheet tabs, each designed for a specific business purpose:
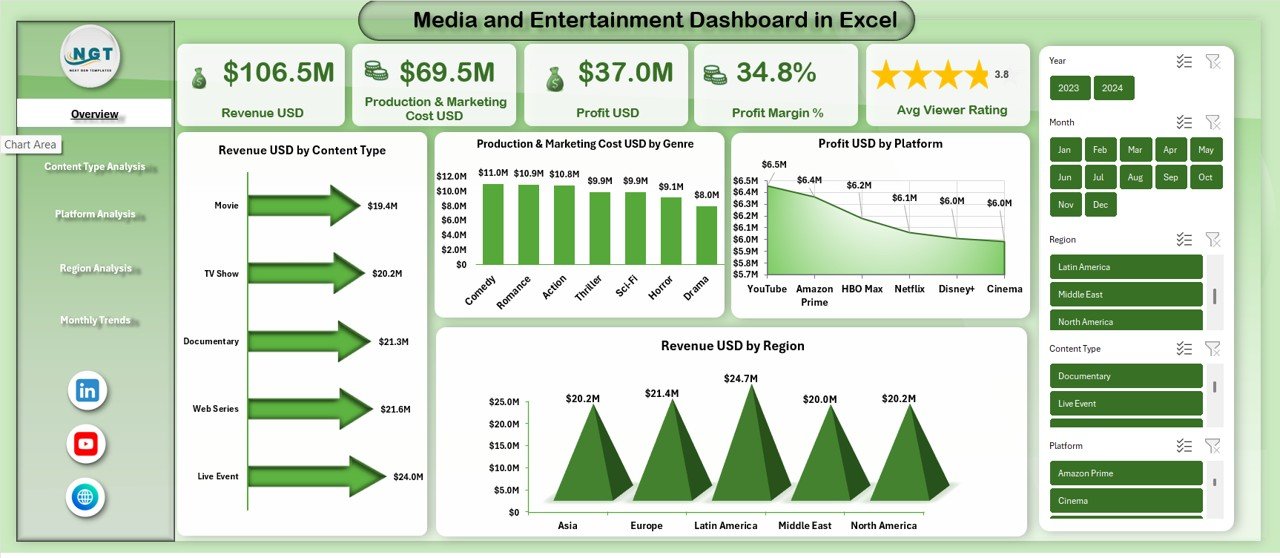
🎯 Overview Sheet
-
Revenue USD
-
Production & Marketing Cost USD
-
Profit USD
-
Profit Margin %
-
Average Viewer Rating
-
Revenue by Content Type
-
Cost by Genre
-
Profit by Platform
-
Revenue by Region
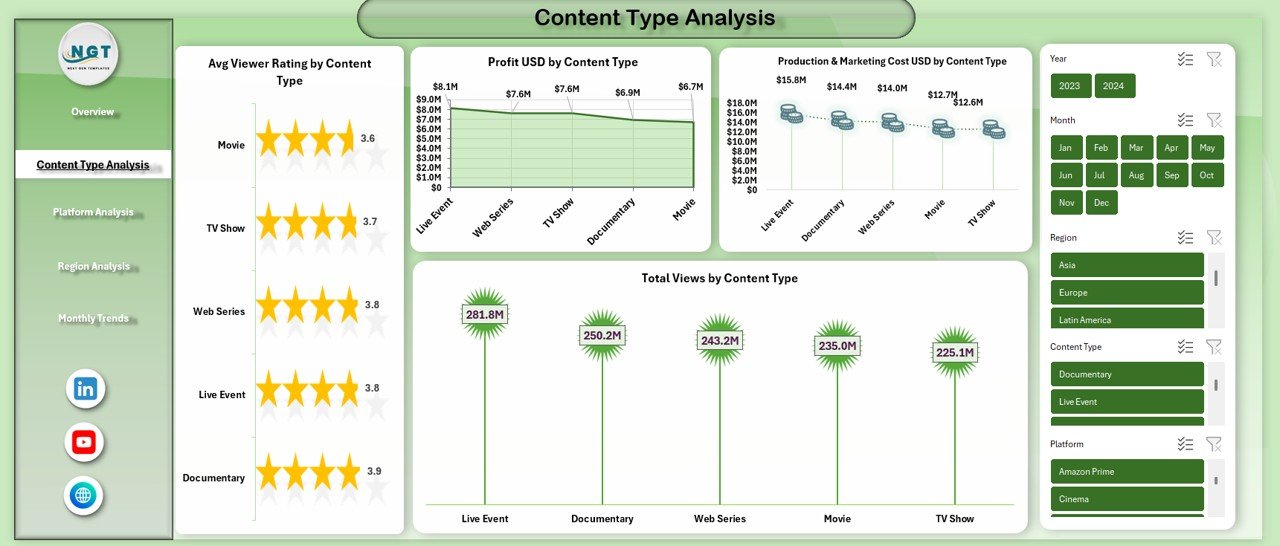
🎬 Content Type Analysis
-
Average Viewer Rating by Content Type
-
Profit USD by Content Type
-
Production & Marketing Cost by Content Type
-
Total Views by Content Type
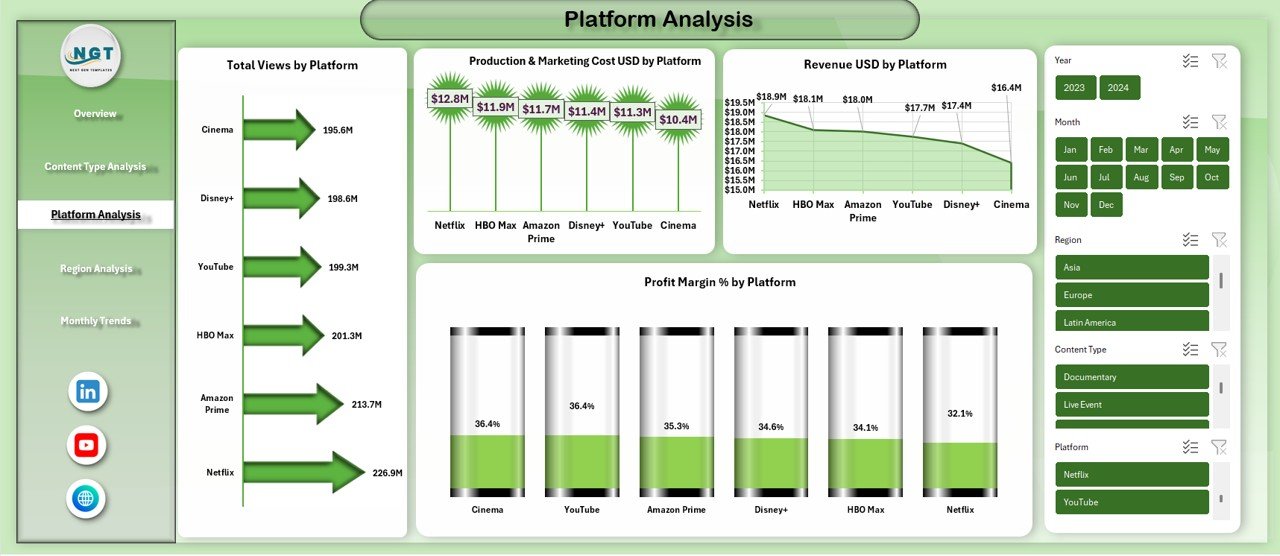
📺 Platform Analysis
-
Total Views by Platform
-
Revenue USD by Platform
-
Production & Marketing Cost by Platform
-
Profit Margin % by Platform
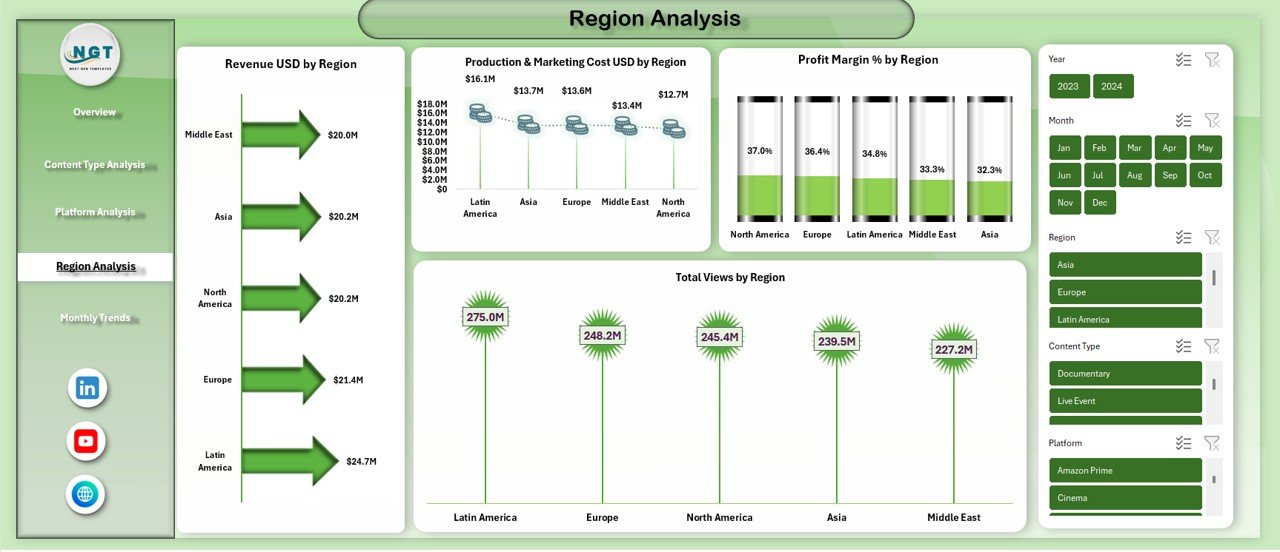
🌍 Region Analysis
-
Revenue USD by Region
-
Cost USD by Region
-
Profit Margin % by Region
-
Total Views by Region
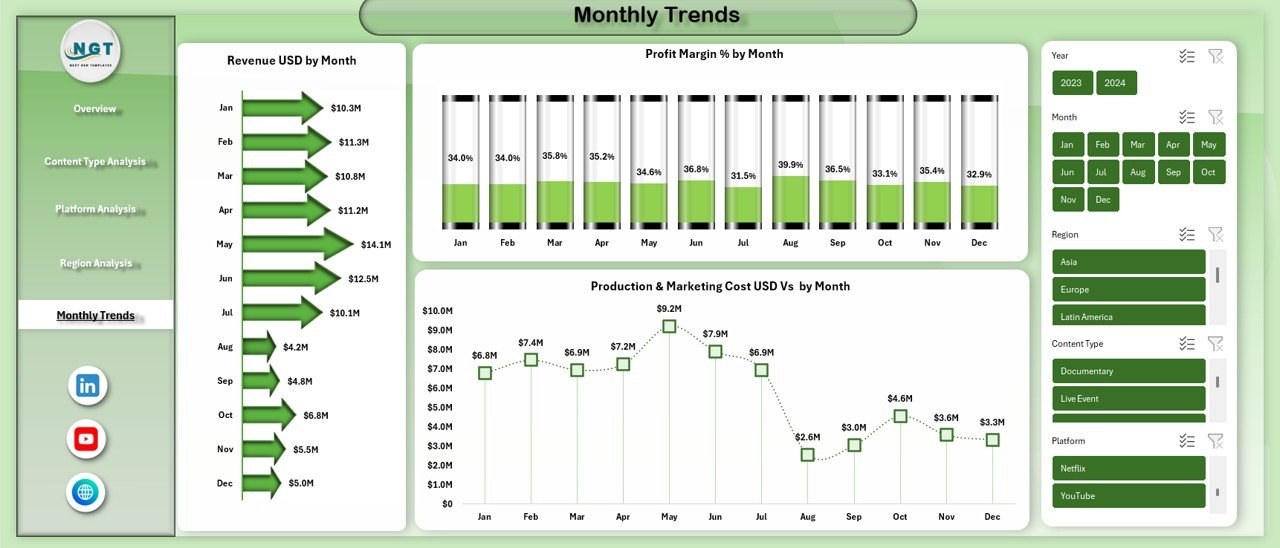
📅 Monthly Trends
-
Revenue USD by Month
-
Profit Margin % by Month
-
Production & Marketing Cost by Month
Each sheet answers a critical business question, helping you move from data to action faster.
## 🛠️ How to Use the Media and Entertainment Dashboard in Excel
Using this dashboard is simple and beginner-friendly ✅:
1️⃣ Enter or paste your media data into the structured data table
2️⃣ Refresh pivot tables if needed
3️⃣ Instantly view updated KPIs and charts
4️⃣ Use filters to analyze content, platform, region, or time period
5️⃣ Review insights and take action
Because the dashboard is built entirely in Excel, no technical skills are required.
## 👥 Who Can Benefit from This Media and Entertainment Dashboard in Excel
This dashboard is ideal for:
🎥 Media production houses
📡 OTT & streaming platforms
📺 Television networks
📱 Digital content creators & studios
📢 Marketing & audience growth teams
💰 Finance & revenue management teams
📊 Media consultants & analysts
Whether you manage a small content studio or a large media enterprise, this dashboard adapts to your needs.
Click here to read the Detailed blog post
Watch the step-by-step video tutorial:
Visit our YouTube channel to learn step-by-step video tutorials
https://youtube.com/@PKAnExcelExpert


Reviews
There are no reviews yet.