In today’s competitive wood and furniture manufacturing industry, relying on gut feeling and scattered reports is no longer enough. Rising raw material costs, production inefficiencies, quality issues, and delivery pressures demand clear, real-time performance visibility. That is exactly why the Wood & Furniture Manufacturing KPI Dashboard in Power BI becomes a must-have decision-making tool for modern manufacturers.
This ready-to-use Power BI dashboard transforms raw operational data into clear, visual, and actionable insights. Instead of juggling multiple spreadsheets and manual reports, you get a single, centralized performance command center that shows where your factory stands, what is working, and where corrective action is needed—instantly.
Built specifically for wood processing units, furniture factories, carpentry workshops, and manufacturing plants, this dashboard helps you track production, quality, cost, maintenance, safety, and efficiency KPIs without complexity. Because the dashboard uses Excel as a data source, it remains easy to adopt even for small and mid-sized manufacturers.
If your goal is to reduce waste, improve productivity, control costs, and hit targets consistently, this dashboard gives you the clarity and control you need.
🔑 Key Features of Wood & Furniture Manufacturing KPI Dashboard in Power BI
📊 Interactive Summary Dashboard that shows overall KPI health at a glance
📅 Month-wise slicer to dynamically update all MTD and YTD numbers
🧩 KPI Group filtering for Production, Quality, Cost, Maintenance, Safety, and more
🎯 Target vs Actual analysis with clear status indicators
📈 Previous Year comparison to track long-term improvement
🔺 Conditional formatting icons to instantly identify good and poor performance
📉 Dedicated KPI Trend page for deep KPI-wise analysis
📘 Built-in KPI Definition framework for clarity and consistency
🔄 Excel-based data input, no complex systems required
⚡ Fully automated calculations using Power BI visuals and logic
📦 What’s Inside the Wood & Furniture Manufacturing KPI Dashboard
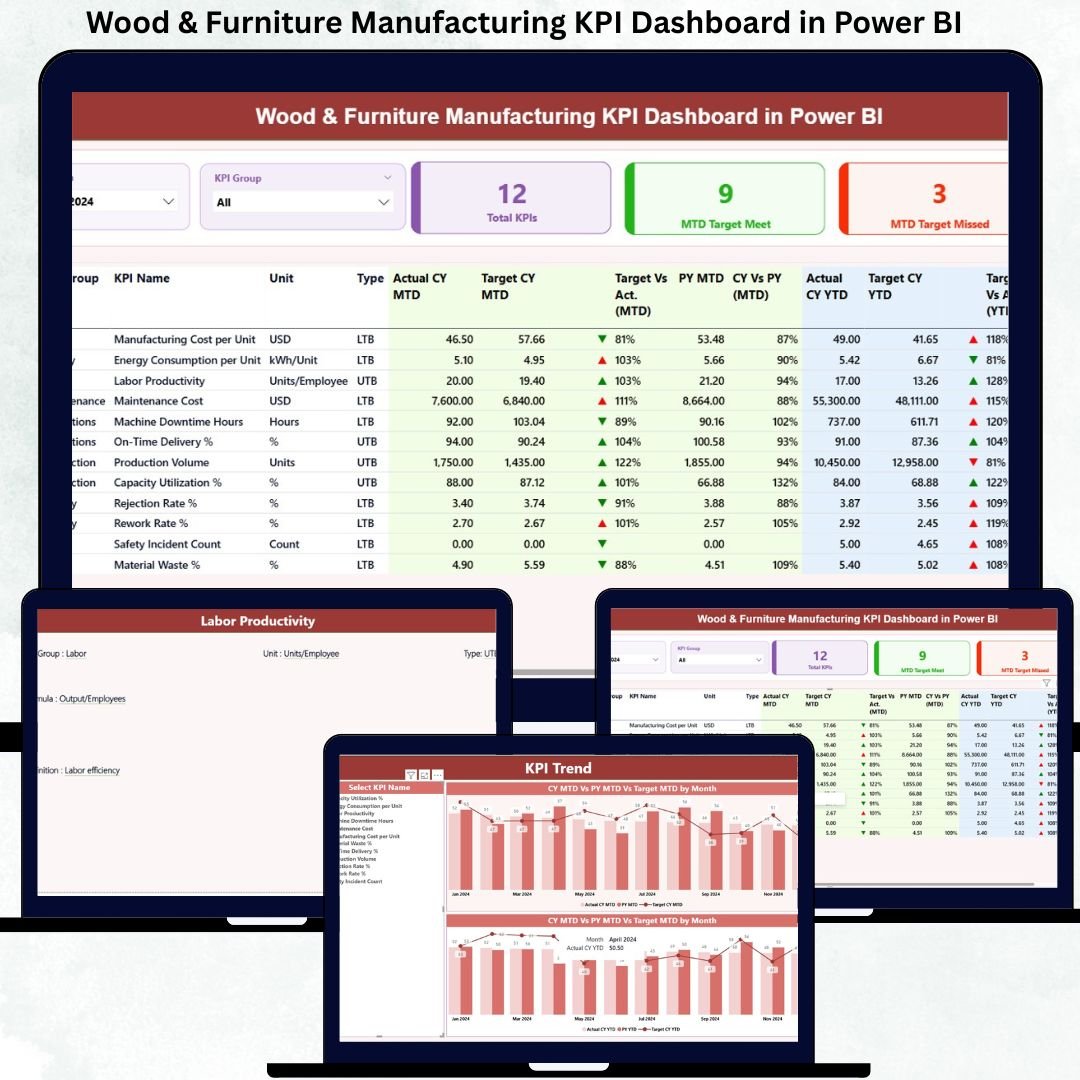
This Power BI dashboard comes with three professionally designed pages, each serving a specific purpose:
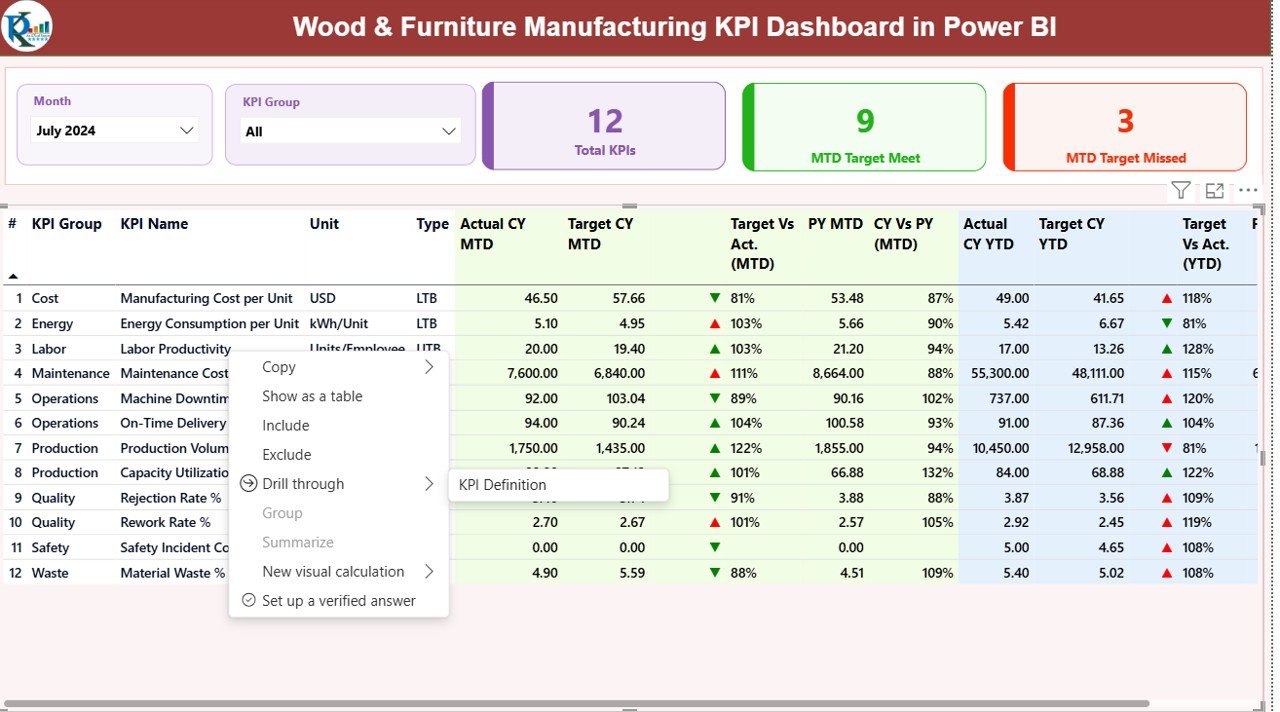
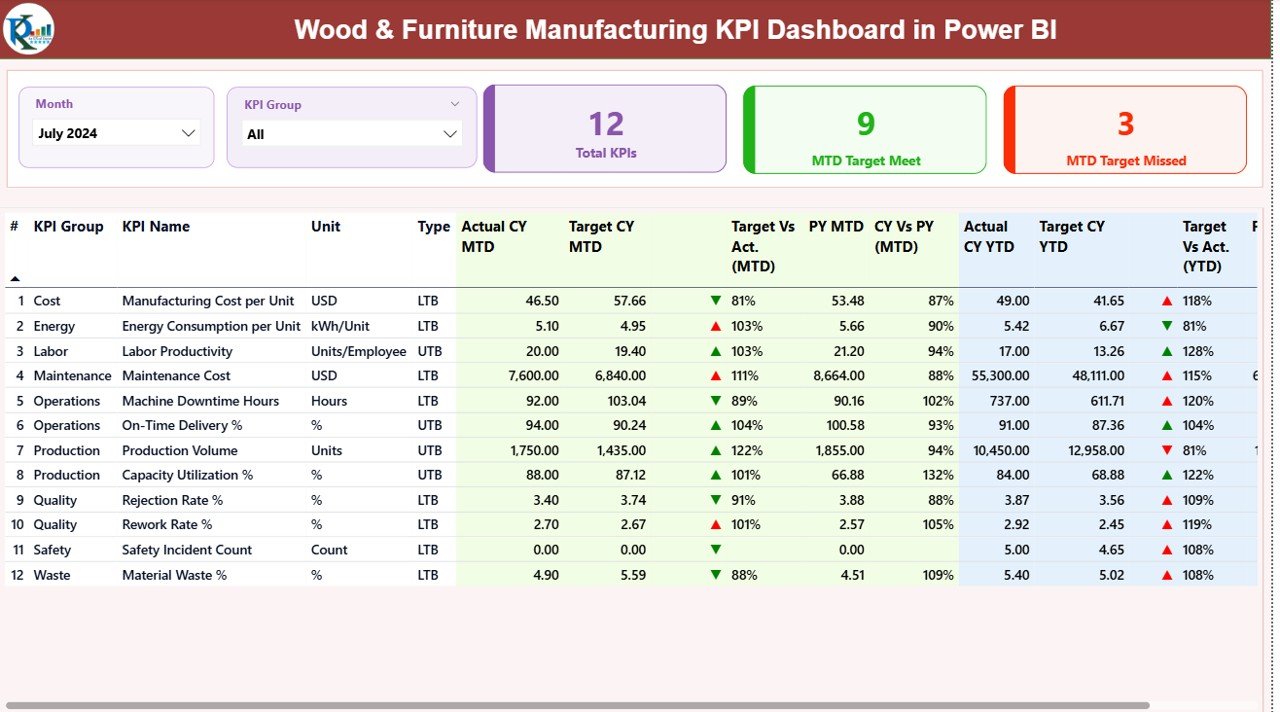
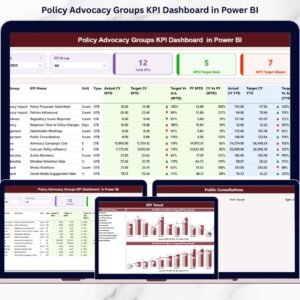
🟢 Summary Page
A high-level performance overview showing total KPIs, targets met, targets missed, and a detailed KPI table with MTD and YTD performance.
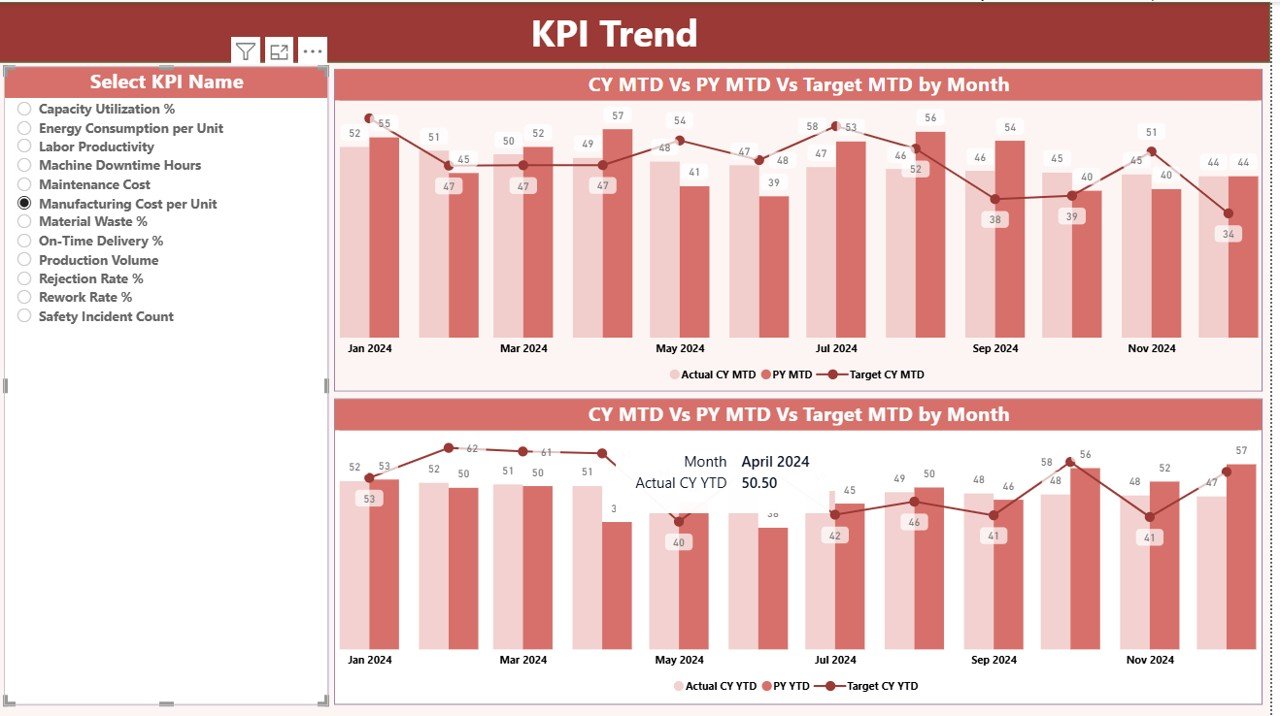
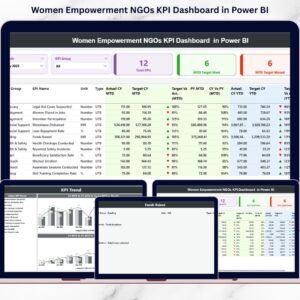
📈 KPI Trend Page
Allows KPI-wise analysis using combo charts for Current Year, Previous Year, and Target—helping you identify trends, issues, and improvements quickly.
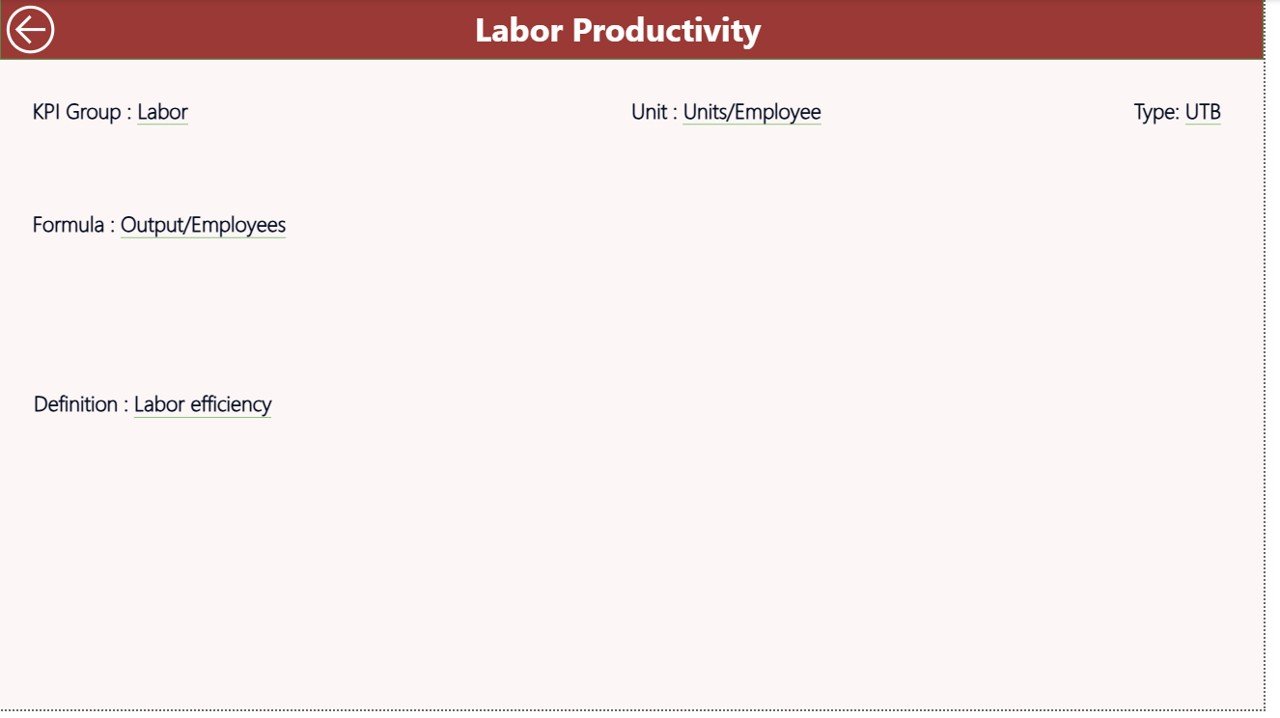
📘 KPI Definition Page
A drill-through reference page that explains KPI logic, formulas, units, and definitions—ensuring transparency and alignment across teams.
Additionally, you get a structured Excel data model with sheets for Actuals, Targets, and KPI Definitions, making data updates simple and consistent.
⚙️ How to Use the Wood & Furniture Manufacturing KPI Dashboard
Using this dashboard is straightforward and user-friendly:
1️⃣ Enter actual performance data in the Input_Actual Excel sheet
2️⃣ Maintain targets in the Input_Target sheet
3️⃣ Define or modify KPIs in the KPI Definition sheet
4️⃣ Refresh the Power BI file
5️⃣ Instantly view updated MTD, YTD, target variance, and trends
No advanced Power BI skills are required. If you can work with Excel, you can run this dashboard confidently.
👥 Who Can Benefit from This Wood & Furniture Manufacturing KPI Dashboard
This dashboard is ideal for:
🏭 Factory Managers
🧑🏭 Production Supervisors
📦 Operations Heads
🧪 Quality Managers
🛠️ Maintenance Teams
💰 Finance & Cost Controllers
👔 Business Owners & Plant Heads
Whether you manage a single workshop or multiple manufacturing units, this dashboard helps you move from reactive reporting to proactive decision-making.
Click here to read the Detailed blog post
Watch the step-by-step video tutorial:


Reviews
There are no reviews yet.