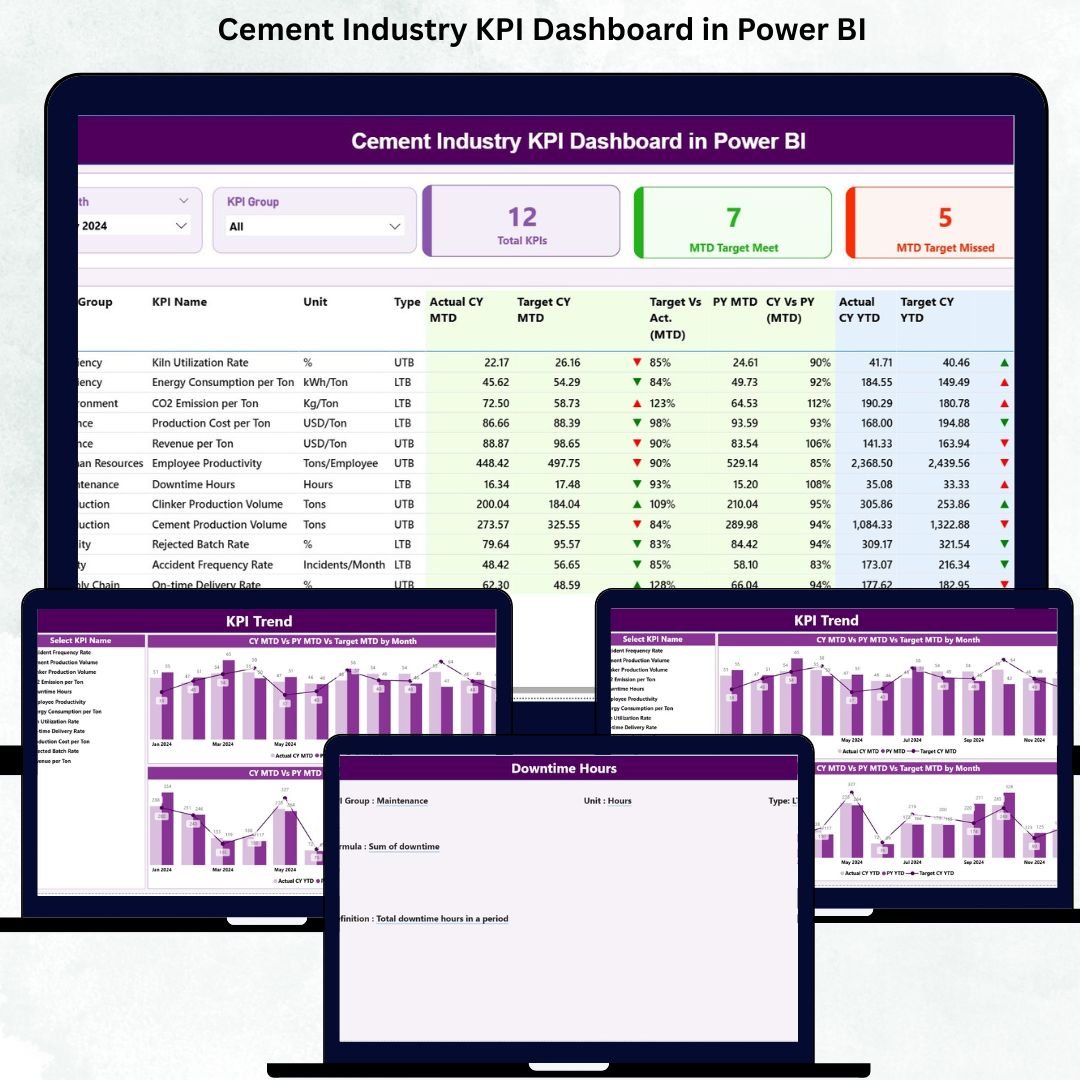
Managing a cement plant means handling hundreds of numbers every single day—production, quality, energy, maintenance, safety, and logistics. But when data is scattered across Excel files and reports, tracking performance becomes slow and confusing. That’s where the Cement Industry KPI Dashboard in Power BI becomes a game-changing solution. It brings every critical KPI into one place, gives instant insights, and helps leaders take fast, confident decisions. Cement Industry KPI Dashboard in Power BI If you want a simple, powerful, and professional dashboard built specially for the cement sector, this template is exactly what you need.
Cement Industry KPI Dashboard in Power BI with Power BI’s interactive visuals, slicers, drill-through pages, and real-time summaries, this dashboard shows complete operational performance in just a few clicks. Whether you’re a production head, quality manager, energy officer, or plant director—this dashboard gives you crystal-clear answers in seconds.
🚀 Key Features of the Cement Industry KPI Dashboard in Power BI
This dashboard is packed with high-impact features designed for cement plant reporting:
📊 All KPI Groups in One Place
Track Production, Quality, Energy, Safety, Logistics, and Efficiency KPIs—without switching between different reports.
🗂️ Interactive Summary Page
Use Month and KPI Group slicers to instantly filter data and review plant performance.
📈 Smart KPI Cards
View Total KPIs, MTD Target Met, and MTD Target Missed—perfect for quick decision-making.
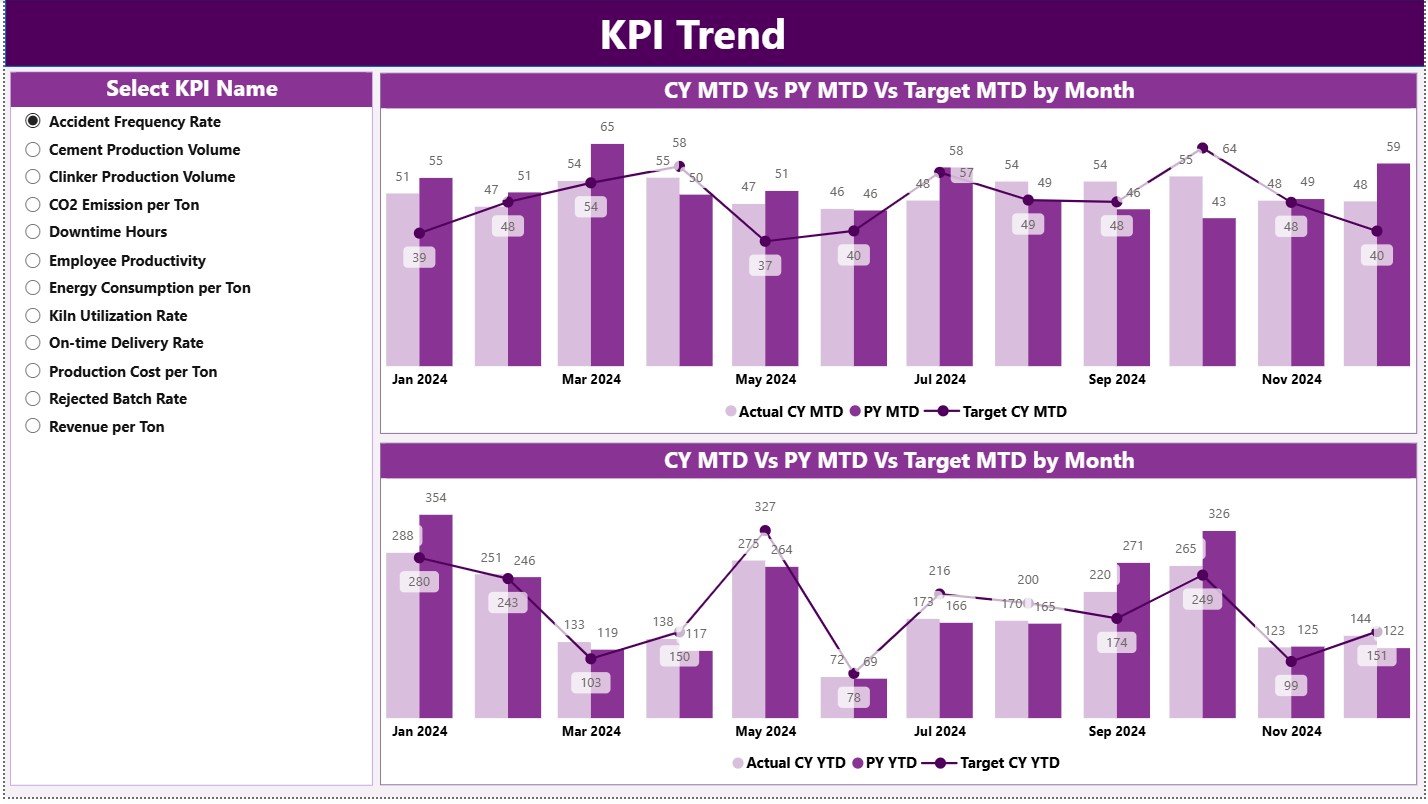
📉 Advanced Trend Analytics
MTD and YTD comparison charts show how performance is improving, declining, or fluctuating over time.
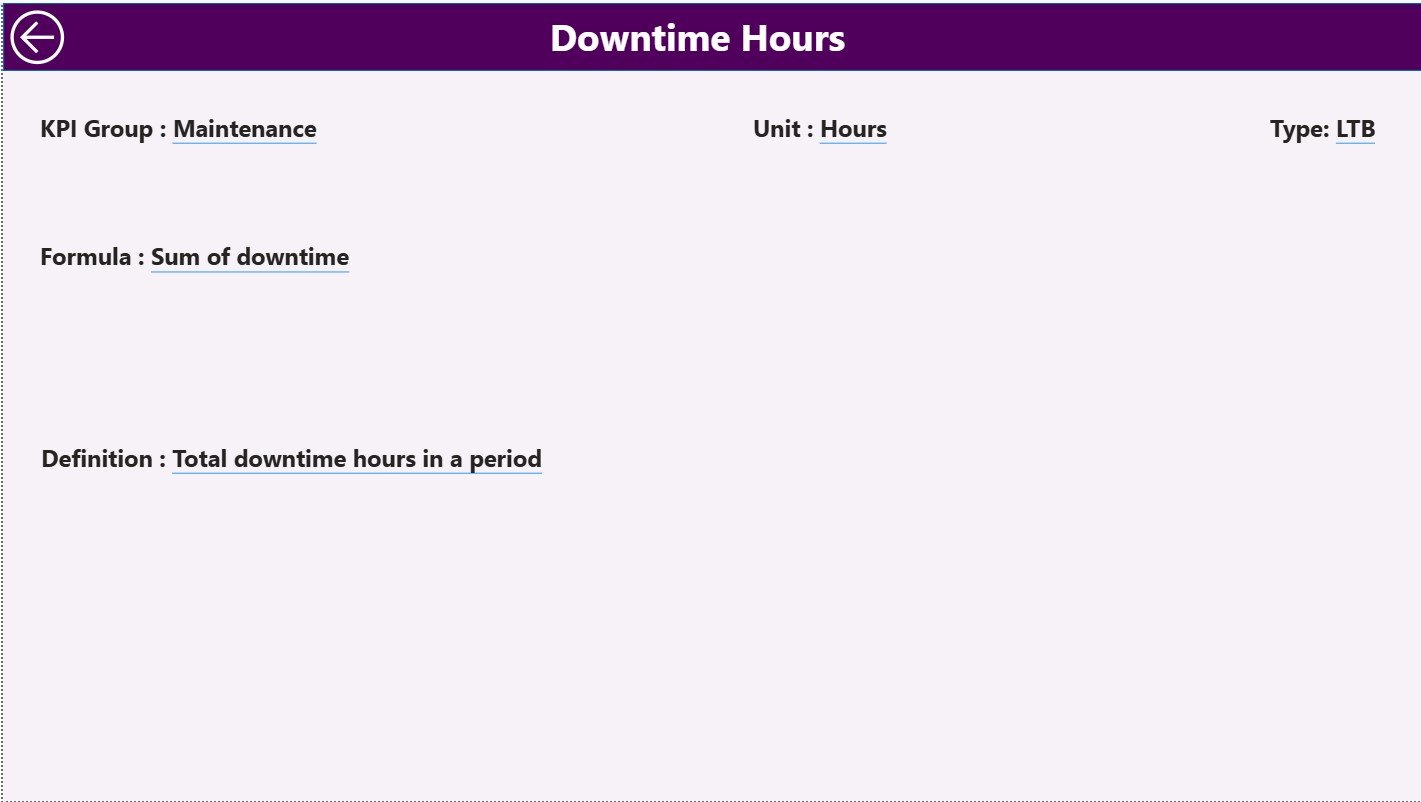
📌 Drill-Through KPI Definition Page
Understand the exact formula, definition, and logic behind every KPI with a single right-click.
🟢🔴 Instant Performance Indicators
Green and red arrows help you spot problem KPIs within seconds.
🔗 Excel-Connected & Auto-Updating
Update the Excel file → Refresh Power BI → Dashboard updated instantly.
📦 What’s Inside the Cement Industry KPI Dashboard
Inside this complete Power BI package, you get:
1️⃣ Summary Page
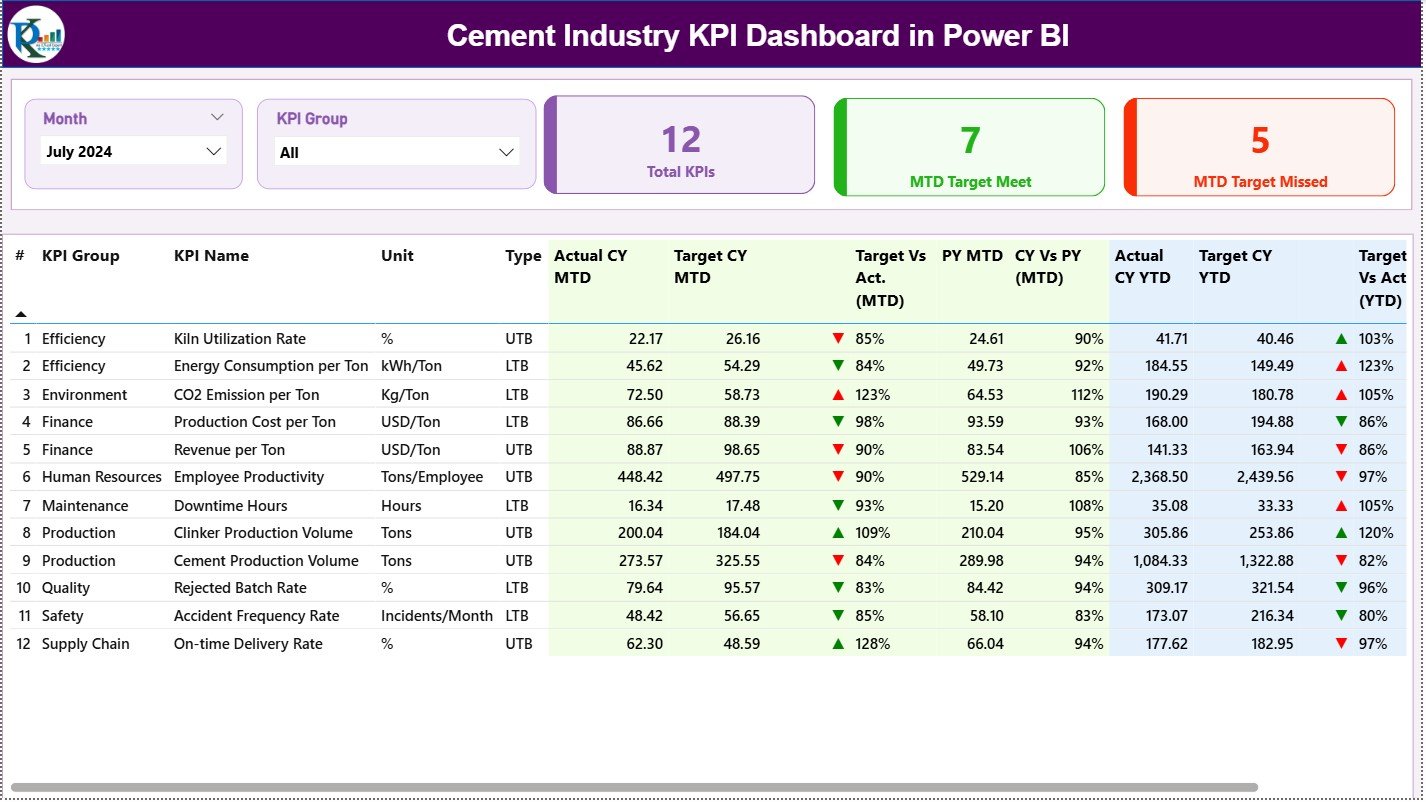
A master control panel that shows KPI health with slicers, cards, and a detailed KPI performance table.
2️⃣ KPI Trend Page
Two combo charts showing MTD and YTD comparisons across current year, target, and previous year—ideal for monthly reviews.
3️⃣ KPI Definition Page
A detailed drill-through sheet containing KPI formulas, units, definitions, and type (UTB/LTB).
4️⃣ Excel Data File
Includes Input Actual, Input Target, and KPI Definition sheets—fully structured and ready to use.
This is not just a dashboard—it’s a complete reporting ecosystem for cement companies.
🛠️ How to Use the Cement Industry KPI Dashboard
Using this dashboard is extremely simple:
👉 Step 1: Update Excel Files
Enter Actual and Target data in the provided Excel sheets.
👉 Step 2: Refresh Power BI
Click “Refresh” inside Power BI Desktop—your dashboard updates instantly.
👉 Step 3: Use Slicers
Pick your month and KPI group to analyze performance quickly.
👉 Step 4: Explore Trends
Use the Trend page to check how KPIs are moving across months and years.
👉 Step 5: Drill Through for Clarity
Right-click any KPI to view its formula and definition.
👉 Step 6: Present in Meetings
Use KPI cards, icons, and trend charts to make powerful presentations for management.
👥 Who Can Benefit from This Power BI Dashboard?
This dashboard is designed especially for:
🏭 Cement Plant Heads
Monitor full plant performance in one place.
⚙️ Production Managers
Track clinker output, run hours, and efficiency trends.
🧪 Quality Managers
Review residue, fineness, strength, and clinker factor KPIs.
🔌 Energy Teams
Track thermal and electrical consumption KPIs.
🚚 Logistics & Dispatch Teams
Analyze dispatch volume, delivery performance, and loading trends.
📉 Finance & Cost Teams
Track target achievement and performance deviations.
📊 Senior Management
Get high-level visibility across the entire cement value chain.
Anyone involved in plant operations, reporting, or performance improvement will find this dashboard extremely useful.


Reviews
There are no reviews yet.