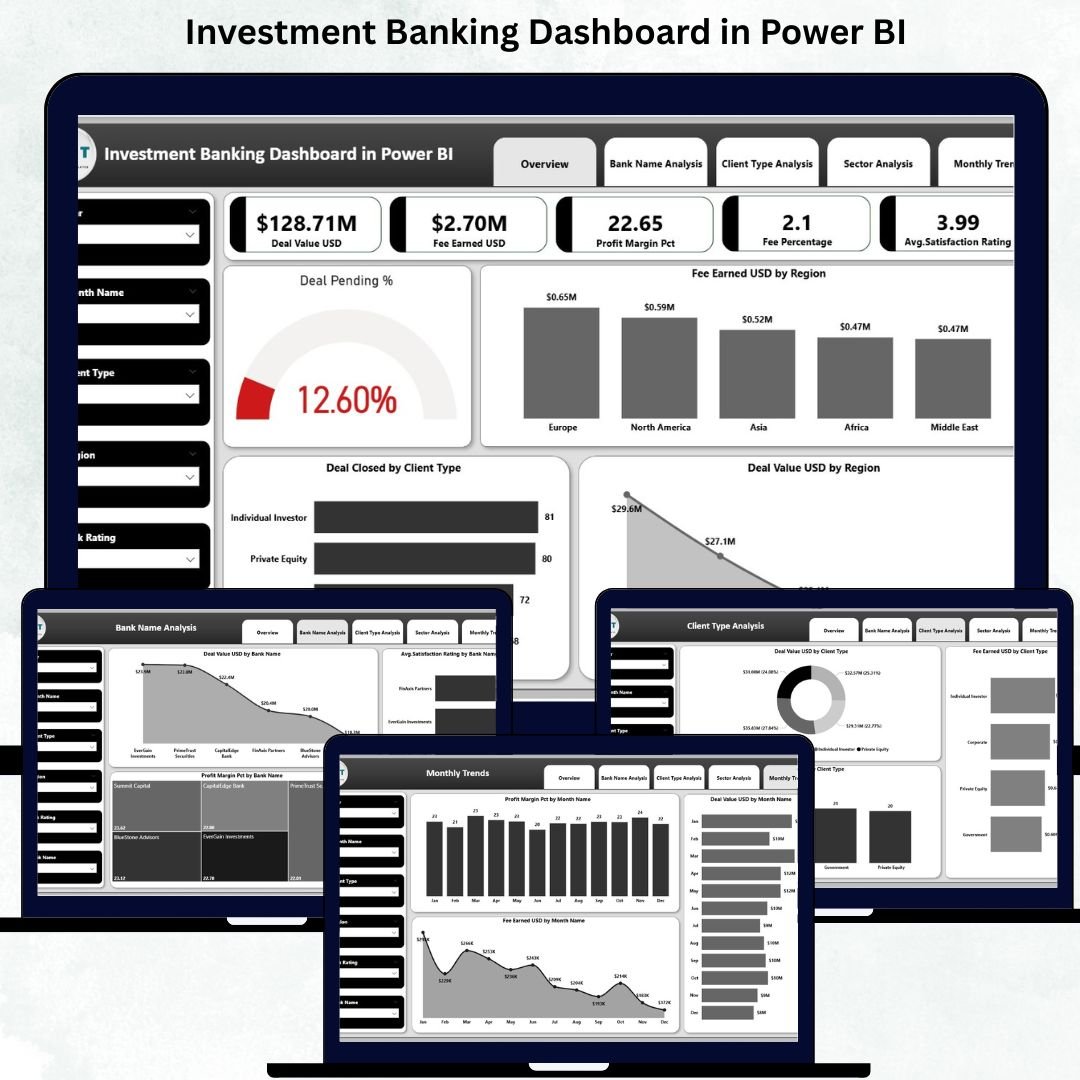
Investment banking involves fast-moving deals, complex financial data, and high-value transactions. From deal closure performance to fee trends, client type behaviour, sector-wise profitability, and satisfaction ratings—banks must monitor dozens of KPIs daily. But most teams still depend on disconnected spreadsheets, time-consuming reports, and manual analysis. Investment Banking Dashboard in Power BI This leads to delays, gaps in visibility, and missed opportunities.
Investment Banking Dashboard in Power BI the Investment Banking Dashboard in Power BI solves all these challenges and transforms the way financial teams operate. Investment Banking Dashboard in Power BI With this dashboard, you get a clean, interactive, and visually rich reporting environment where you can track deal flow, analyze fee earned, compare banks, evaluate sectors, and monitor profit margins—all inside one modern, professionally designed Power BI report.
No manual reporting.
No complex formulas.
Just instant insights powered by automation.
Investment Banking Dashboard in Power BI This dashboard updates instantly when the underlying data refreshes, helping investment bankers, analysts, and leadership teams work smarter, faster, and with complete accuracy.
✨ Key Features of the Investment Banking Dashboard in Power BI
This dashboard includes five powerful analytical pages, each designed to support strategic financial decision-making.
📌 Overview Page – Full Investment Banking Snapshot
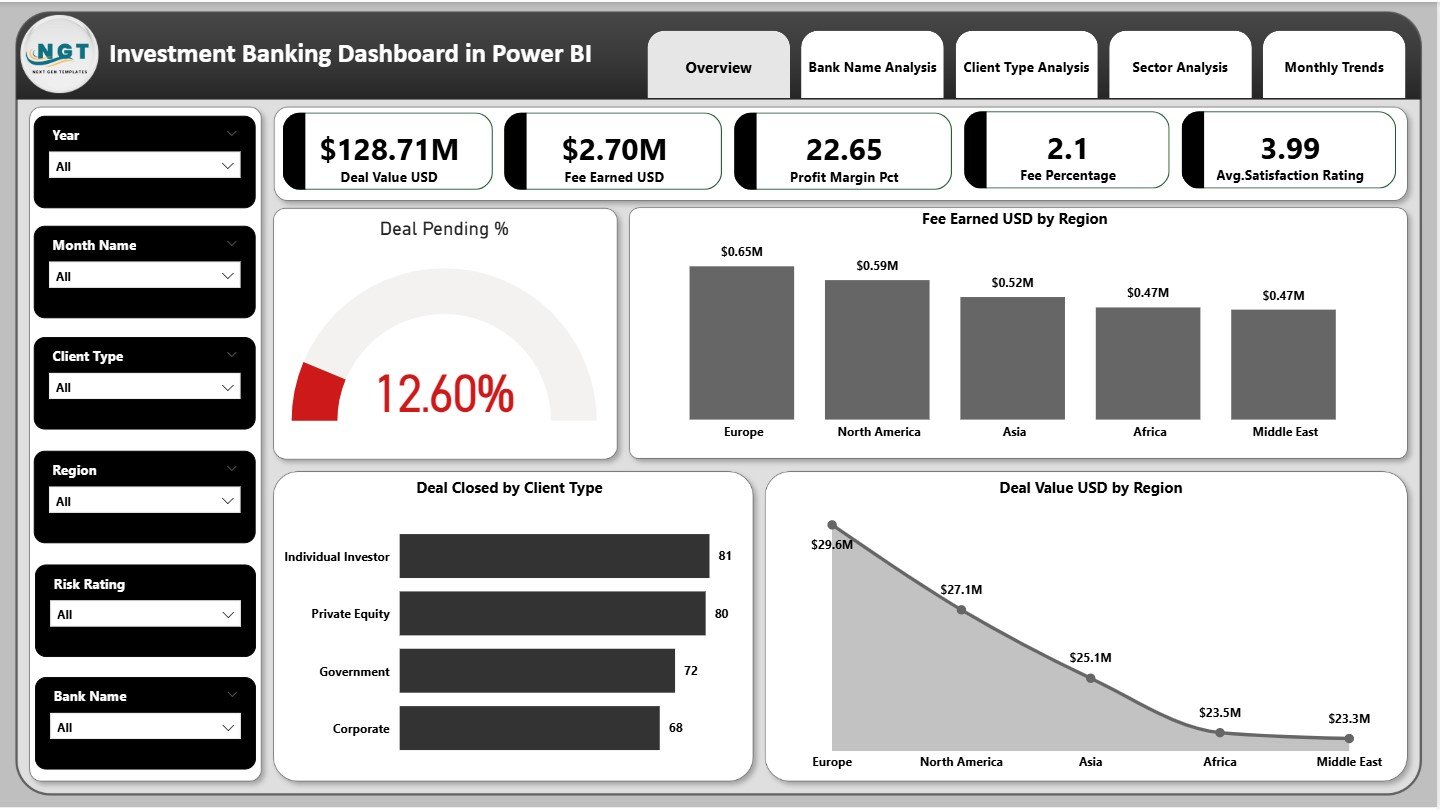
The Overview Page is the central hub of your dashboard. It includes interactive slicers that let you filter insights by region, deal type, or client category.
🔹 KPI Cards
✔ Deal Value (USD)
✔ Fee Earned (USD)
✔ Profit Margin (%)
✔ Fee Percentage
✔ Average Satisfaction Rating
These KPIs provide immediate visibility into the health of investment banking performance.
🔹 Detailed Visuals
✔ Deal Pending
✔ Fee Earned by Region
✔ Deal Closed by Client Type
✔ Deal Value by Region
These visuals help you identify strong regions, profitable customers, and areas needing attention.
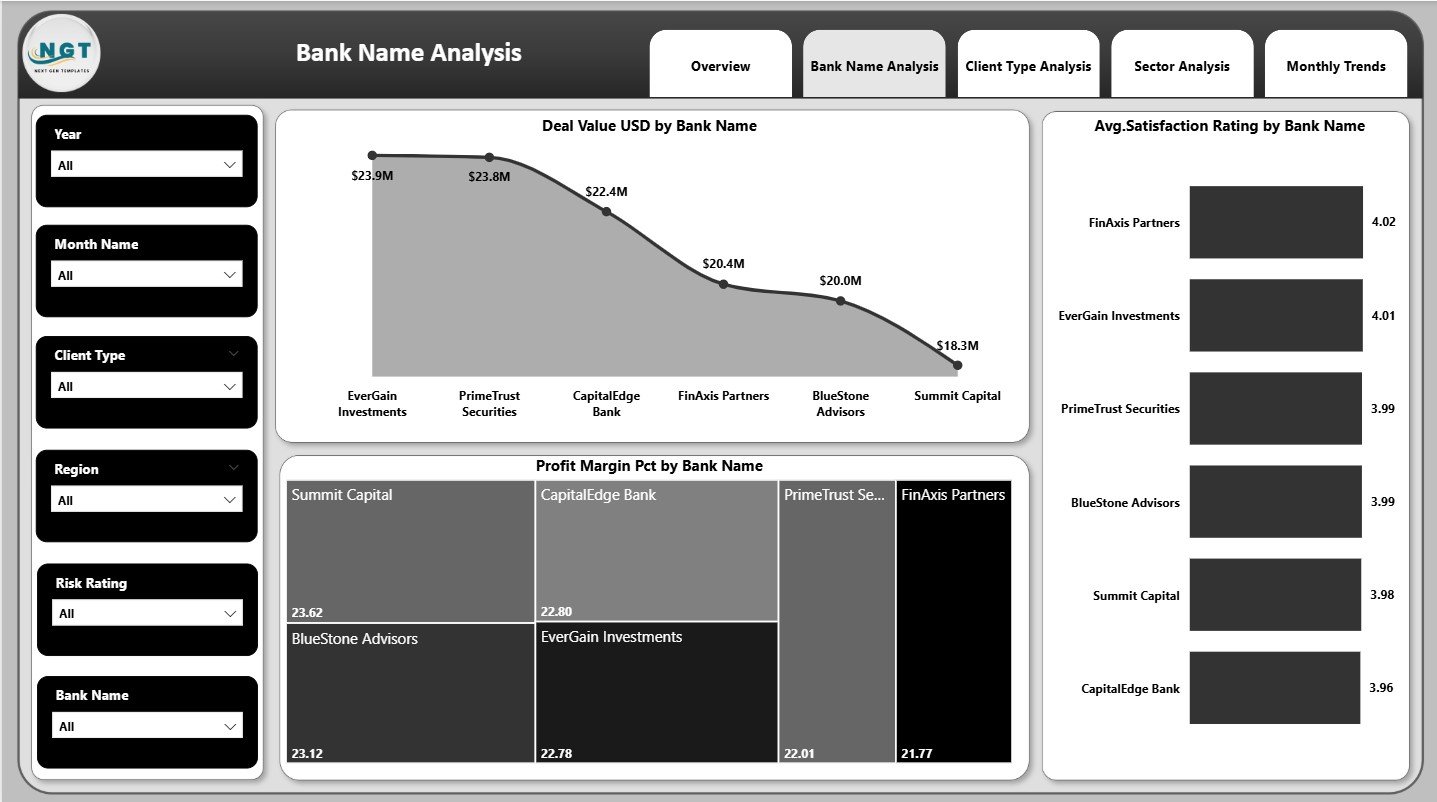
📌 Bank Name Analysis Page – Compare Bank-Wise Performance
This page highlights how different banks perform across key KPIs.
Charts include:
✔ Deal Value by Bank Name
✔ Average Satisfaction Rating by Bank Name
✔ Profit Margin (%) by Bank Name
These insights help leadership compare banks, evaluate performance patterns, and improve strategic partnerships.
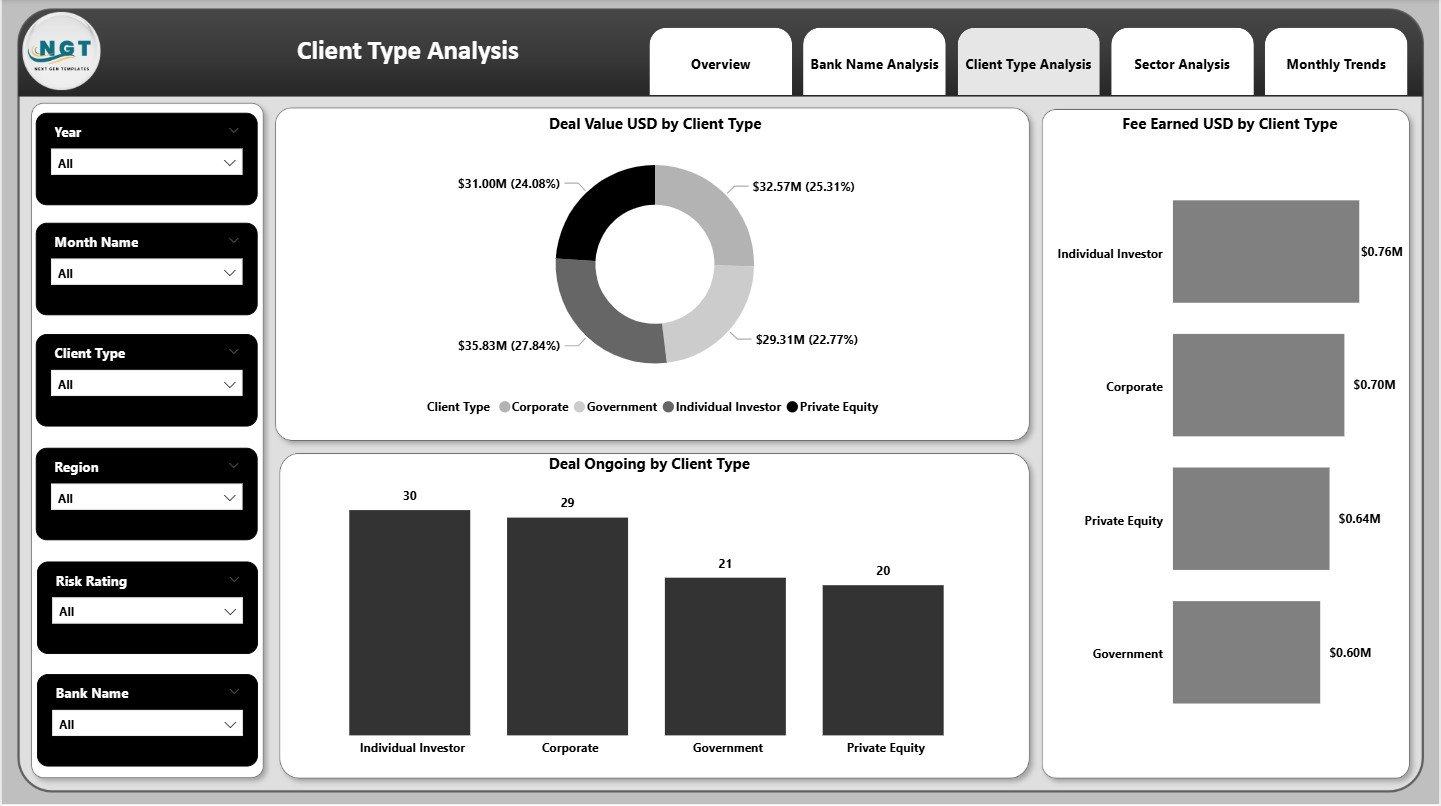
📌 Client Type Analysis Page – Understand Client Behaviour
Investment banks work with multiple client segments such as corporates, institutions, startups, and high-net-worth individuals.
This page includes:
✔ Deal Value by Client Type
✔ Fee Earned by Client Type
✔ Deal Ongoing by Client Type
With these insights, you know which clients contribute the highest revenue, which clients generate more fees, and which segments require deeper focus.
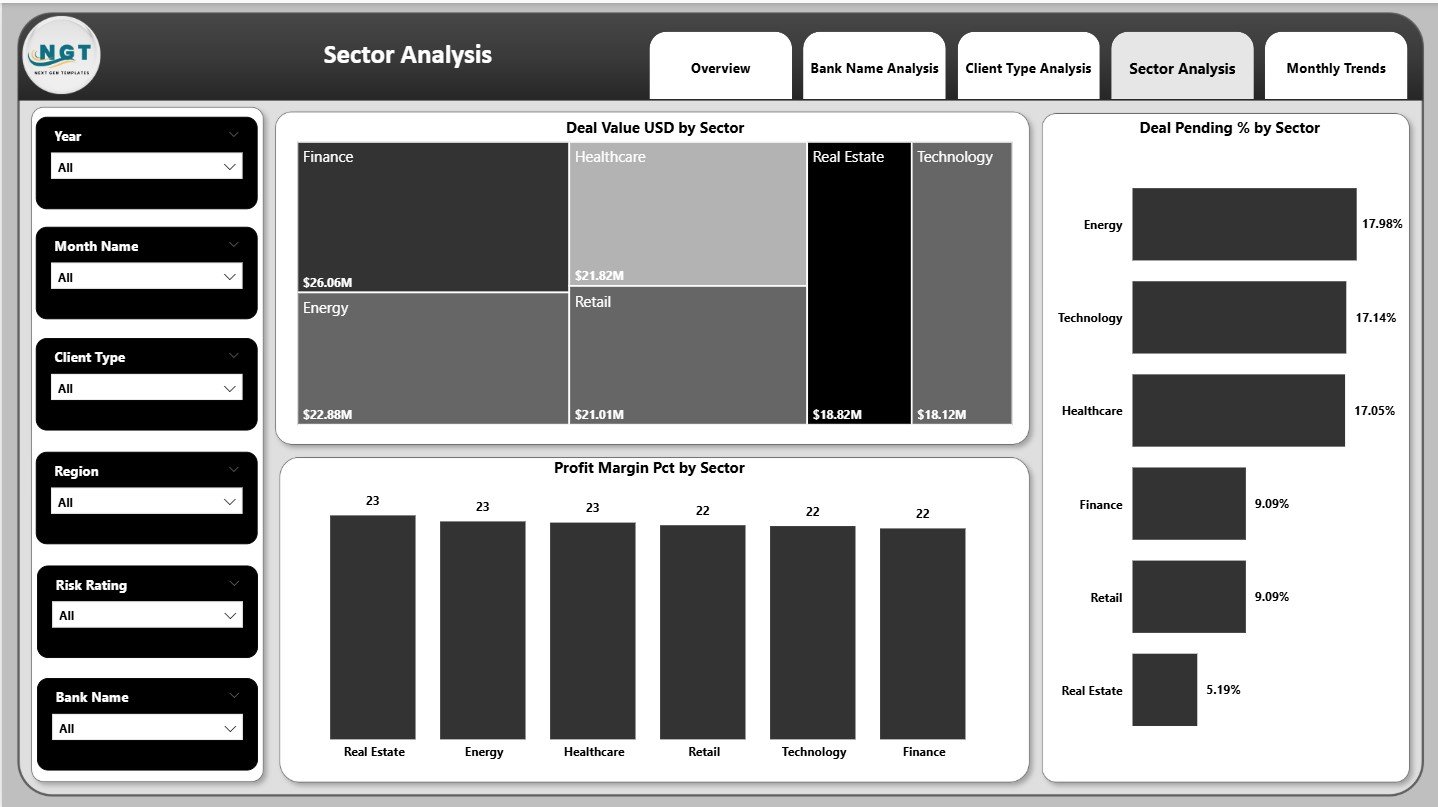
📌 Sector Analysis Page – Evaluate Sector-Wise Deal Trends
Investment banking success often depends on understanding which sectors are growing or slowing down.
Charts include:
✔ Deal Value by Sector
✔ Deal Pending (%) by Sector
✔ Profit Margin (%) by Sector
These visuals help you identify high-performing sectors, declining industries, and areas for strategic improvement.
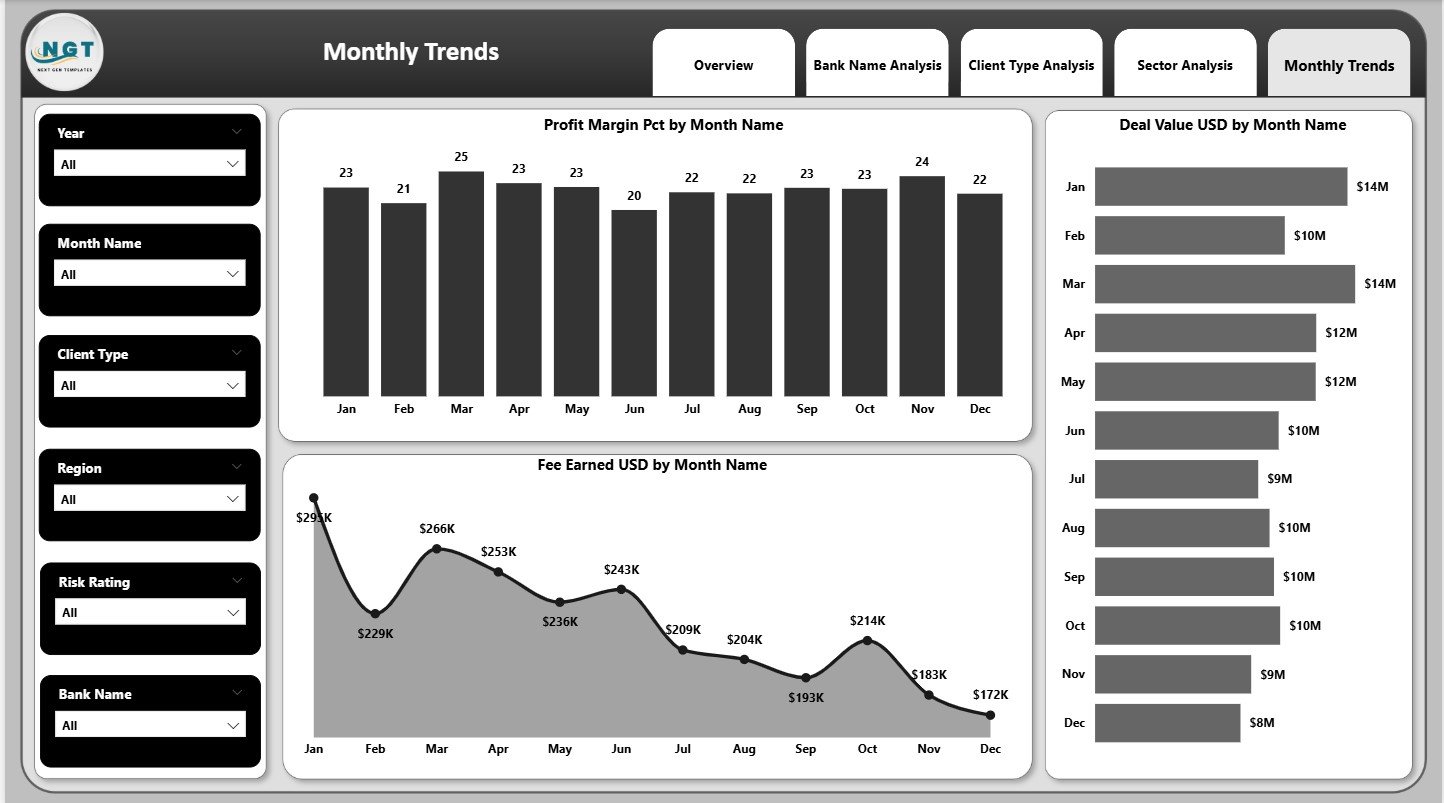
📌 Monthly Trends Page – Track Month-Wise Behaviour
This page displays monthly patterns for:
✔ Profit Margin (%)
✔ Fee Earned (USD)
✔ Deal Value (USD)
With these insights, you can identify seasonality, monthly peaks, dips, and future performance opportunities.
📦 What’s Inside the Investment Banking Dashboard
✔ 5 analytical pages
✔ KPI cards & comparison metrics
✔ Region, sector, bank, and client insights
✔ Monthly trends & growth tracking
✔ Slicers and interactivity
✔ Fully automated data refresh
🛠️ How to Use the Investment Banking Dashboard in Power BI
👉 Step 1: Connect your Excel or SQL data source
👉 Step 2: Refresh the data
👉 Step 3: Use slicers to filter results
👉 Step 4: Navigate through analysis pages
👉 Step 5: Share insights with leadership or clients
With minimal Power BI knowledge, anyone can use this dashboard effectively.
🎯 Who Can Benefit from This Dashboard?
💼 Investment Bankers
Track deals, fees, and performance effortlessly.
📊 Financial Analysts
Explore trends, sectors, and client performance.
🏦 Corporate Finance Teams
Monitor M&A, advisory performance, and financial KPIs.
📈 Senior Leaders & Directors
Get accurate, real-time visibility for decision-making.
📉 Strategy & Risk Teams
Identify gaps and improve future planning.
This dashboard is perfect for both small investment firms and large global banking groups.


Reviews
There are no reviews yet.