
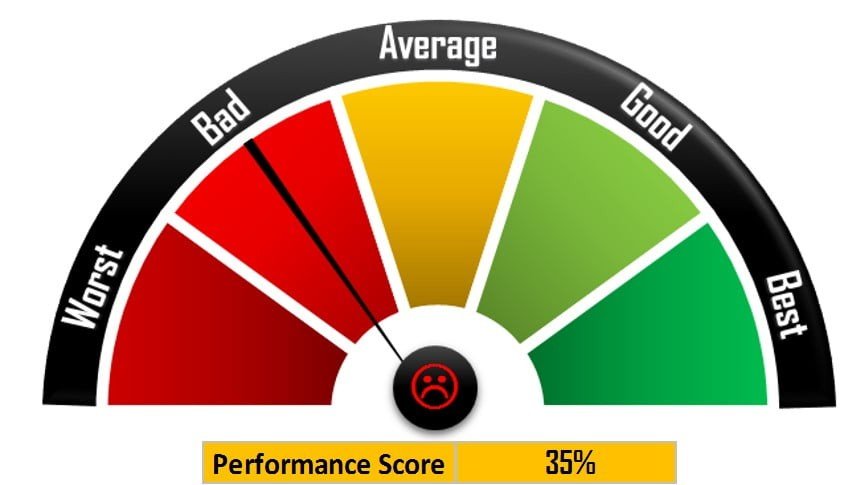
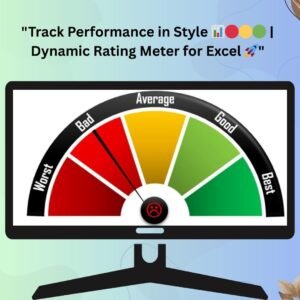
The Rating Meter Chart in Excel is a dynamic, visually striking tool designed to provide clear, actionable insights into performance metrics. It offers a highly visual representation of scores and ratings, providing an instant overview of an individual’s or team’s performance in a way that is easy to understand and interpret. The gauge is divided into several sections, each representing a different performance level—ranging from “Worst” to “Best”—with color gradients and symbols that immediately highlight the performance category.
Key Features
1. Visual Appeal and Intuitive Design
The Rating Meter Chart uses a color-coded system, with distinct zones like red for “Worst”, yellow for “Average”, and green for “Best”, making it easy to visualize and interpret the data at a glance. It’s an ideal tool for dashboard applications or performance reports where quick insights are necessary.
2. Customizable Performance Buckets
The chart offers the flexibility to tailor the performance levels and their corresponding ranges based on your specific requirements. You can set the score ranges for each segment to match your business or team standards, ensuring that the chart is perfectly aligned with your evaluation criteria.
3. Easy Data Integration
Integrating performance scores into the Rating Meter Chart is as simple as linking it to a data source, such as a cell containing a score or result. As data changes, the gauge will dynamically update to reflect the new performance score, providing a real-time performance overview without the need for manual adjustments.
4. Smiley Symbol for Emotional Impact
One of the chart’s unique features is its use of interactive smiley symbols that change based on the performance score. Whether it’s a sad face for low performance or a happy face for great performance, these dynamic elements add a fun and engaging layer to your reporting. This can be particularly useful in motivational settings where the goal is to encourage improvement in performance.
5. Interactive and Dynamic Features
The Rating Meter Chart comes with interactive elements like sliders or buttons that can adjust the displayed scores dynamically. This makes it easy to update the chart and see how different performance levels affect overall ratings in real-time. These features are perfect for use in presentations or meetings where decision-makers need to assess data instantly.
6. Versatile Applications
This tool is extremely versatile and can be used in various settings, such as:
- Employee Performance Evaluation: Track and visualize individual or team performance levels against set benchmarks.
- Sales Performance: Display how sales reps or regions are performing against targets.
- Customer Satisfaction: Monitor customer feedback or satisfaction levels.
- Project Progress: Keep track of how different projects or milestones are progressing relative to their expected outcomes.
7. User-Friendly Setup
Even with its advanced features, the Rating Meter Chart is straightforward to set up. With clear instructions and simple Excel formulas, you can get started with little to no prior experience. This allows you to quickly implement the tool in various reporting scenarios.
8. Visual Feedback for Improved Understanding
The color-coded feedback gives an immediate visual clue on how performance stands. Users can quickly identify underperformance or outstanding results, making this a great tool for performance management and improvement tracking.
9. Highly Customizable Aesthetics
Apart from the performance rating segments, you can also customize the font style, chart size, and design elements to match your company’s branding or specific reporting guidelines. It’s a tool that not only provides critical information but also aligns with your organization’s aesthetic preferences.
10. Simplified Analysis for Non-Experts
The simplicity of the Rating Meter Chart allows stakeholders without advanced data analysis skills to understand performance outcomes. Whether you’re sharing this in a corporate environment, in a meeting, or in a report, the chart provides insights in an easy-to-understand format that anyone can grasp.
Benefits
- Quickly Identifies Performance Gaps: Instantly visualize which areas need attention and improvement, making it easier to take corrective actions.
- Improves Communication: The intuitive design helps communicate performance data clearly, making it suitable for team meetings, reviews, and presentations.
- Motivational Tool: Using color-coded feedback and smiley symbols can help motivate employees to improve performance and meet targets.
- Real-Time Insights: As data updates, the chart automatically adjusts, ensuring that you always have up-to-date performance metrics at your fingertips.
- Increases Engagement: The interactive elements keep users engaged with the data, making them more likely to review and act on it.
Whether for tracking employee performance, sales metrics, or any key business KPI, the Rating Meter Chart in Excel is an indispensable tool for clear, visual data presentation and real-time performance monitoring. Its customizability and interactive features allow it to be tailored to any business needs, making it an essential addition to your data reporting toolkit.
Click here to read the detailed blog post
Visit our YouTube channel to learn step-by-step video tutorials
Watch the step-by-step video tutorial:
Also check our Power Gantt Chart in Excel


Reviews
There are no reviews yet.