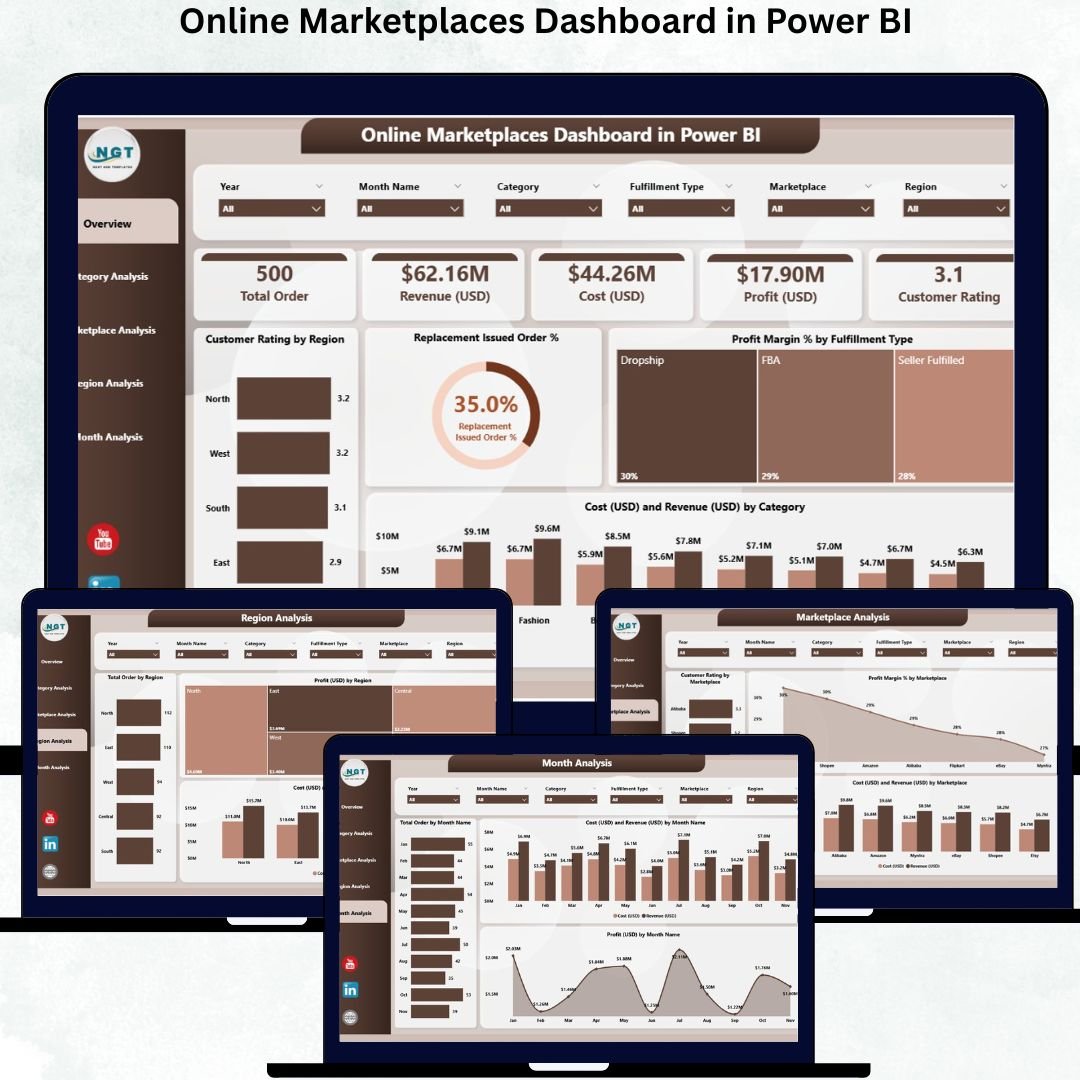
In the fast-paced world of e-commerce, managing multiple online marketplaces efficiently is a major challenge 🛒💻. Tracking sales, costs, profits, and customer satisfaction across platforms can quickly become overwhelming. That’s where the Online Marketplaces Dashboard in Power BI comes in—a ready-to-use, interactive tool designed to help businesses monitor marketplace performance, identify trends, and make data-driven decisions with confidence.
This dashboard consolidates data from multiple online selling platforms into one visual interface, turning raw numbers into actionable insights. Unlike static reports or scattered spreadsheets, this Power BI dashboard provides real-time updates, interactive charts, and slicers that allow you to drill down into key metrics. Whether you are an e-commerce manager, analyst, or business owner, this tool ensures you always stay ahead of trends and opportunities.
Key Features of Online Marketplaces Dashboard in Power BI
-
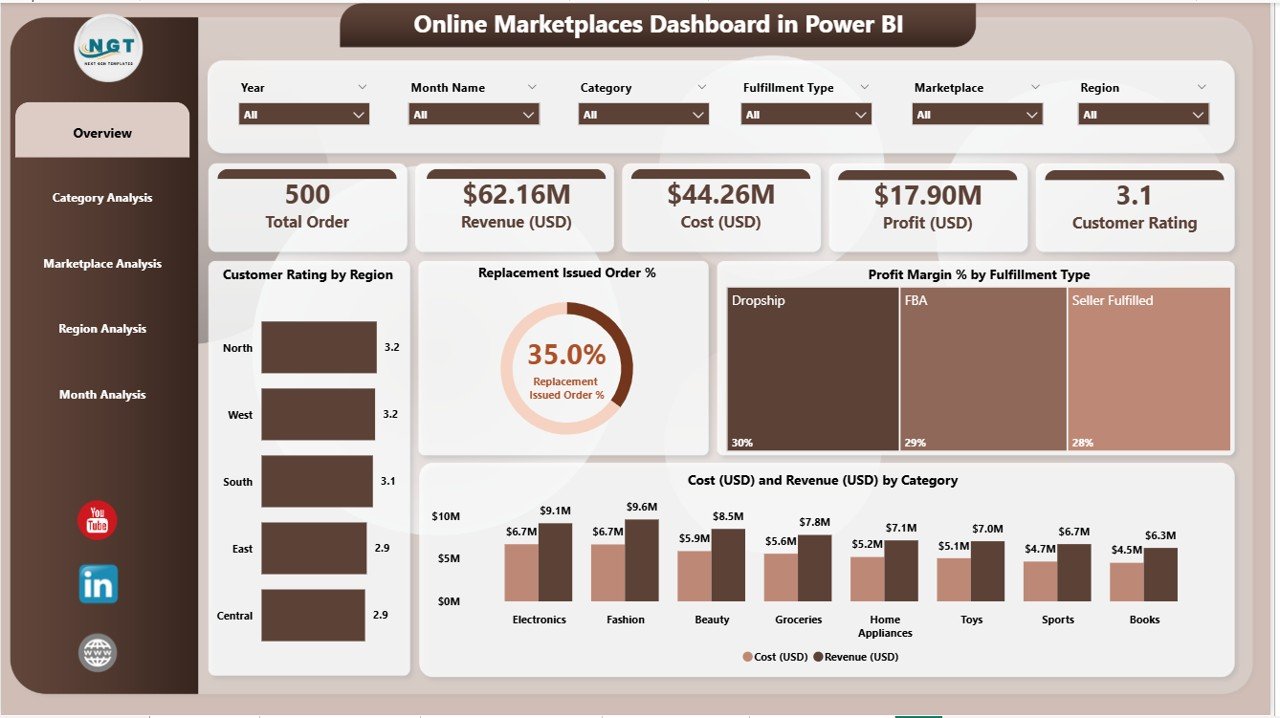
Overview Page 📊 – Get a high-level snapshot of total revenue, cost, profit margins, order volume, and customer satisfaction across marketplaces.
-
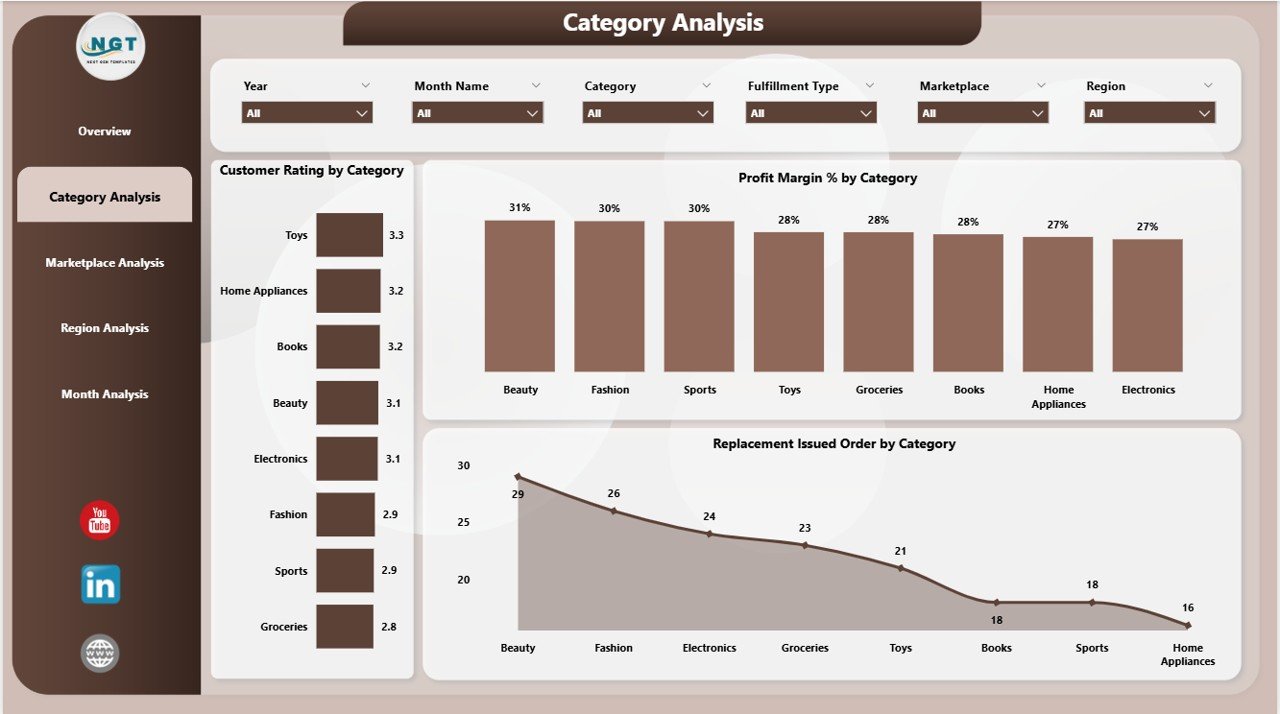
Category Analysis 🛍️ – Identify top-performing product categories, track profitability, and monitor customer ratings and replacement trends.
-
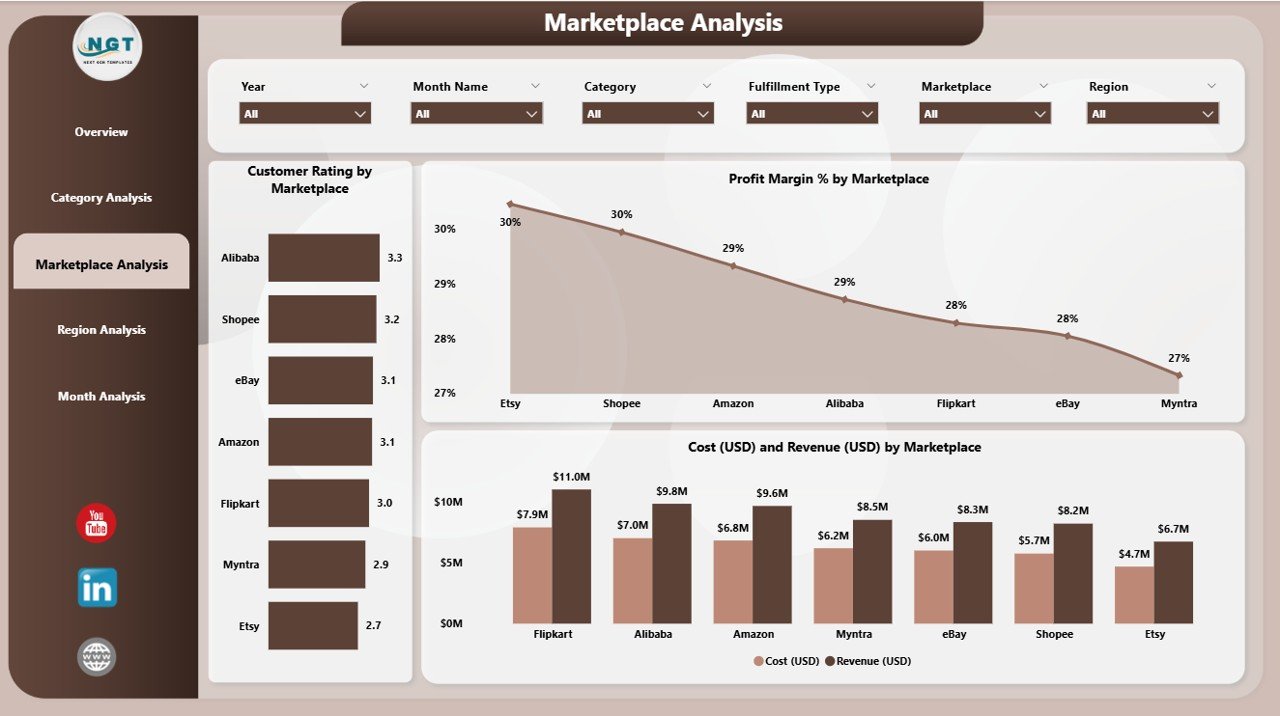
Marketplace Analysis 🌐 – Compare performance of different online marketplaces, highlighting profitability, costs, and customer feedback.
-
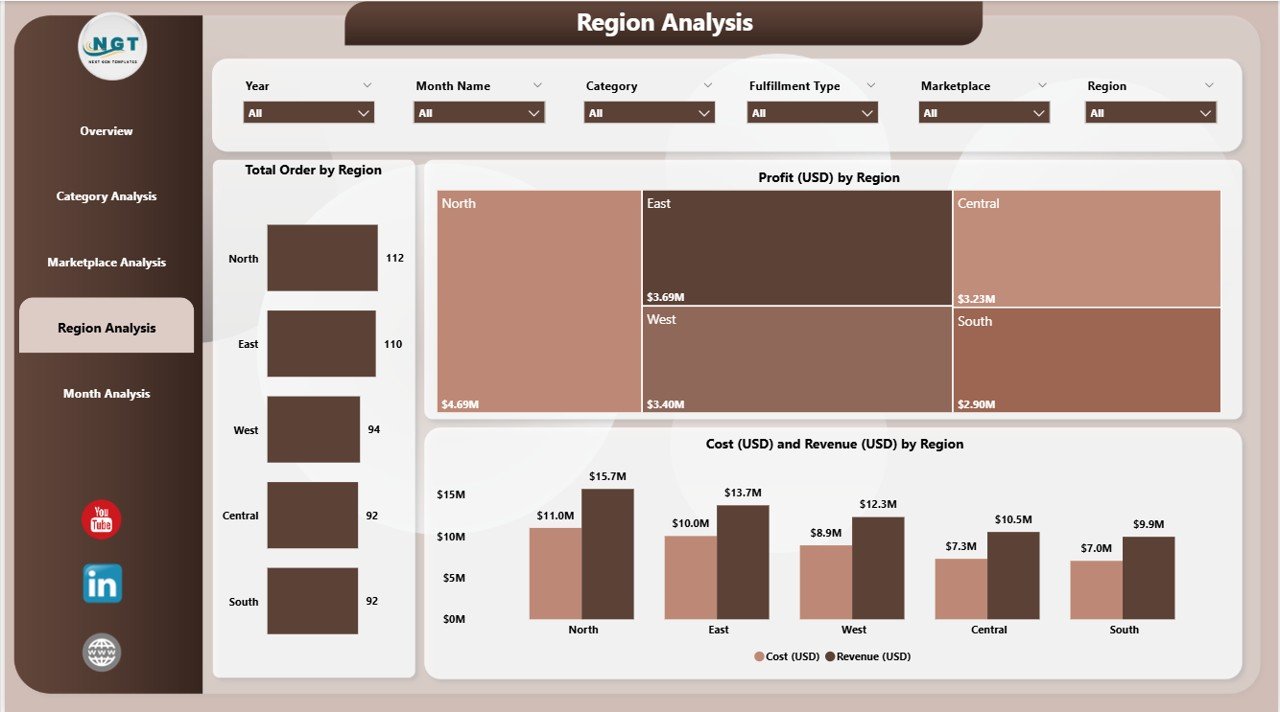
Region Analysis 🌎 – Analyze regional performance to optimize marketing campaigns, inventory allocation, and operational resources.
-
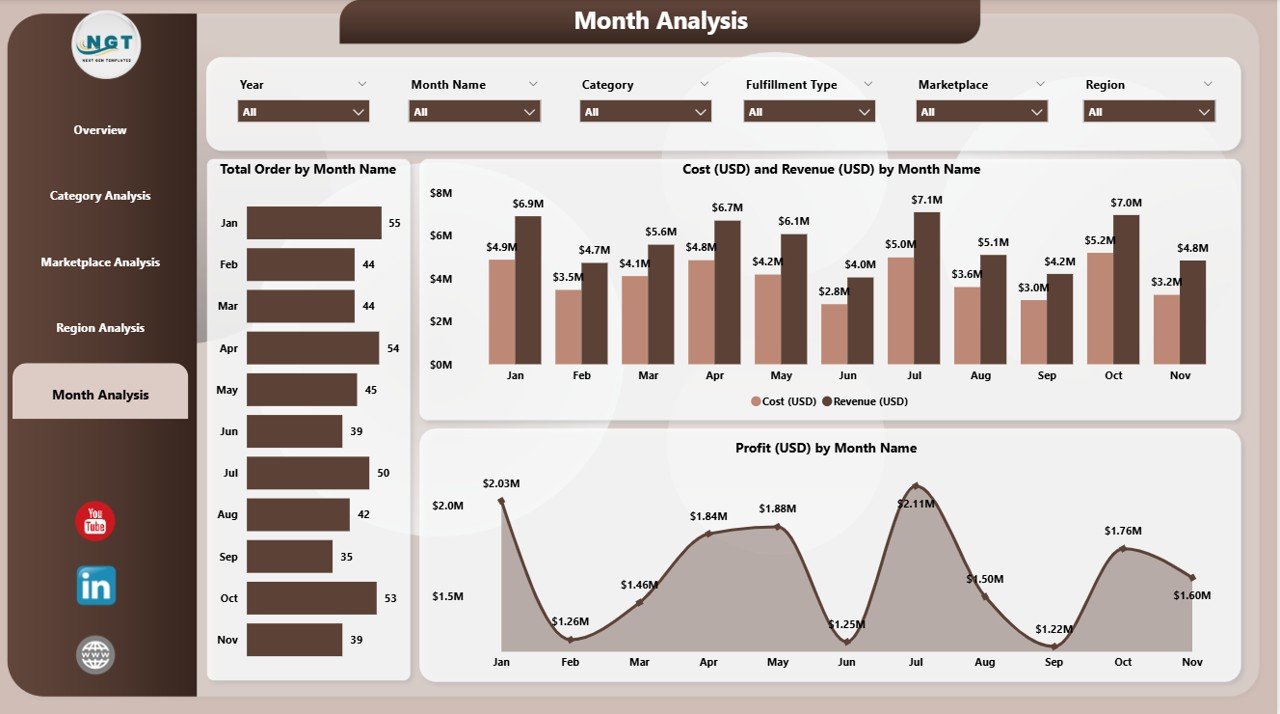
Monthly Trends 📈 – Monitor sales, profits, and order volumes over time to understand seasonality and plan promotions.
-
Interactive & Customizable ⚡ – Filter data by marketplace, category, or region with slicers; drill through visuals for deeper insights.
-
Real-Time Insights ⏱️ – Refresh the dashboard to instantly update all metrics without manual reporting.
-
Actionable Data 💡 – Identify opportunities, optimize operations, and improve customer experience based on insights.
What’s Inside the Online Marketplaces Dashboard
-
Overview Page – Key KPI cards and visual charts for total revenue, cost, profit margin, order volume, and customer ratings.
-
Category Analysis Page – Insights into product categories’ profitability, customer satisfaction, and replacement trends.
-
Marketplace Analysis Page – Evaluate the performance of each online marketplace and compare metrics.
-
Region Analysis Page – Geographic breakdown of sales, profit, and customer ratings to optimize regional strategies.
-
Monthly Trends Page – Trend analysis over time to forecast sales and plan promotions effectively.
How to Use the Online Marketplaces Dashboard
-
Connect Your Data 💻 – Import or link sales, cost, and customer data from multiple marketplaces.
-
Update Regularly 🔄 – Ensure your dashboard reflects the most current figures.
-
Analyze Trends 📊 – Use slicers to focus on categories, marketplaces, or regions.
-
Drill-Through Insights 🔍 – Click visuals to explore details and uncover actionable patterns.
-
Act on Insights ⚡ – Optimize pricing, promotions, inventory, and marketing strategies.
Who Can Benefit from This Dashboard
-
E-commerce Managers 🛒 – Monitor performance, optimize operations, and increase revenue.
-
Business Owners 💼 – Get real-time insights across all marketplaces and make informed strategic decisions.
-
Analysts & Teams 📊 – Track trends, evaluate categories, and provide actionable recommendations.
-
Retail & Marketplace Teams 💻 – Simplify reporting and ensure everyone stays aligned on KPIs.
Click here to read the Detailed blog post
Visit our YouTube channel to learn step-by-step video tutorials


Reviews
There are no reviews yet.