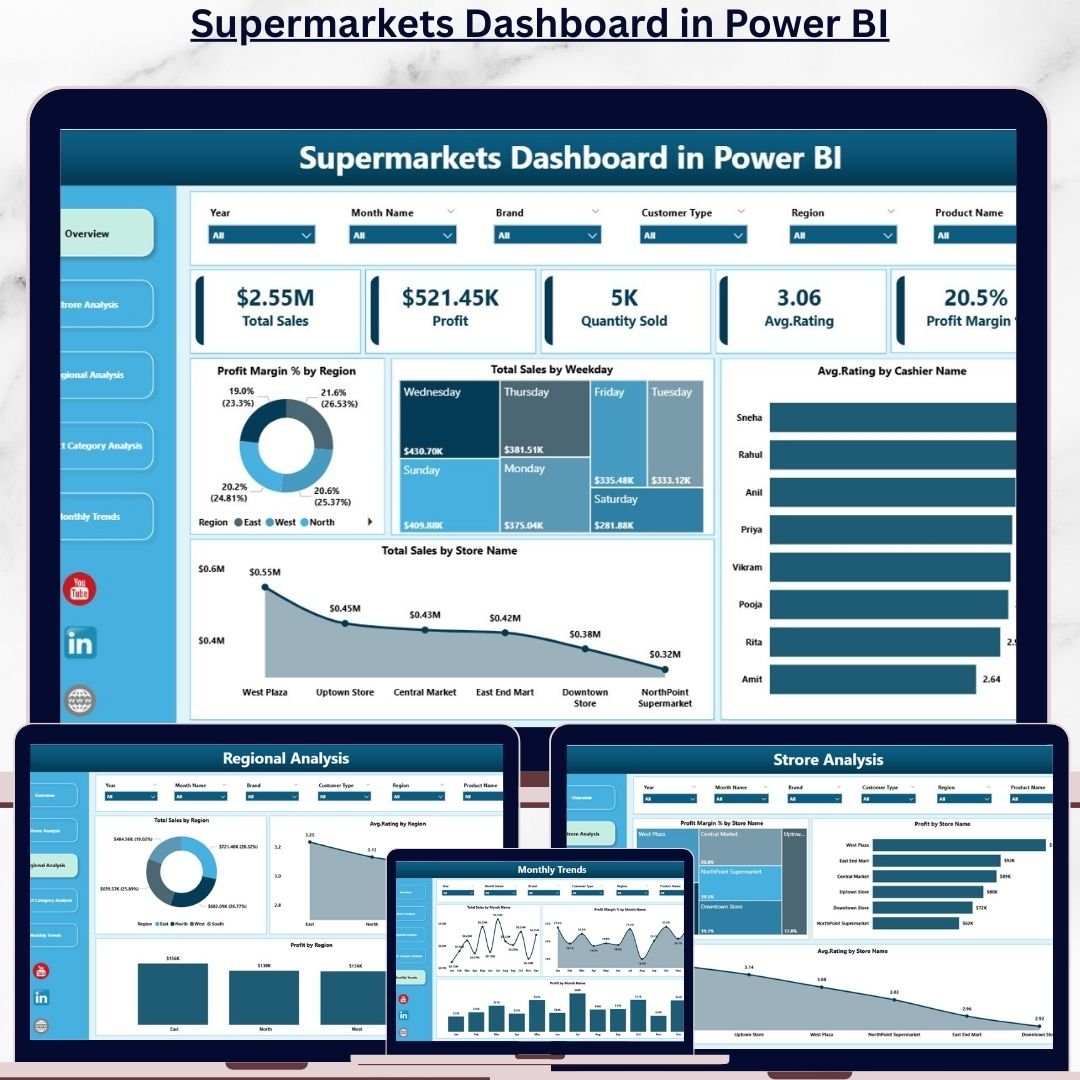
In today’s fast-paced retail world, managing supermarkets efficiently is more challenging than ever 🛒. Tracking sales, understanding customer preferences, and optimizing store performance can overwhelm even the most experienced managers. That’s where the Supermarkets Dashboard in Power BI comes in—a complete, ready-to-use solution designed to give supermarket managers, analysts, and executives full control over their operations.
This interactive Power BI dashboard connects to your data sources, aggregates sales, store, regional, and product category metrics, and presents them visually for easy understanding. No more sifting through spreadsheets or outdated reports—this dashboard provides real-time insights to make data-driven decisions quickly and confidently.
Key Features of Supermarkets Dashboard in Power BI
-
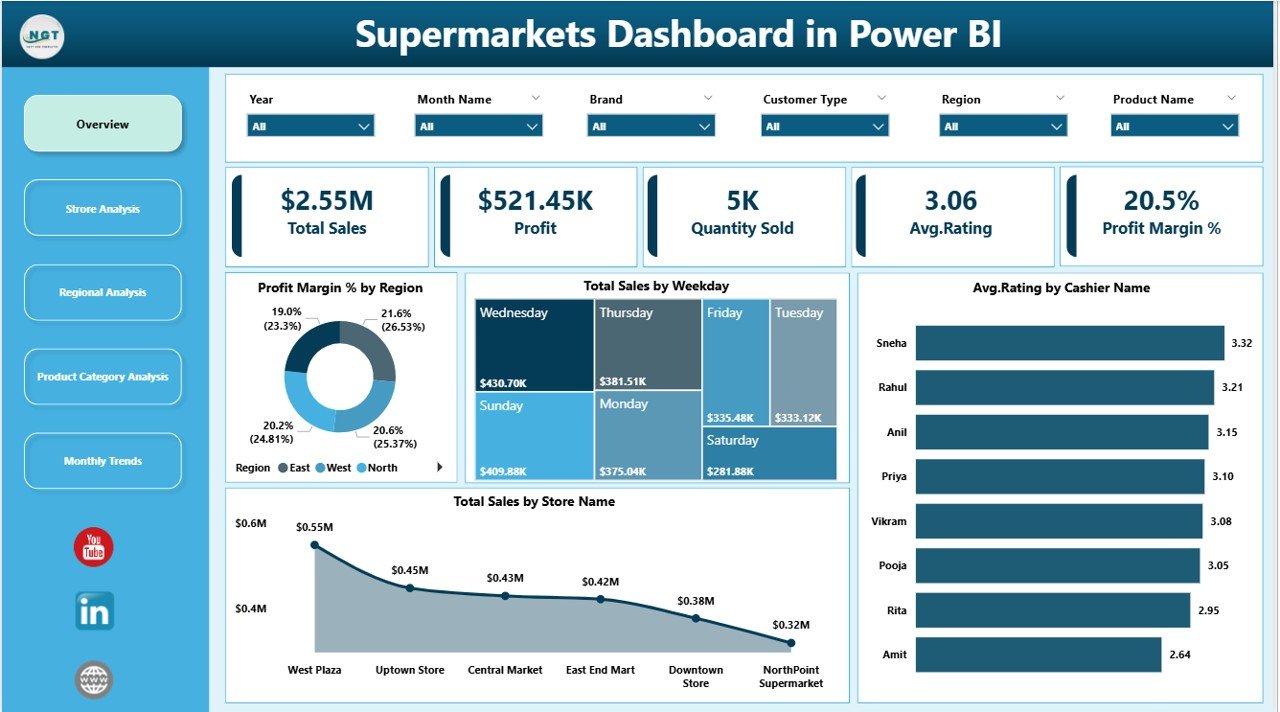
Overview Page 📊 – Get a quick snapshot of total sales, profit, average ratings, and profit margins across stores and regions.
-
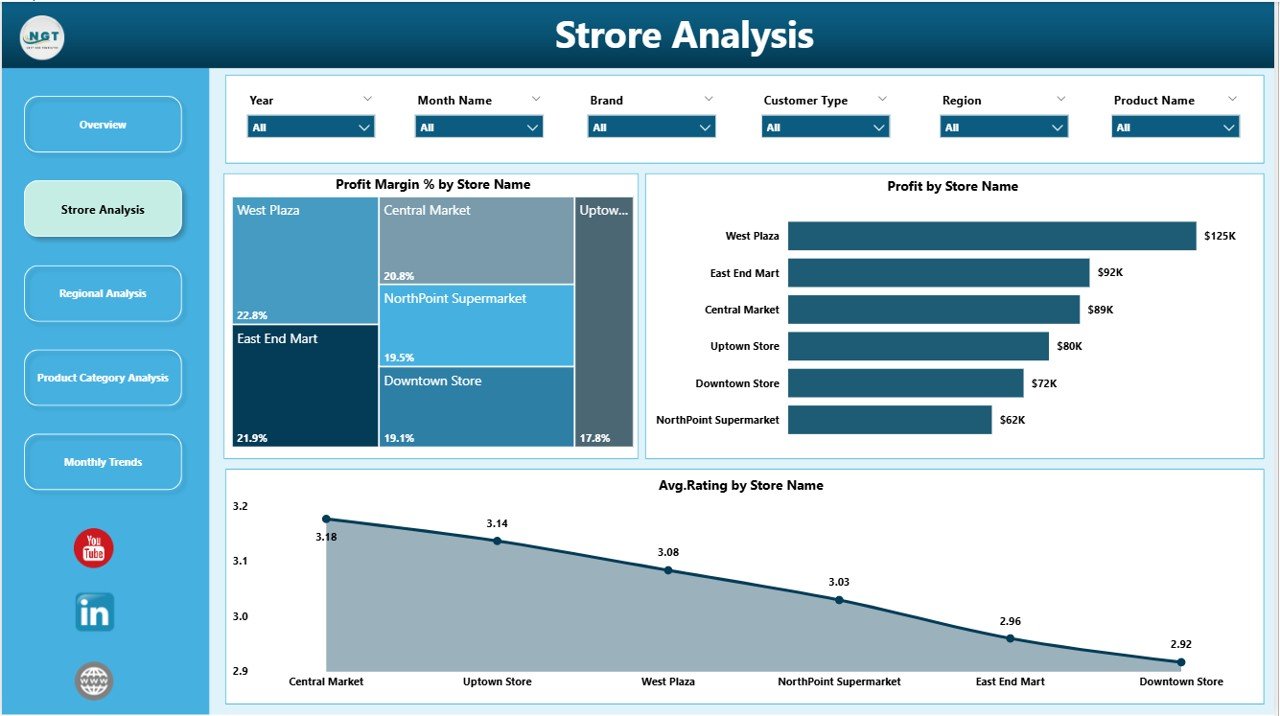
Store Analysis 🏪 – Compare store performance, analyze customer feedback, and identify high- and low-performing locations.
-
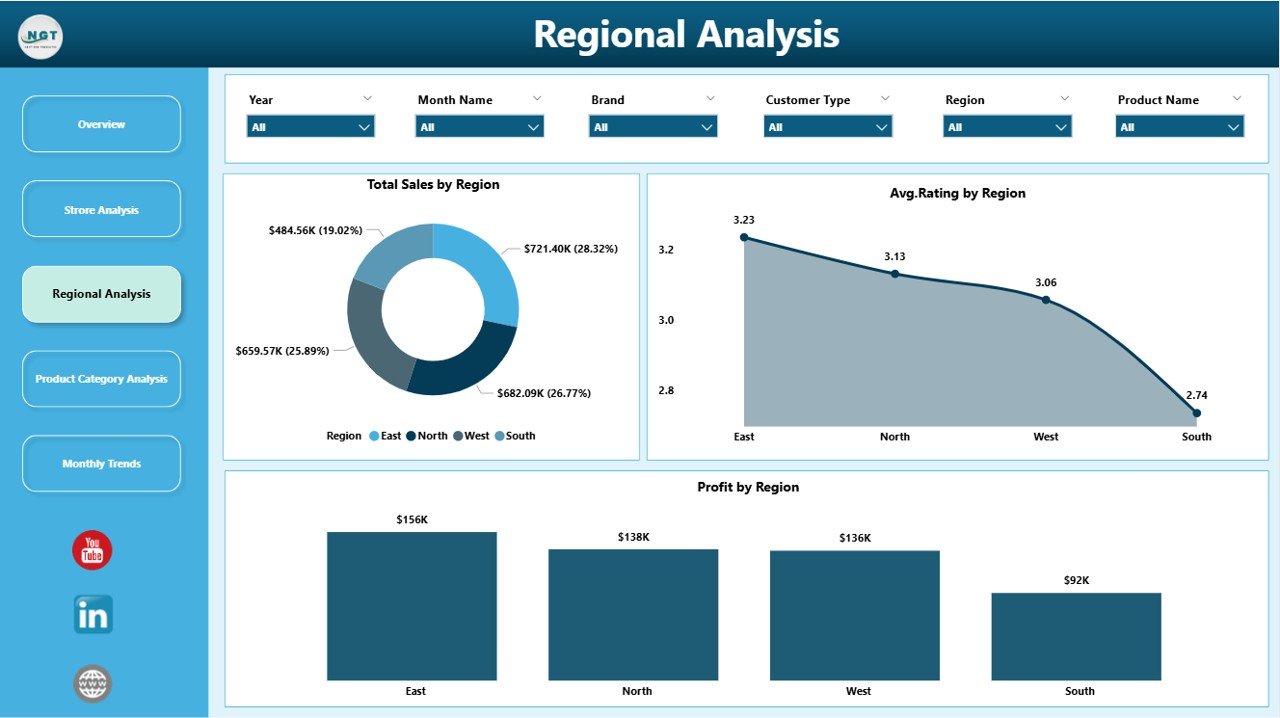
Regional Analysis 🌎 – Visualize total sales, profit, and ratings across regions to optimize marketing, inventory, and staffing.
-
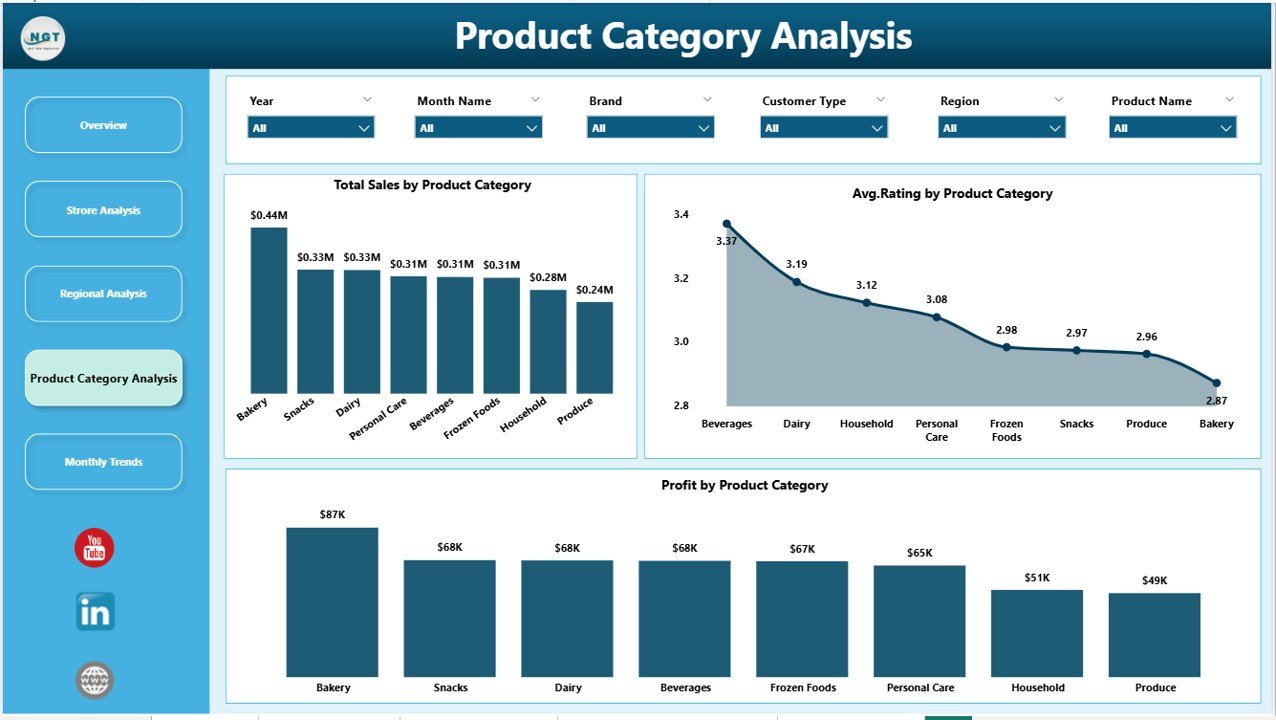
Product Category Analysis 🛍️ – Identify top-selling categories, monitor profits, and understand customer preferences.
-
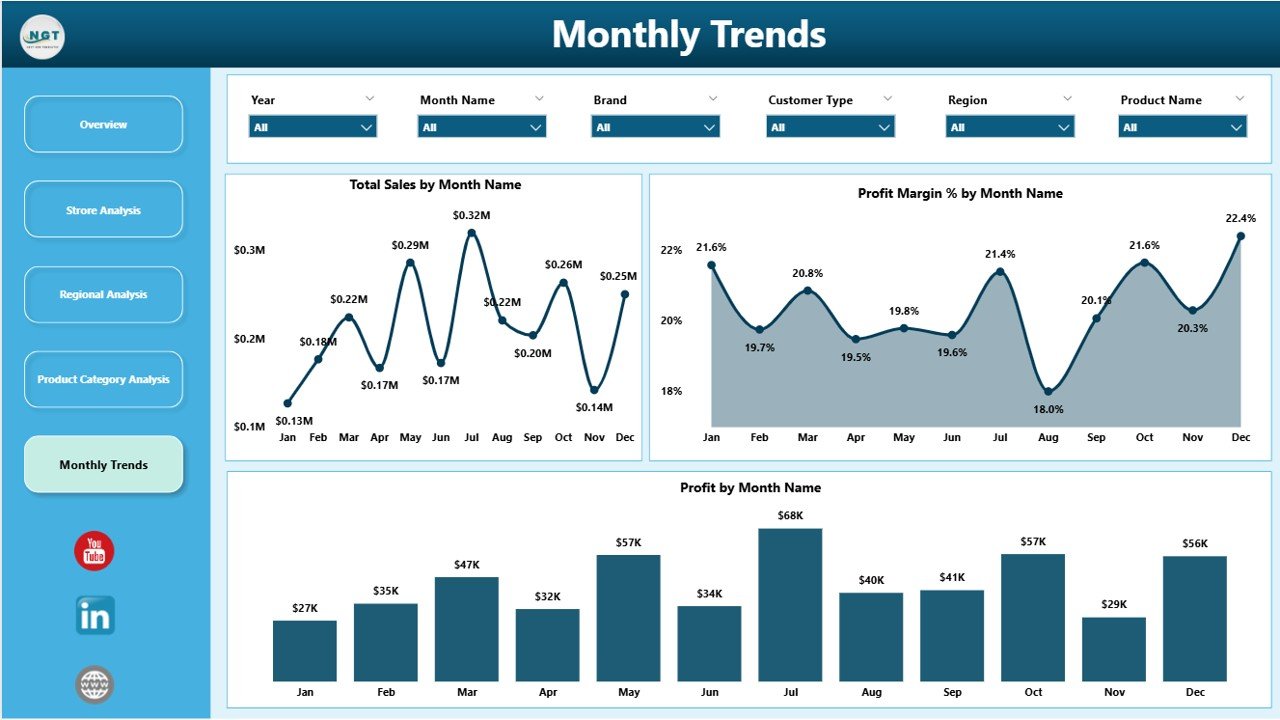
Monthly Trends 📈 – Track sales, profit, and profit margins over time to forecast future performance.
-
Real-Time Insights ⚡ – Access updated metrics instantly for faster and more accurate decision-making.
-
Interactive Visuals 🎯 – Use slicers, filters, and drill-through pages to explore your data in depth.
-
Customizable for Users ✨ – Tailor dashboards for managers, regional leaders, and executives based on their requirements.
What’s Inside the Supermarkets Dashboard
-
Overview Page – Central hub with cards and charts showing total sales, profit, profit margin %, and average ratings.
-
Store Analysis Page – Detailed analysis of each store’s performance and customer feedback trends.
-
Regional Analysis Page – Geographic insights to monitor and compare regional performance.
-
Product Category Analysis Page – Understand sales, profits, and customer ratings for product categories.
-
Monthly Trends Page – Trend charts showing seasonal performance and helping with forecasting.
How to Use the Supermarkets Dashboard
-
Connect Your Data 💻 – Link your POS, inventory, and sales databases to Power BI.
-
Update Metrics Regularly 🔄 – Ensure data reflects current sales, profit, and ratings.
-
Analyze Trends 📊 – Use slicers and filters to focus on stores, regions, or product categories.
-
Drill Down for Insights 🔍 – Click charts to explore details and uncover actionable insights.
-
Act on Insights ⚡ – Identify underperforming areas, optimize inventory, adjust promotions, and improve customer experience.
Who Can Benefit from This Supermarkets Dashboard
-
Supermarket Managers 🏪 – Monitor performance, spot trends, and improve operational efficiency.
-
Regional Leaders 🌎 – Compare stores across regions to allocate resources strategically.
-
Executives & Analysts 📈 – Make informed decisions using interactive, real-time data.
-
Retail Teams Using Power BI 💻 – Easily analyze complex data without relying on static reports.
Click here to read the Detailed blog post
Visit our YouTube channel to learn step-by-step video tutorials


Reviews
There are no reviews yet.