


Managing pension funds requires accuracy, clarity, and real-time insights. Financial decisions made today directly affect long-term stability, employee confidence, and organizational planning. That’s why pension fund managers, HR teams, and financial analysts need an interactive, error-free, and easy-to-understand monitoring system. The Pension Funds Dashboard in Power BI is designed exactly for this purpose. It converts complex financial data into meaningful visuals, making it easier to track contributions, fund values, investment risks, withdrawal trends, and monthly performance—all in one place.
With dynamic slicers, automated visuals, and structured KPI tracking, this dashboard becomes a powerful decision-support tool for organizations of all sizes. Whether you manage a single pension plan or oversee multiple funds, this dashboard provides a comprehensive view of financial health, helping you improve planning and avoid risks.
💡 Key Features of the Pension Funds Dashboard in Power BI
This dashboard is crafted to simplify pension fund monitoring using real-time analytics and clear visuals.
📌 1. Interactive Slicers for Instant Filtering

Filter insights by year, month, plan type, investment type, gender, or fund name. With just a few clicks, you can dig into the exact segment you want to analyze.
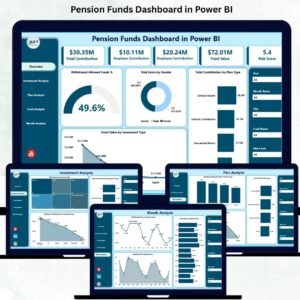
💰 2. Essential KPI Cards on the Overview Page
You get instant visibility into crucial metrics:
-
Total Contribution
-
Fund Value
-
Withdrawal Allowed Funds %
-
Risk Score
These KPIs show the financial status of pension funds at a glance.
📊 3. Four Powerful Overview Charts
The dashboard displays:
-
Withdrawal Allowed Funds %
-
Risk Score by Gender
-
Total Contribution by Plan Type
-
Fund Value by Investment Type
These visuals make comparisons simple and accurate.
📈 4. Detailed Investment Analysis
Understand how each investment type performs across contribution trends, employee choices, and risk distribution.
📁 5. Plan & Fund Analysis Pages
Track fund value, contribution volume, and withdrawal percentage—sorted by plan type or fund name.
📅 6. Monthly Trends for Long-Term Planning
Monitor shifts over time using charts for:
-
Total Contribution by Month
-
Fund Value by Month
-
Withdrawal Allowed Funds % by Month
These insights help organizations plan budgets more effectively.
🧩 7. Beginner-Friendly & Fully Customizable
You can modify colors, visuals, slicers, and data sources based on organizational needs—making it suitable for any size team.
📂 What’s Inside the Pension Funds Dashboard in Power BI
This dashboard is built on top of structured data sheets, ensuring smooth Power BI integration.
📄 1. Input_Actual Sheet
Enter updated contribution figures, fund values, and withdrawal percentages every month. Just refresh Power BI to update all visuals instantly.
🎯 2. Input_Target Sheet
Track your planned contribution and fund value targets for each period. This makes goal tracking easy and transparent.
📘 3. KPI Definition Sheet
Includes:
-
KPI Name
-
Fund Type
-
Plan Category
-
KPI Formula
-
KPI Definition
-
KPI Type (UTB/LTB)
This sheet helps maintain standard KPI understanding across the organization.
🛠️ How to Use the Pension Funds Dashboard in Power BI
Using this dashboard is simple and efficient—even for beginners.
1️⃣ Update Monthly Data
Fill in the Input_Actual sheet with this month’s numbers and refresh Power BI.
2️⃣ Explore the Overview Page
Use slicers to filter by gender, plan type, investment type, or fund name.
3️⃣ Analyze Investments
Check which investments carry more risk and which receive higher contributions.
4️⃣ Review Plan & Fund Performance
Understand which plans attract employees and how each fund performs financially.
5️⃣ Track Long-Term Trends
Use the Monthly Trends page to compare month-over-month variations.
6️⃣ Share Insights Easily
Export charts or screenshots for audit, compliance, review meetings, or financial reports.
👥 Who Can Benefit from This Pension Funds Dashboard in Power BI
This dashboard is the perfect tool for:
🏦 Pension Fund Managers
Gain a complete view of fund health and investment patterns.
👨💼 HR & Payroll Teams
Track employee contributions and fund value behavior quickly.
📊 Financial Analysts
Study performance trends and identify financial risks.
🏛️ Government or Retirement Fund Agencies
Manage contributions, withdrawals, and long-term fund planning with clarity.
🧮 Auditors & Compliance Teams
Verify financial transparency using clean, organized visuals.
🏢 Large Organizations
Handle thousands of employees’ fund data without errors or delays.
### Click here to read the Detailed blog post
Visit our YouTube channel to learn step-by-step video tutorials
👉 Youtube.com/@PKAnExcelExpert


Reviews
There are no reviews yet.