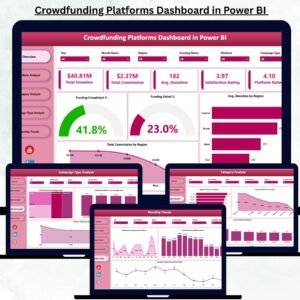
Crowdfunding has become one of the most powerful ways to raise funds in the digital era. From creative projects to social causes, entrepreneurs, non-profits, and innovators rely heavily on online platforms. But the real success of crowdfunding doesn’t depend only on compelling stories — it depends on analyzing data, understanding donor behavior, and making informed decisions. Crowdfunding Platforms Dashboard in Power BI That’s exactly where the Crowdfunding Platforms Dashboard in Power BI becomes a game-changer.
Crowdfunding Platforms Dashboard in Power BI This dashboard transforms raw donation and campaign data into meaningful insights using automated visuals, KPI cards, slicers, and dynamic charts. Crowdfunding Platforms Dashboard in Power BI Whether you run a crowdfunding company, manage fundraising campaigns, or analyze donor trends, this dashboard gives you complete clarity in seconds. Crowdfunding Platforms Dashboard in Power BI, it helps you measure funding success, track commissions, evaluate campaign categories, study regional performance, and analyze monthly behaviors.
Let’s explore everything you get inside this powerful analytics solution 👇
✨ Key Features of the Crowdfunding Platforms Dashboard in Power BI
📊 1. Five Fully Interactive Pages
Includes Overview, Platform Analysis, Category Analysis, Campaign Type Analysis, and Monthly Trends — offering deep insights into donation behavior and campaign success.
💳 2. KPI Cards for Instant Decision-Making
Track core metrics such as Funding Completed %, Funding Failed %, Average Donation, Total Donations, and Total Commission.
🌍 3. Region-Wise Insights
Understand donor patterns, regional commission earnings, and average donation behavior across different locations.
🧭 4. Smart Slicers for Quick Filtering
Filter data by platform, category, campaign type, region, or month — and every visual updates instantly.
📈 5. Automated Trend Analysis
Month-wise visuals for satisfaction, donation amounts, and completion percentages help predict fundraising cycles.
🏷️ 6. Category-Level Breakdown
Get clear insights into which campaign categories deliver the best results — charity, education, technology, health, social causes, and more.
⭐ 7. Easy to Use, Even for Beginners
No advanced technical skills needed — built using simple, intuitive Power BI visuals.
📦 What’s Inside the Crowdfunding Platforms Dashboard in Power BI
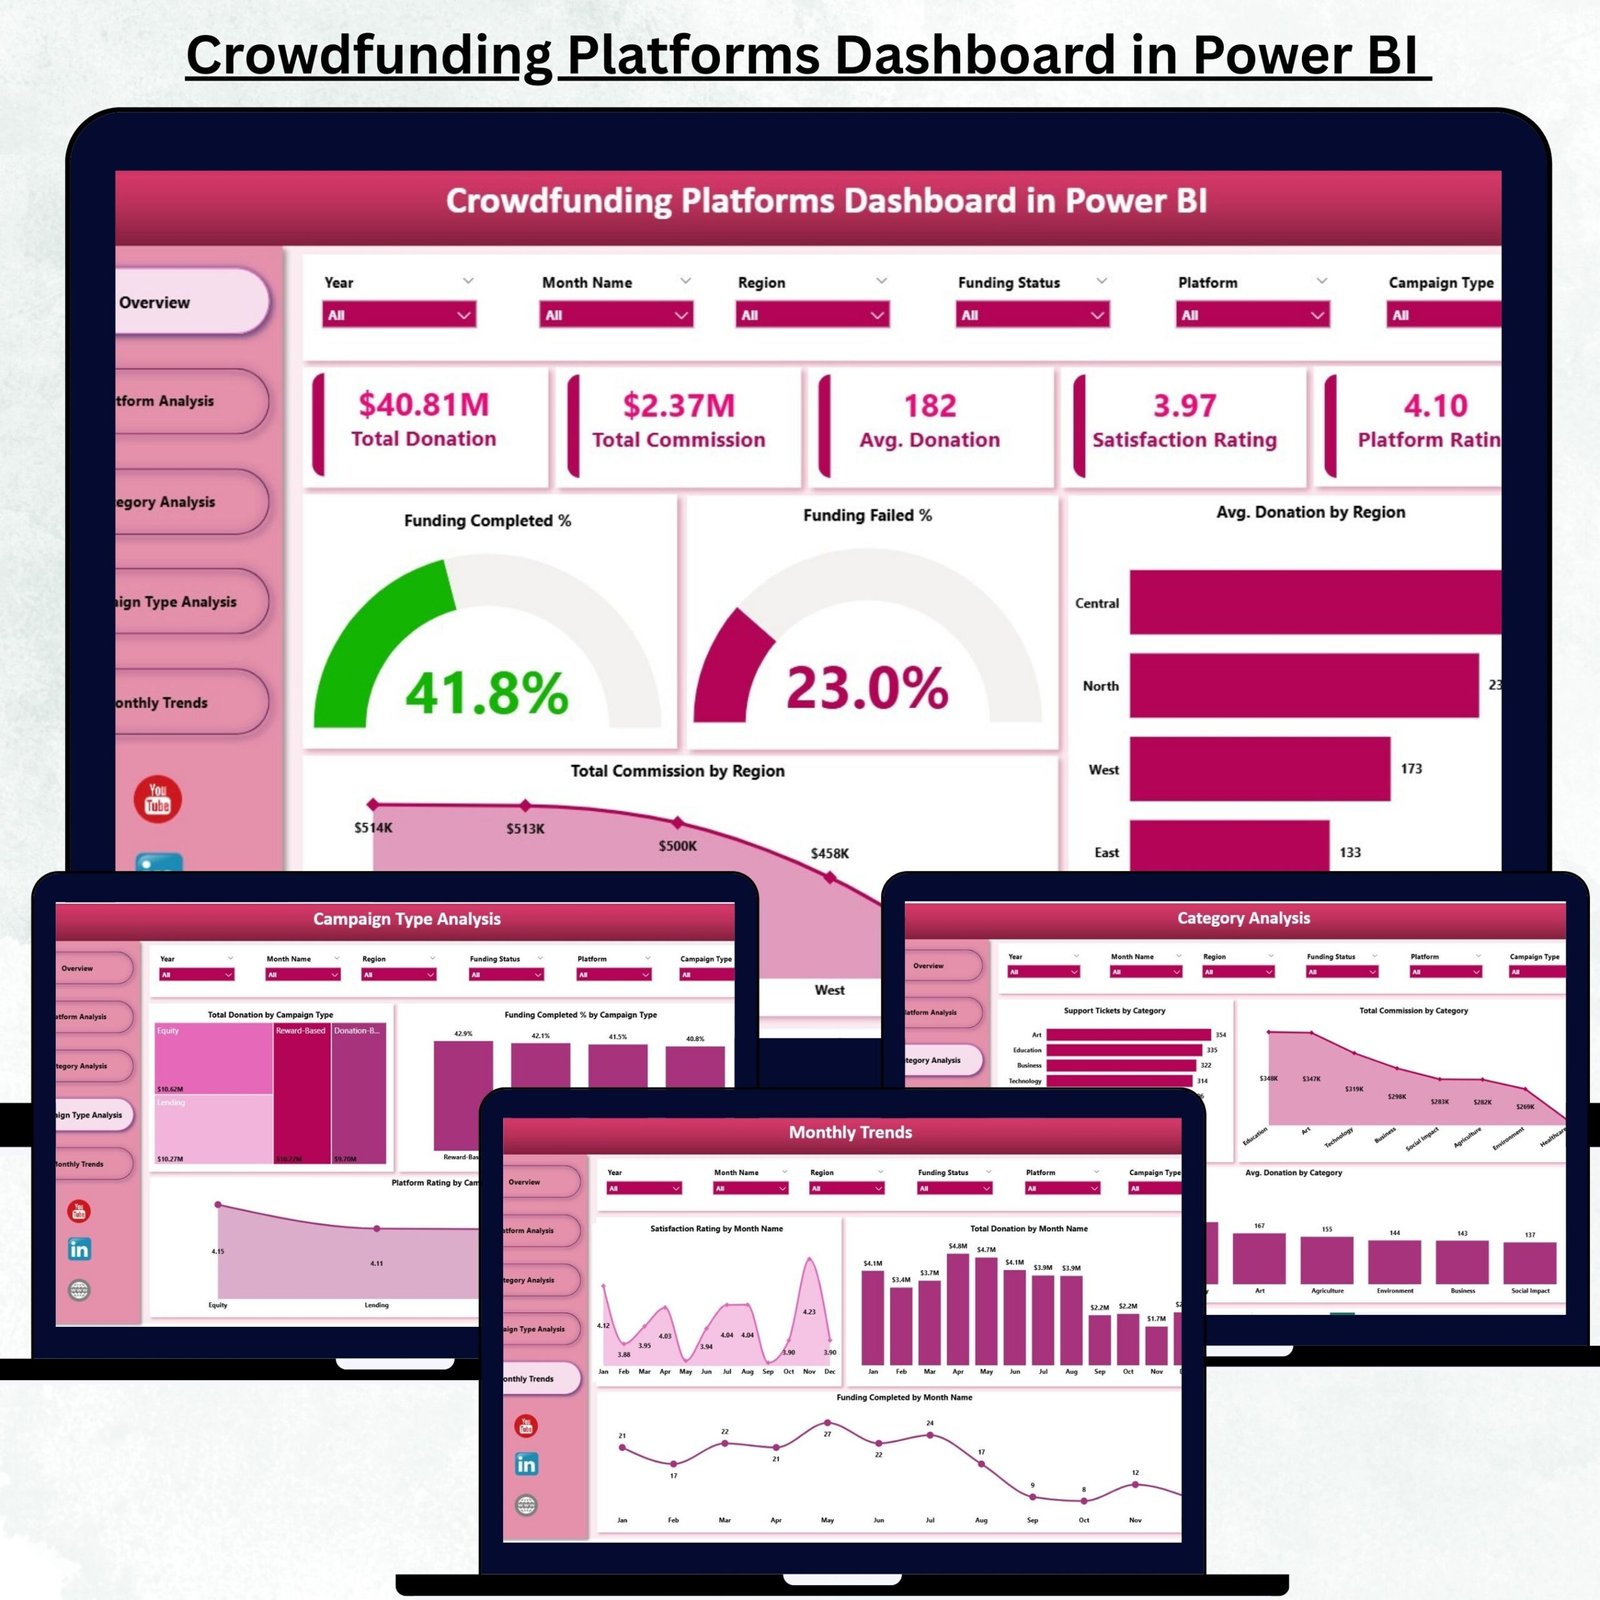
🏠 1. Overview Page – The Main Summary Dashboard
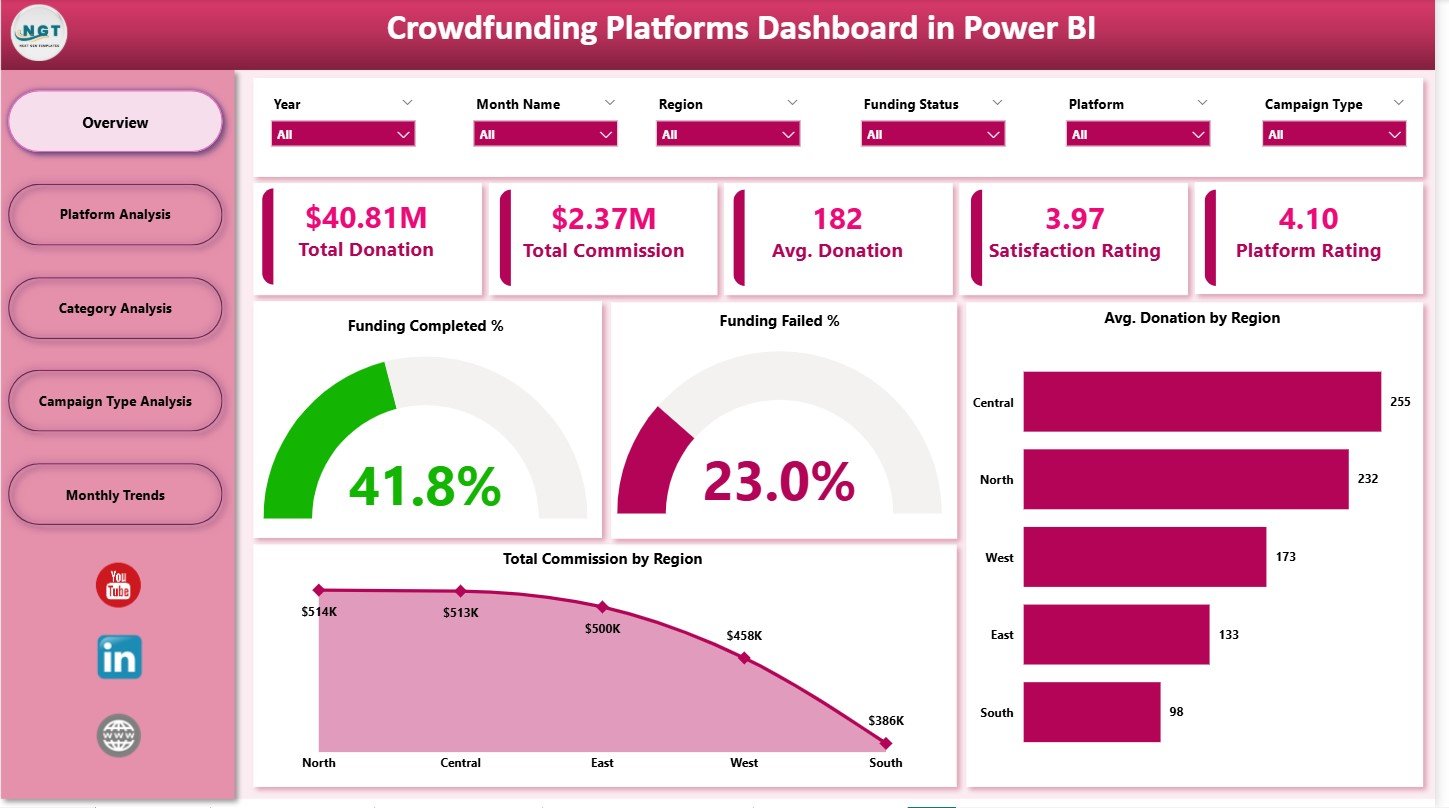
This page gives you a full performance snapshot using slicers, KPI cards, and charts.
⭐ KPI Cards:
-
Funding Completed %
-
Funding Failed %
-
Average Donation
-
Total Donation
-
Total Commission
These numbers help you quickly assess platform health.
⭐ Key Charts:
-
Funding Completed %
-
Funding Failed %
-
Average Donation by Region
-
Total Commission by Region
These insights help identify high-donation regions, fundraising gaps, and success drivers.
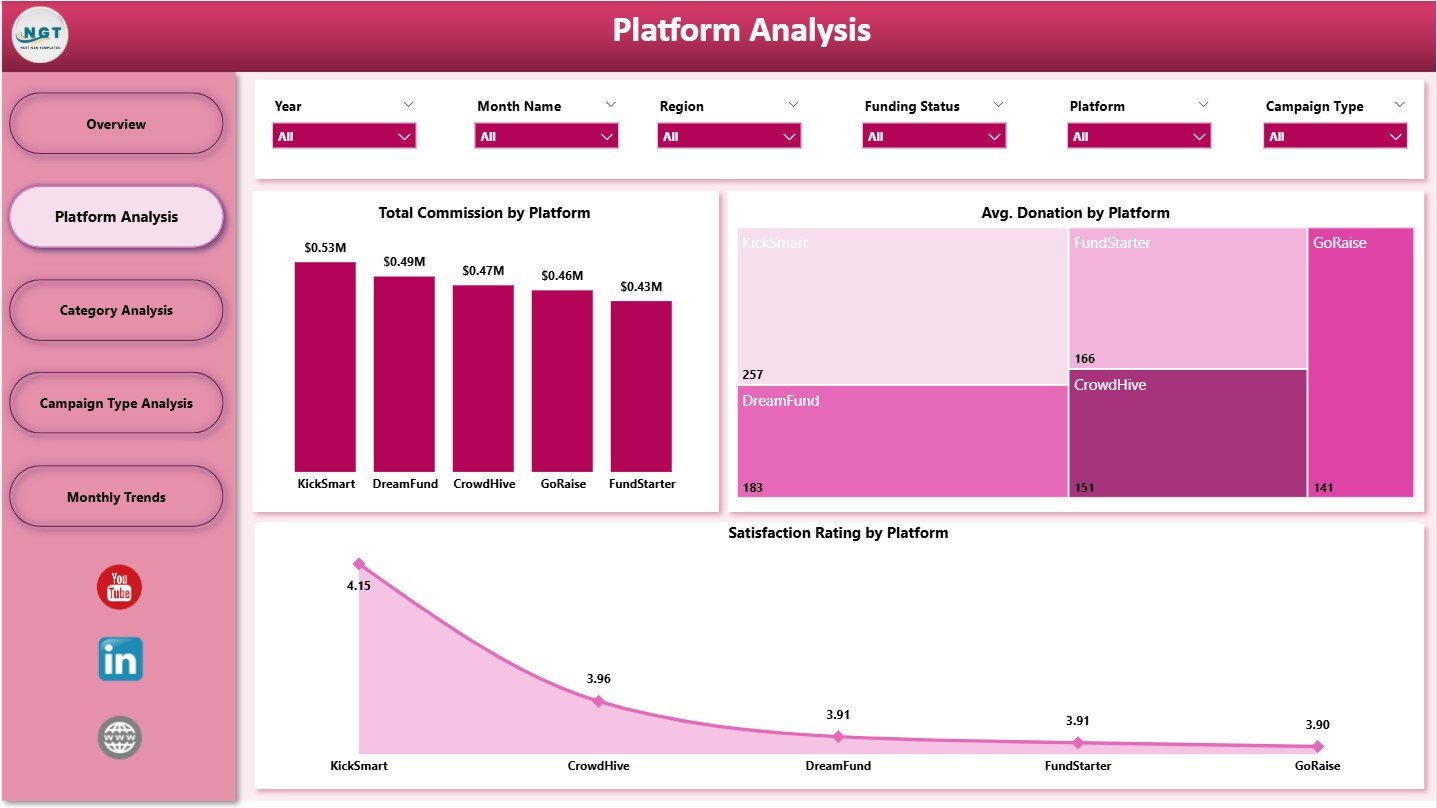
📈 2. Platform Analysis Page – Track Platform-Wise Performance
This page focuses purely on platform-level KPIs.
📊 Charts Include:
-
Total Commission by Platform
-
Average Donation by Platform
-
Satisfaction Rating by Platform
These visuals reveal which crowdfunding platforms perform best and which need improvement.
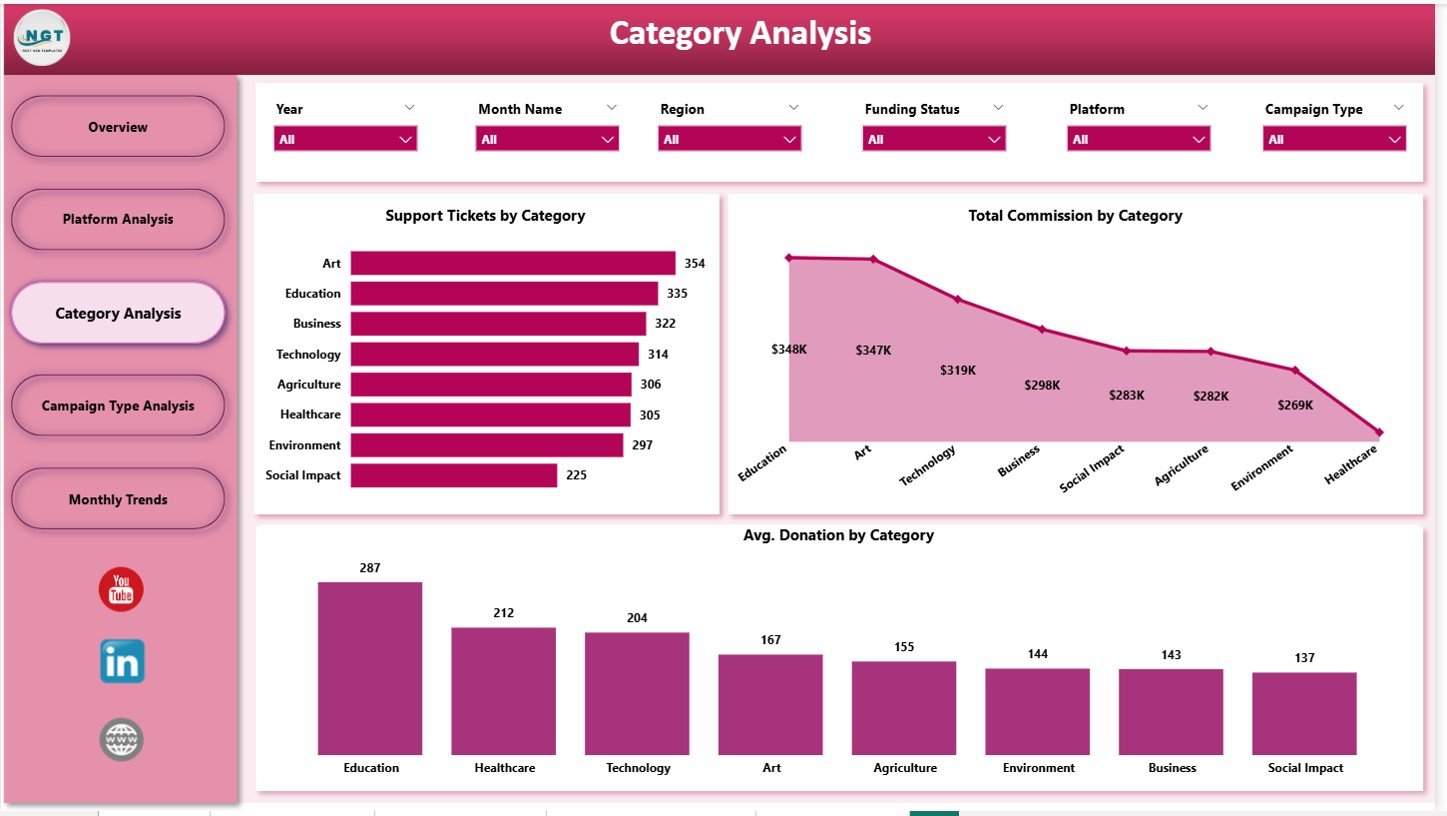
🏷️ 3. Category Analysis Page – Understand Category-Wise Results
This page helps you analyze campaign performance across categories.
📊 Charts Include:
-
Support Tickets by Category
-
Total Commission by Category
-
Average Donation by Category
These insights help identify high-value segments and categories with customer issues.
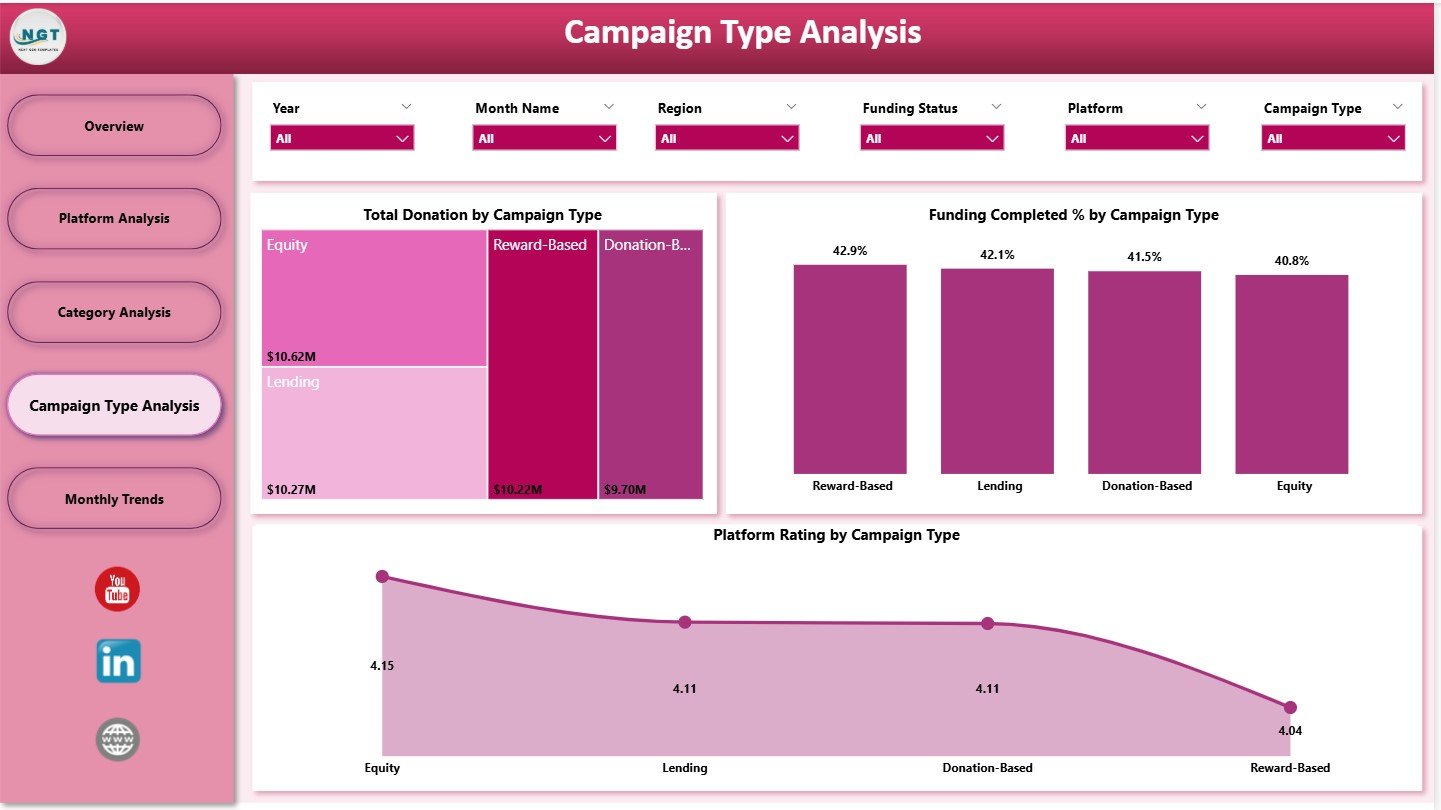
🪙 4. Campaign Type Analysis Page – Compare Campaign Styles
Every crowdfunding campaign follows a style, such as:
-
All-or-Nothing
-
Keep-it-All
-
Donation-based
-
Reward-based
-
Equity crowdfunding
📊 Here’s what this page shows:
-
Total Donation by Campaign Type
-
Funding Completed % by Campaign Type
-
Platform Rating by Campaign Type
These insights help improve campaign planning, marketing strategies, and user experience.
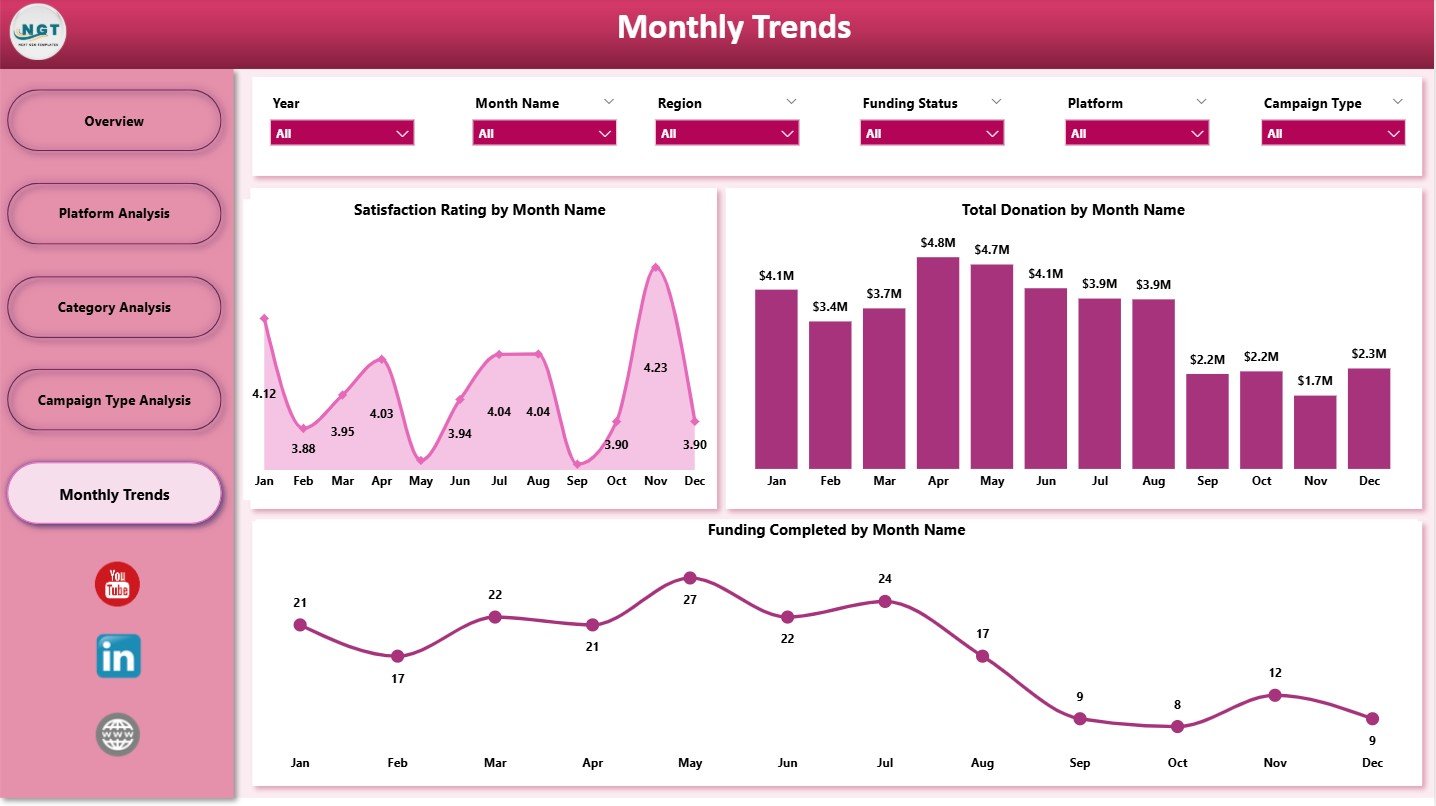
📅 5. Monthly Trends Page – Identify Seasonal Fundraising Patterns
This page delivers powerful month-wise analytics.
📈 Charts Include:
-
Satisfaction Rating by Month
-
Total Donation by Month
-
Funding Completed % by Month
These visuals help plan campaigns, allocate budgets, and improve monthly performance.
🎯 How to Use the Crowdfunding Dashboard Effectively
🔹 Step 1: Load your dataset into Power BI
🔹 Step 2: Use slicers to explore platform, category, region, and campaign types
🔹 Step 3: Study KPI cards for instant clarity
🔹 Step 4: Use monthly trends to identify fundraising seasons
🔹 Step 5: Compare platforms and categories for better strategy
🔹 Step 6: Monitor satisfaction ratings to improve donor experience
👥 Who Can Benefit from This Dashboard?
🏢 Crowdfunding Platforms
Track platform performance, donor activity, and commissions.
💡 Campaign Managers
Understand campaign success patterns and donor interactions.
💼 Marketing & Strategy Teams
Target high-donation regions and optimize promotional efforts.
📊 Data Analysts
Use automated visuals to present clear reports.
🎯 Founders & Decision-Makers
Get complete visibility on revenue, success rates, and trends.


Reviews
There are no reviews yet.