
Managing music performances, rehearsals, cultural shows, and creative programs requires strong coordination and constant performance tracking. When data sits across multiple files, teams struggle to monitor progress, understand trends, and make the right decisions. That’s why top-performing music academies, theatre groups, orchestras, and event management teams now rely on smart reporting tools.Music & Performing Arts KPI Dashboard in Power BI
Introducing the Music & Performing Arts KPI Dashboard in Power BI — a powerful and ready-to-use analytics solution designed to help you track your KPIs with clarity, accuracy, and speed. Whether you want to evaluate artist performance, rehearsal productivity, show ratings, or operational efficiency, this dashboard brings everything into one clean interactive report.
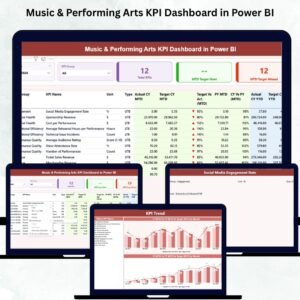
This dashboard makes your performance management simple and visual. You can instantly check month-to-date (MTD) and year-to-date (YTD) results, compare current numbers with previous year (PY), drill through to KPI definitions, and review detailed trends for every metric. It is built for institutions that want to make data-driven decisions and elevate the quality of every performance.
✨ Key Features of the Music & Performing Arts KPI Dashboard in Power BI
This dashboard includes intelligent visuals, filters, and drill-through pages that help you understand your performance from multiple angles.Music & Performing Arts KPI Dashboard in Power BI
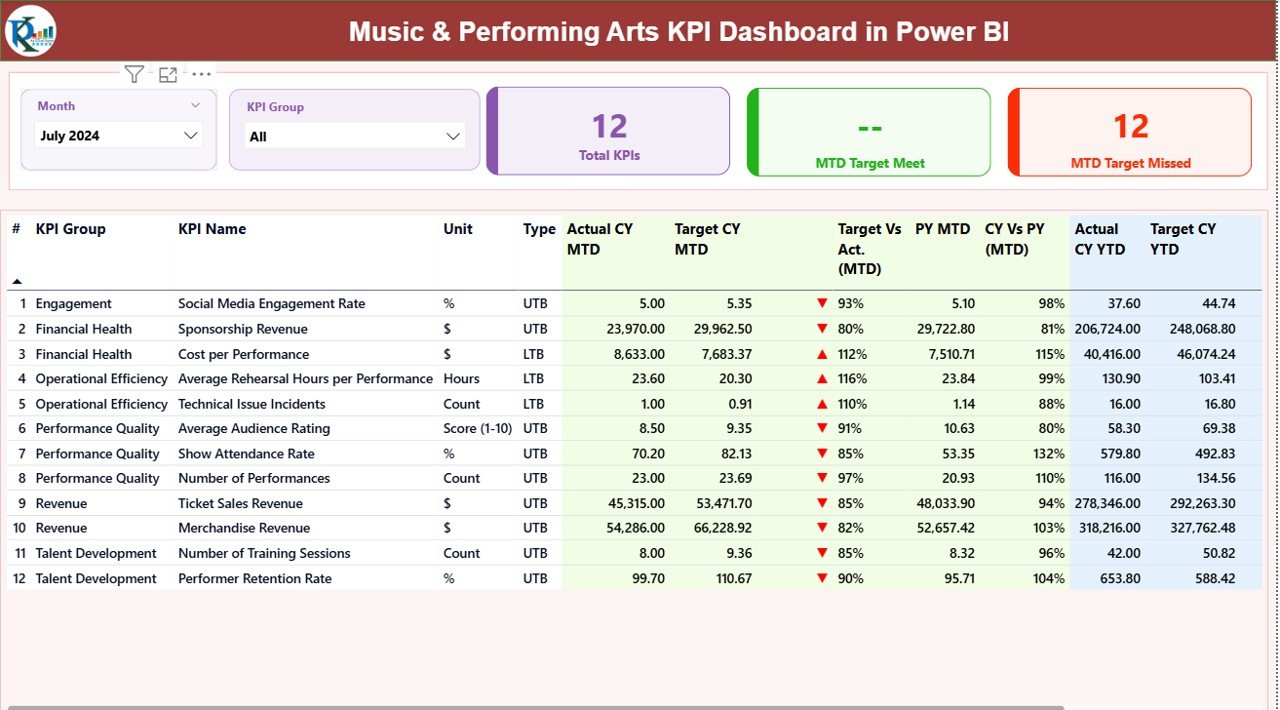
🎭 Summary Page – Complete Performance Overview
The Summary Page gives a bird’s-eye view of your institution’s KPI performance.
You get:
-
🔹 Three insight cards: Total KPIs, MTD Target Met, MTD Target Missed
-
🔹 Month & KPI Group slicers to filter the entire dashboard
-
🔹 A detailed KPI table showing KPI Group, KPI Name, Actual CY MTD, Targets, Status Icons, PY comparisons, YTD insights, and performance trends.Music & Performing Arts KPI Dashboard in Power BI
This page instantly highlights what’s performing well and what needs improvement.
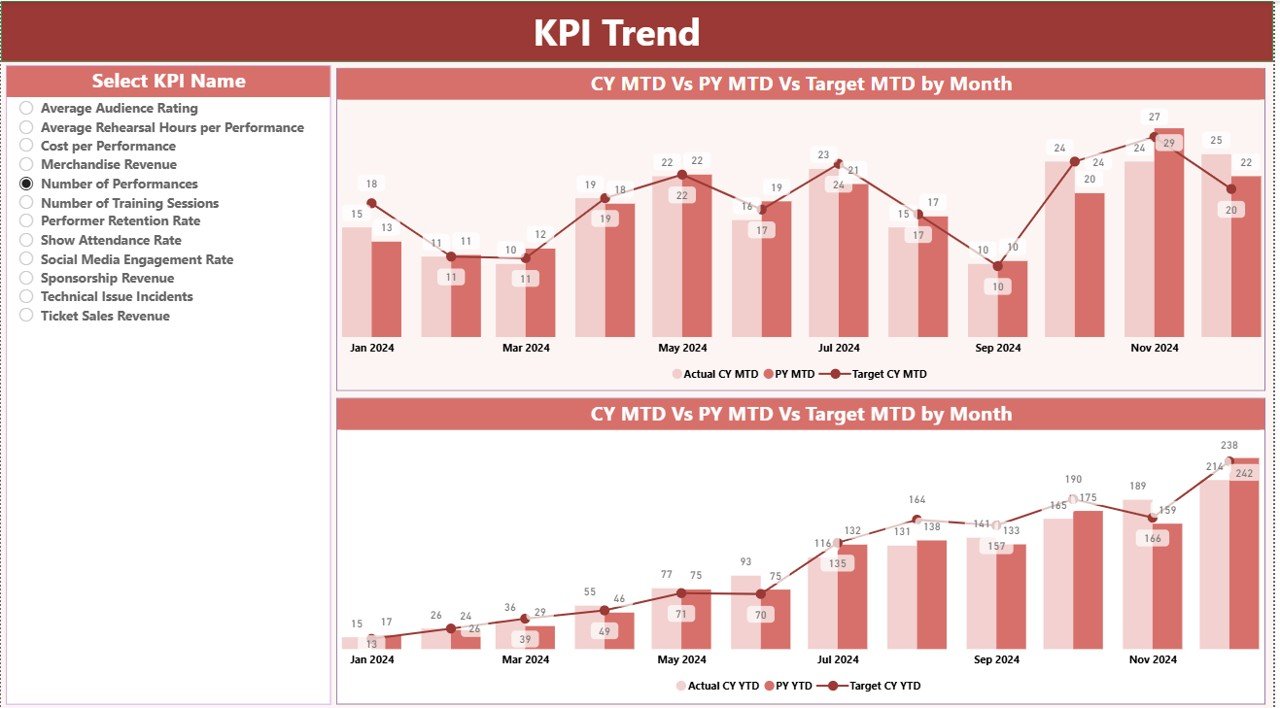
📊 KPI Trend Page – Deep Visual Trends
This page helps you explore monthly patterns for each KPI.
It includes:
-
📈 CY MTD, PY MTD & MTD Target trends
-
📉 CY YTD, PY YTD & YTD Target trends
You can quickly identify growth, challenges, and seasonal behavior.
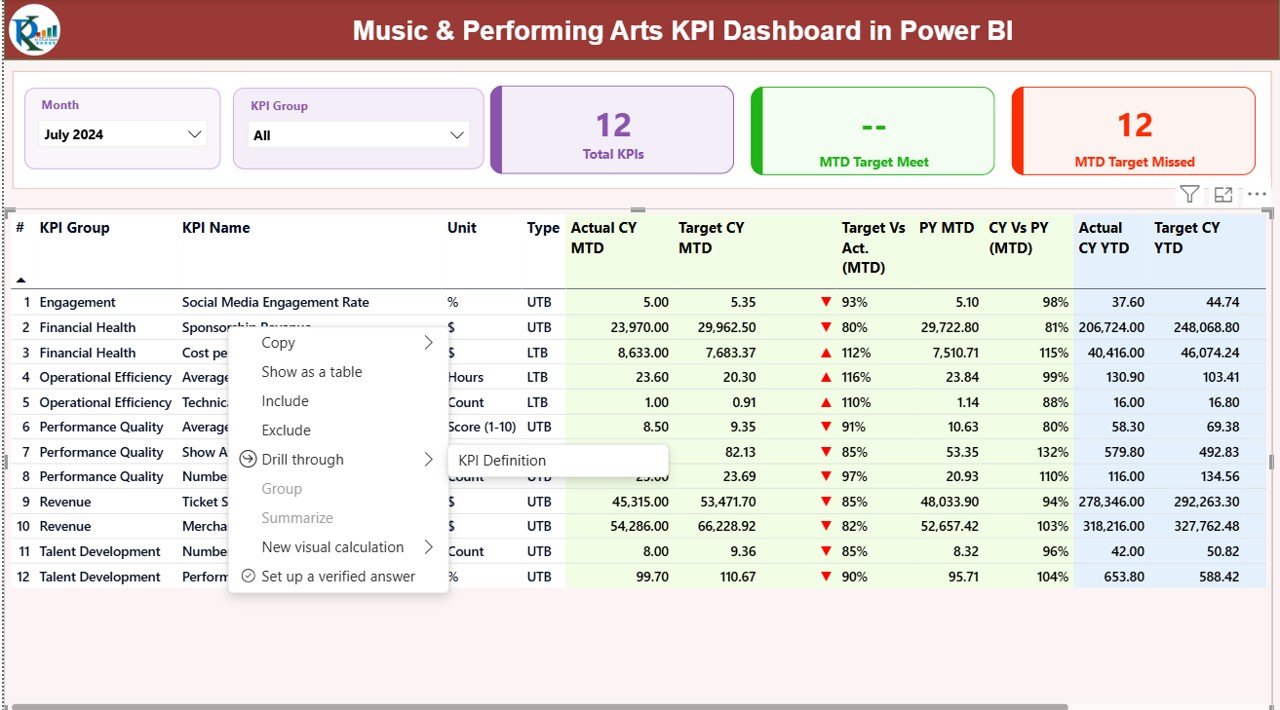
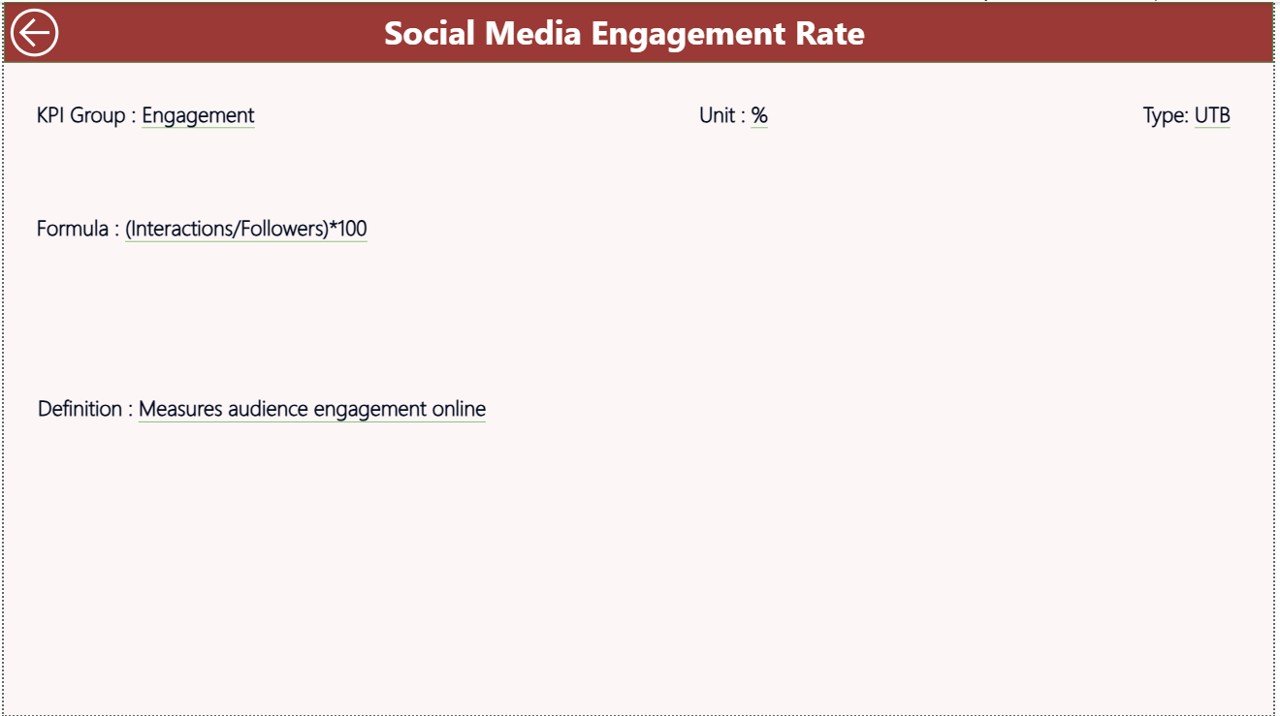
📘 KPI Definition Page – Drill-Through for Clarity
This hidden page opens when you right-click any KPI on the Summary Page.
It shows:
-
KPI Group
-
Formula
-
Definition
-
Type (LTB or UTB)
Perfect for helping new users understand every KPI in detail.
📦 What’s Inside the Music & Performing Arts KPI Dashboard
Here’s what you get when you download this digital product:Music & Performing Arts KPI Dashboard in Power BI
-
✔️ Power BI File (.PBIX)
-
✔️ Excel Data Source with 3 structured sheets
-
✔️ KPI Definition sheet (editable)
-
✔️ Input Actuals sheet
-
✔️ Input Targets sheet
-
✔️ Fully interactive dashboard pages
-
✔️ Drill-through functionality
-
✔️ Easy-to-edit visual layout
-
✔️ Ready to use from day one
All you need to do is enter your monthly data—Power BI will update everything automatically.
🛠️ How to Use the Music & Performing Arts KPI Dashboard
Follow these simple steps to get the best results:
-
Fill the Excel file
-
Add your MTD & YTD Actuals
-
Enter your targets
-
Update KPI definitions
-
-
Open the Power BI dashboard
It will automatically refresh with your data.Music & Performing Arts KPI Dashboard in Power BI -
Use the slicers
Choose the Month & KPI Group to filter the dashboard. -
Analyze KPI performance
Review the table, check status icons, and compare CY vs PY. -
Check trends
Open the KPI Trend Page to understand long-term performance movement. -
Drill through for clarity
Right-click on any KPI to open its formula and definition.
This dashboard requires zero technical expertise — anyone can use it easily.
🎯 Who Can Benefit from This Dashboard?
This dashboard is ideal for:
-
🎼 Music academies & conservatories
-
🎭 Performing arts schools & theatre groups
-
🎟️ Event organizers & production houses
-
🎤 Artist training & development centers
-
🥁 Orchestra groups & cultural institutions
-
📚 Creative education programs
-
📊 Performance managers & operations teams
If your organization tracks performance, attendance, quality, revenue, or operational KPIs — this dashboard will transform the way you measure success.
### Click here to read the detailed blog post
Watch the step-by-step video tutorial:


Reviews
There are no reviews yet.