
Pop-up stores are one of the most disruptive and fast-growing trends in modern retail. Brands use them to test new markets, launch products, create memorable customer experiences, and generate quick profits—all without long-term commitments or high operational costs. But managing multiple pop-up stores becomes extremely challenging when data is scattered across spreadsheets. Tracking sales, profit, promotions, staff allocation, category performance, and city-wise outcomes manually leads to confusion and slow decision-making.
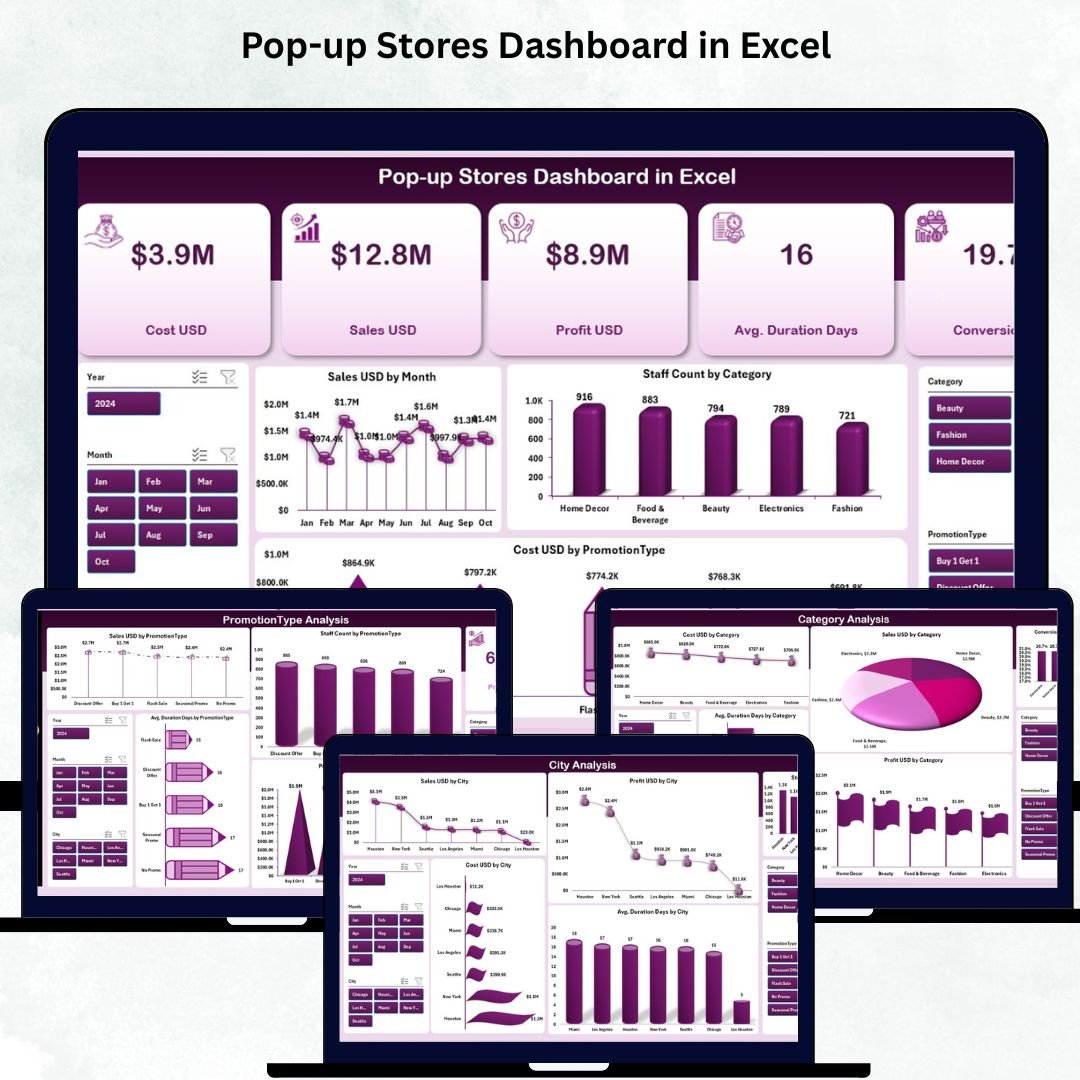
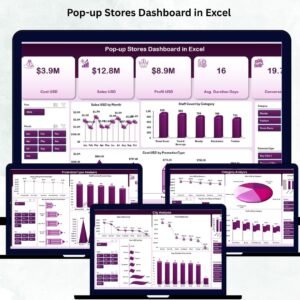
The Pop-up Stores Dashboard in Excel solves this problem instantly. This ready-to-use dashboard brings all pop-up store insights into one interactive and visually dynamic Excel file. It transforms raw data into meaningful charts, KPI cards, slicers, trend reports, and automated comparisons—helping retail teams make faster, smarter, and more confident decisions.
Designed for brand managers, marketing teams, retail leaders, and event coordinators, this dashboard offers a complete 360° view of pop-up store performance. Whether you are tracking city-level sales, promotion effectiveness, staff allocation, category performance, or seasonal demand—this dashboard gives clarity in seconds and empowers your team to scale pop-up operations with confidence.
🚀 Key Features of the Pop-up Stores Dashboard in Excel
This dashboard is packed with powerful features that simplify retail reporting and improve decision-making:
📊 ✔ Real-Time Sales & Profit Insights
Monitor total sales, profit, conversion rates, and promotion costs with auto-updating visuals.
🌆 ✔ City-Wise Performance Tracking
Compare revenue, profit, duration, staffing, and expenses across all cities where pop-ups run.
🛒 ✔ Category Analysis for Smarter Product Decisions
Track sales, conversion rates, costs, profit, and duration across product or service categories.
🎯 ✔ Promotion Type Effectiveness
Evaluate which promotions—BOGO, discounts, free samples, or social campaigns—deliver the highest ROI.
📅 ✔ Month-Wise Trend Analysis
Understand seasonal performance patterns through revenue, cost, staff count, duration, and conversion trends.
🧭 ✔ Page Navigator for Easy Navigation
A left-side Page Navigator lets users switch between sheets instantly ideal for non-technical users.
⚡ ✔ Excel-Driven & Fully Customizable
Update the Data Sheet, and all visuals refresh automatically. Add KPIs, modify charts, or adjust designs easily.
📦 What’s Inside the Pop-up Stores Dashboard in Excel
Your purchase includes a professionally structured dashboard with 5 main analytical pages:
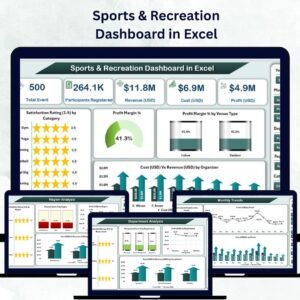
⭐ 1. Overview Page – Complete Pop-up Store Summary
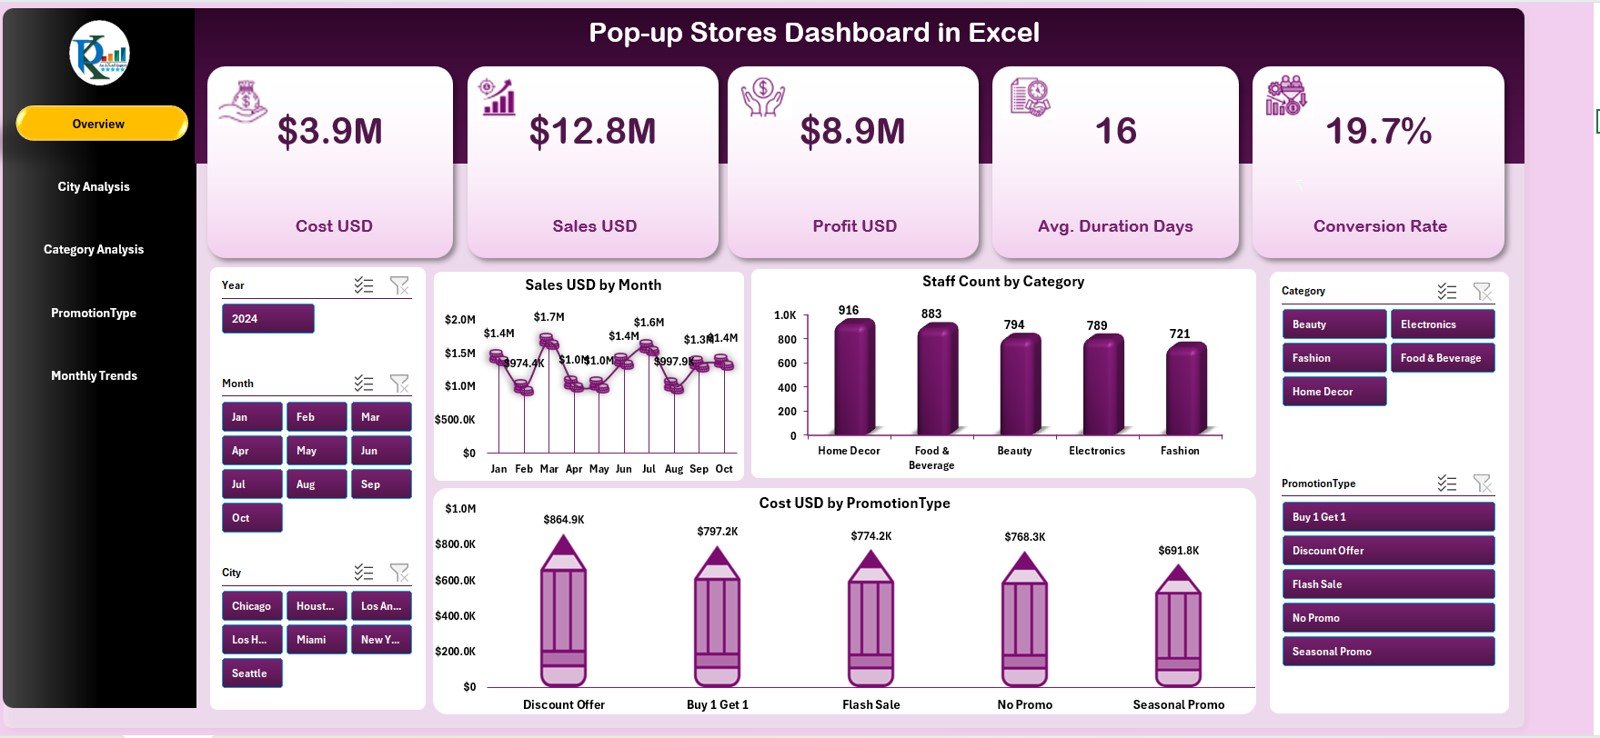
This is your main performance page, featuring:
✔ 5 KPI Cards: Total Sales, Total Profit, Staff Count, Promotion Cost, and Conversion Rate
✔ Sales by Month – Identify high-performing months
✔ Staff Count by Category – Manage staffing balance
✔ Cost by Promotion Type – Review budget allocation
This page is perfect for leadership updates and daily decision-making.
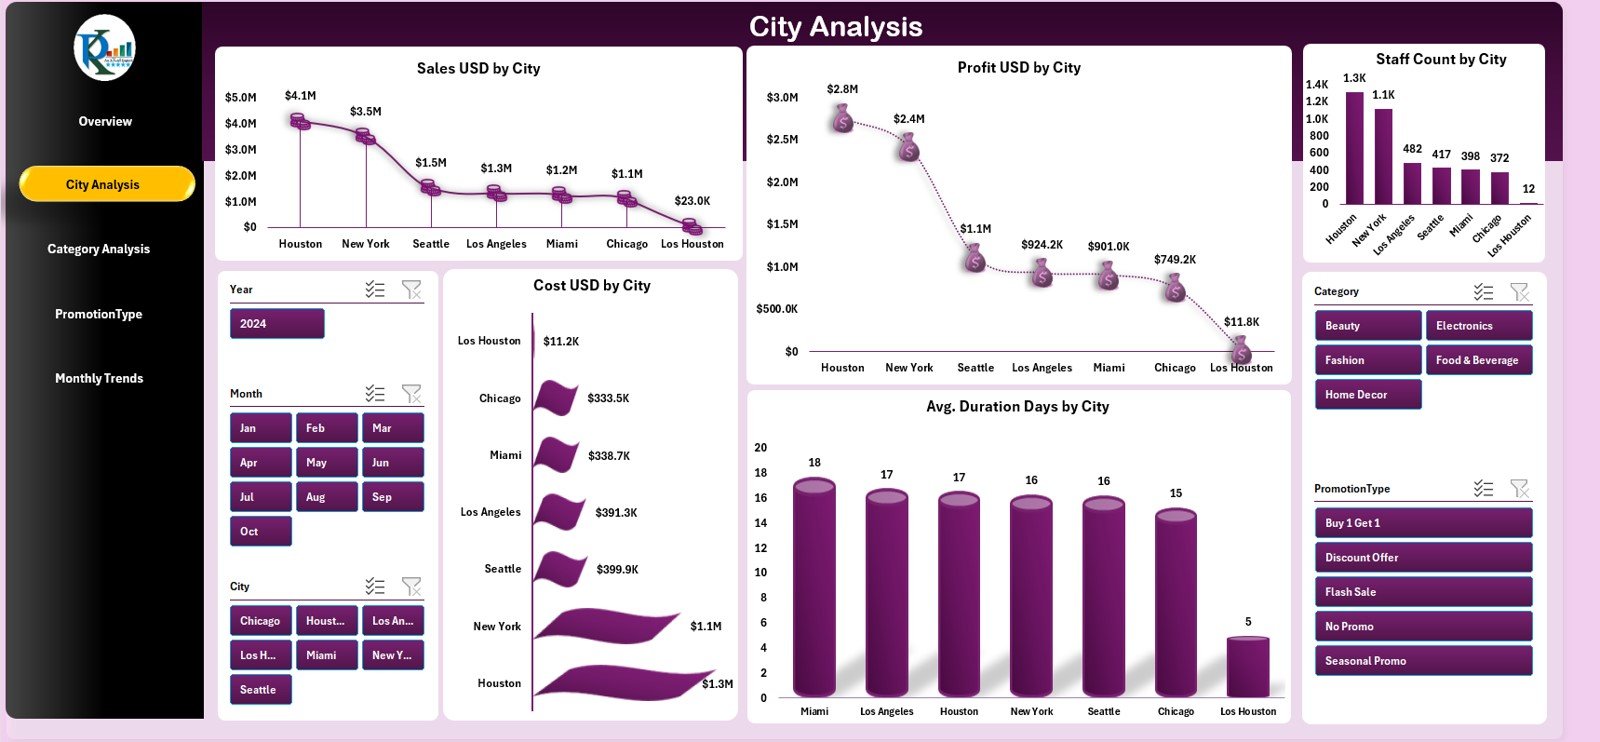
⭐ 2. City Analysis Page
Evaluate performance across different store locations:
✔ Sales by City
✔ Profit by City
✔ Staff Count by City
✔ Cost by City
✔ Average Duration by City
These insights help you determine the best cities for future pop-ups and optimize resource allocation.
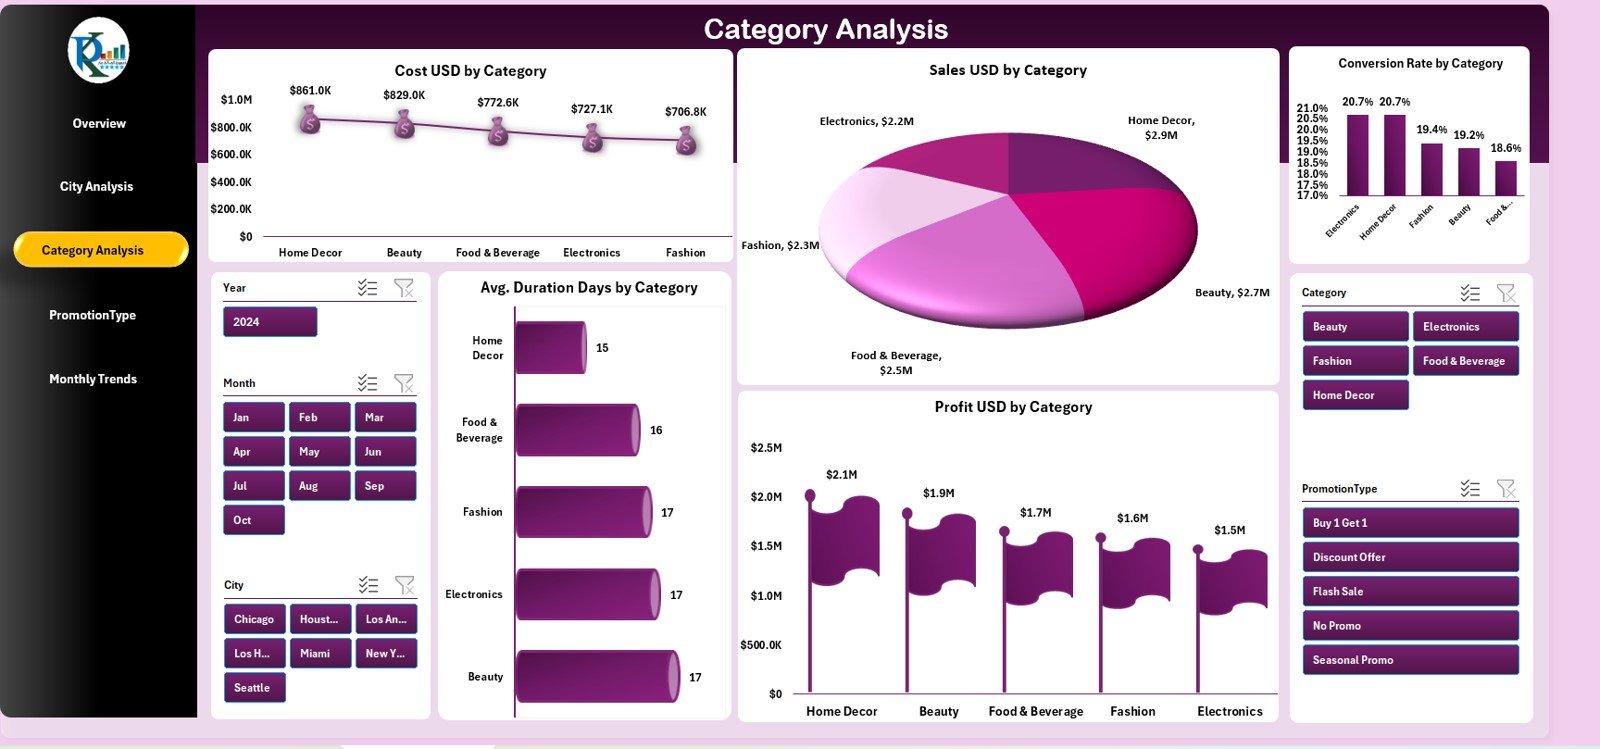
⭐ 3. Category Analysis Page
Compare product or service categories in detail:
✔ Cost by Category
✔ Sales by Category
✔ Conversion Rate by Category
✔ Avg. Duration by Category
✔ Profit by Category
Use this page to refine product strategies and expand high-performing categories.
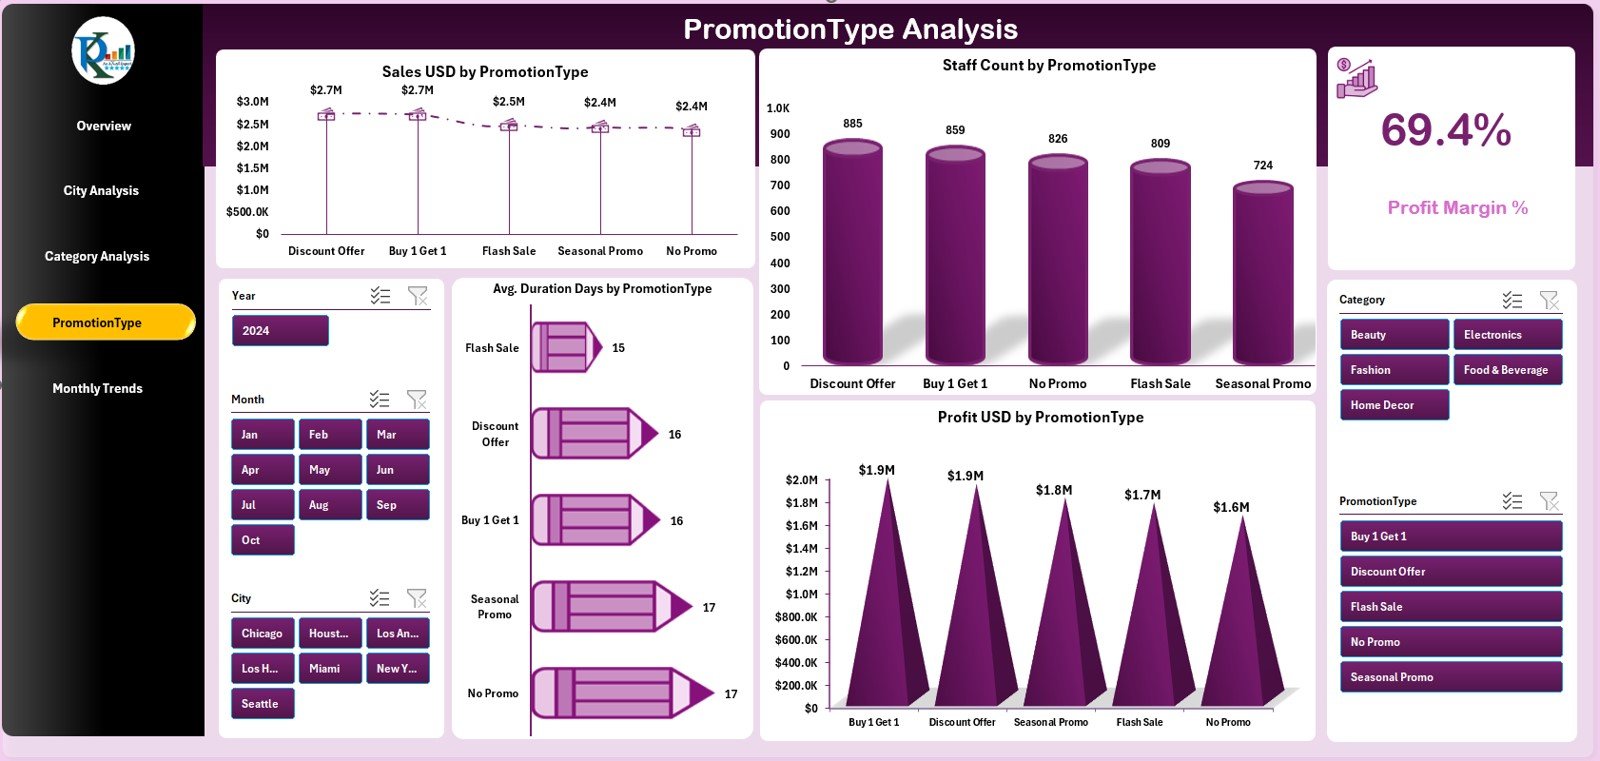
⭐ 4. Promotion Type Analysis Page
Understand which marketing strategies deliver maximum returns:
✔ Sales by Promotion
✔ Profit by Promotion
✔ Promotion Cost
✔ Staff Allocation
✔ Duration of Promotions
Ideal for marketing teams planning effective pop-up campaigns.
⭐ 5. Monthly Trends Page
Track monthly performance patterns:
✔ Cost by Month
✔ Profit by Month
✔ Staff Count by Month
✔ Avg. Duration by Month
✔ Conversion Rate by Month
This page supports long-term planning and helps identify seasonal demand cycles.
🧭 How to Use the Pop-up Stores Dashboard
🔹 Step 1: Update the Data Sheet
Enter city, category, promotion, staff, cost, and sales data. The dashboard refreshes automatically.
🔹 Step 2: Use the Page Navigator
Switch between pages instantly using the left-side navigation panel.
🔹 Step 3: Analyze KPI Cards
Review overall sales, profit, conversions, and costs at a glance.
🔹 Step 4: Deep-Dive into City, Category, and Promotion Insights
Identify what’s working—and what’s not.
🔹 Step 5: Study Monthly Trends
Determine the best months for pop-ups based on historical performance.
This dashboard makes performance tracking simple, visual, and actionable for every retail team.
👥 Who Can Benefit from This Dashboard
🛍️ Retail Brands & Chains
Track sales, customer engagement, and category performance.
📈 Marketing & Promotions Teams
Evaluate promotion ROI and plan better campaigns.
🏬 Event & Activation Managers
Monitor store duration, staffing, and location success.
👨💼 Brand Managers & Analysts
Get instant insights for planning, budgeting, and reporting.
🏢 Startups & D2C Brands
Test new markets and optimize pop-up strategies.
This dashboard ensures your pop-up events run successfully, profitably, and with complete clarity.


Reviews
There are no reviews yet.