
Credit rating agencies operate in a fast-moving financial environment where accuracy, transparency, and timely reporting are extremely important. Analysts, compliance teams, and senior management all rely on reliable data to ensure rating quality, maintain regulatory confidence, and improve operational efficiency. But when performance numbers are scattered across spreadsheets, emails, and manual reports, tracking KPIs becomes difficult. That is why we created the Credit Rating Agencies KPI Dashboard in Power BI — a complete, ready-to-use analytics solution that turns complex data into clear, actionable insights.
This dashboard offers full visibility into rating timelines, completion rates, review cycles, accuracy scores, analyst productivity, compliance checks, YTD/MTD targets, and trend comparisons. With dynamic slicers, combo charts, drill-through pages, and Power BI’s automation capabilities, this dashboard helps teams understand performance in seconds, not hours. Whether you lead operations, manage analysts, handle compliance, or supervise rating quality, this dashboard empowers you to make fast and confident decisions.
⭐ Key Features of the Credit Rating Agencies KPI Dashboard in Power BI
✨ Complete KPI Summary View
Track all operational, compliance, productivity, and quality KPIs from a single page.
📅 MTD & YTD Tracking
View month-to-date and year-to-date performance instantly, with target comparisons.
🎯 Target Met / Target Missed Indicators
Color-coded icons (▲ / ▼) help you quickly identify KPI performance status.
🗂 KPI Group Slicers
Filter KPIs by category such as rating operations, compliance, quality, and productivity.
📈 Trend Visualization Page
Understand historical performance with combo charts showing CY vs PY vs Target trends.
📘 Drill-Through KPI Definition Page
Access formulas, definitions, units, and KPI logic for complete transparency.
📁 Excel-Based Data Source
Simply update the Excel sheets and refresh Power BI—your dashboard updates automatically.
🚀 Perfect for Monthly Reviews
Ideal for management meetings, compliance reviews, performance evaluations, and audit discussions.
⭐ What’s Inside the Credit Rating Agencies KPI Dashboard
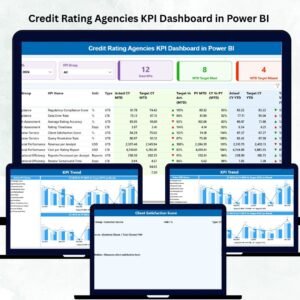
This dashboard is designed with three powerful pages, each offering a different analytical perspective.
📌 1. Summary Page – Full KPI Overview
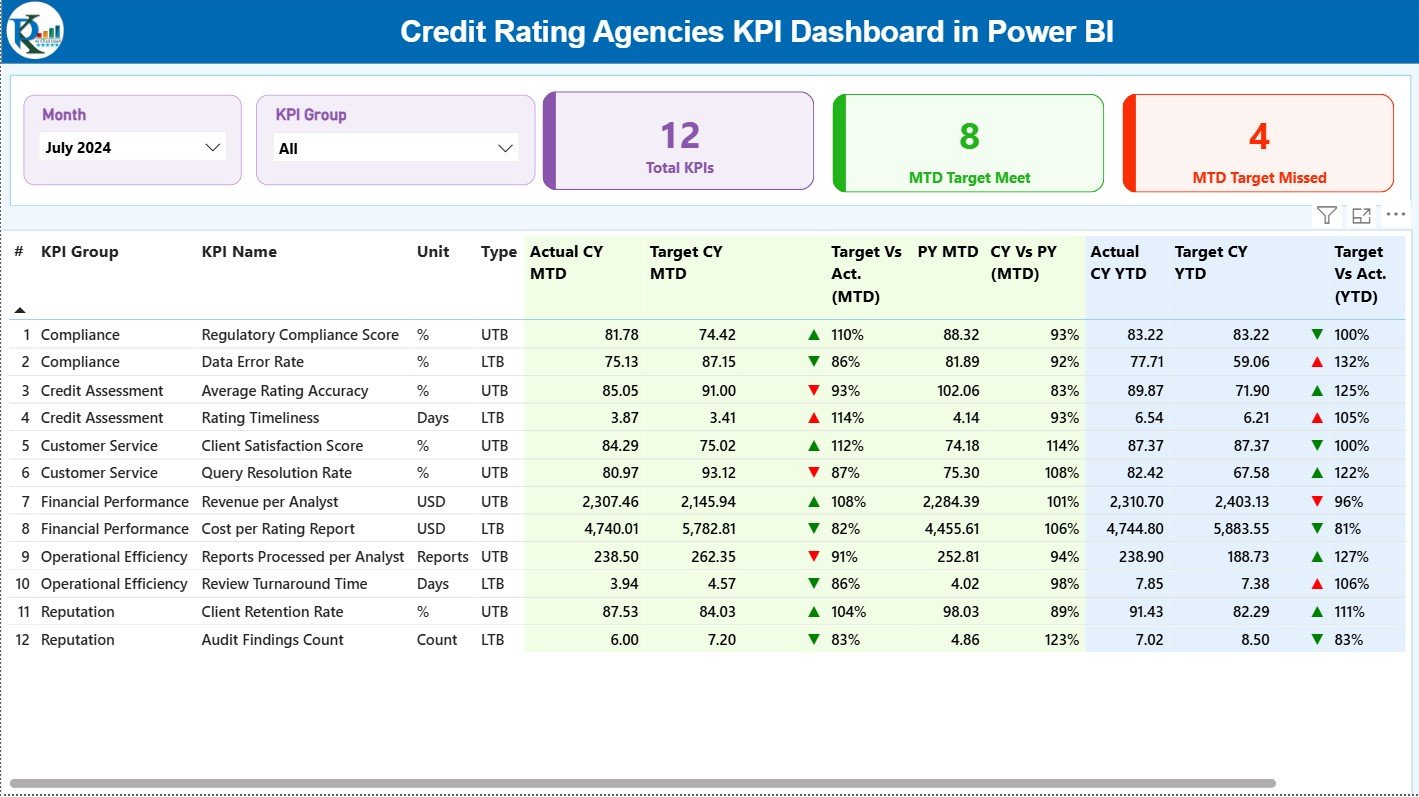
This is the main monitoring page that gives a complete performance snapshot using:
-
Month Filter
-
KPI Group Filter
-
KPI Cards showing Total KPIs, MTD Target Met, and MTD Target Missed
-
A detailed KPI performance table including MTD, YTD, Targets, CY vs PY, and % achievements
You get a 360-degree view of rating operations and compliance performance.
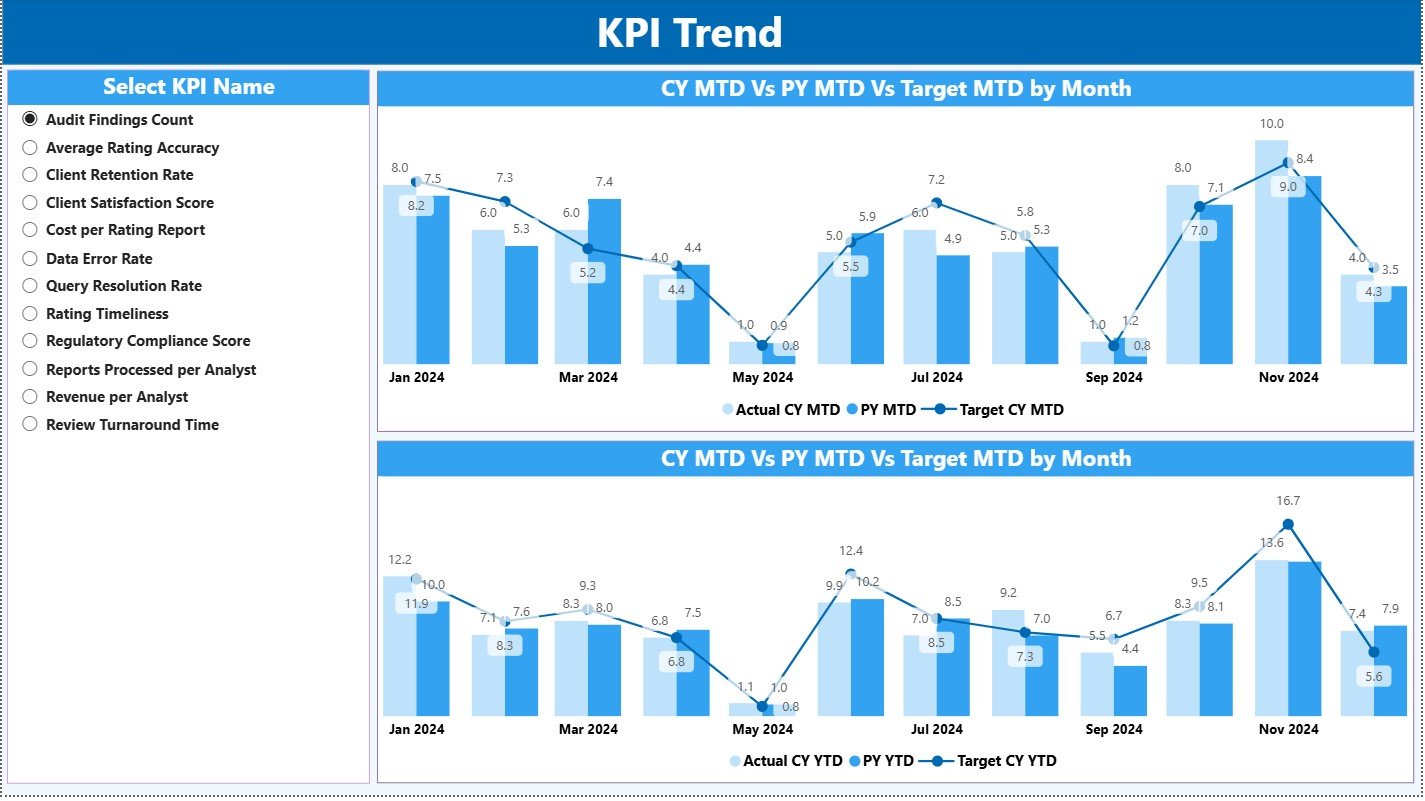
📌 2. KPI Trend Page – Visual Performance Analysis
This page helps you analyze:
-
Monthly actuals vs targets
-
YTD performance across the year
-
CY vs PY visual patterns
-
KPI-level trend fluctuations
Select any KPI using the slicer and review its full performance journey.
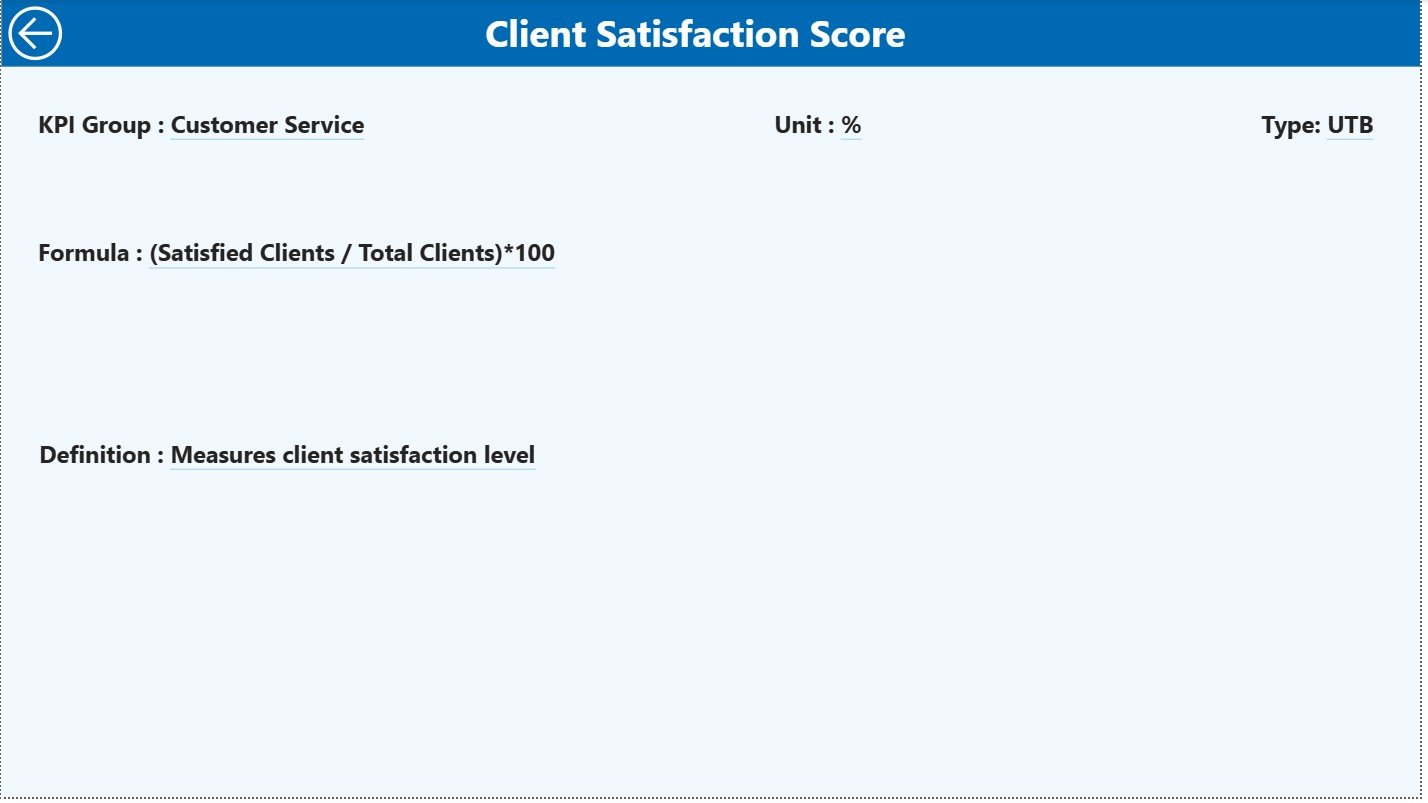
📌 3. KPI Definition Page – Drill-Through Clarity
This hidden drill-through page shows:
-
KPI Number
-
Group
-
Name
-
Unit
-
Type (UTB/LTB)
-
Formula
-
Detailed KPI Definition
This ensures every team member interprets the KPIs correctly.
📌 Includes 3 Excel Data Sheets
-
Input_Actual – Monthly actual data (MTD/YTD)
-
Input_Target – Monthly targets
-
KPI_Definition – Formula, logic, and KPI standards
Power BI automatically reads these sheets and updates your insights.
⭐ How to Use the Credit Rating Agencies KPI Dashboard
Using this dashboard is extremely easy—even for non-technical users.
🟦 Step 1: Fill the Actual, Target, and KPI Definition sheets
🟦 Step 2: Open the Power BI file and click Refresh
🟦 Step 3: Use Month and KPI Group slicers to filter your data
🟦 Step 4: Review KPI performance using the results table and KPI cards
🟦 Step 5: Check trends using the KPI Trend page
🟦 Step 6: Drill through to understand KPI definitions
🟦 Step 7: Use the results for review meetings and performance improvement plans
The entire workflow is designed to make rating performance evaluation simple and fast.
⭐ Who Can Benefit from This Credit Rating Agencies KPI Dashboard
🏦 Rating Operations Teams
Track completion time, review cycles, backlog, and rating turnaround time.
📊 Quality & Validation Teams
Monitor rating accuracy, review scores, and error rates.
📁 Compliance Departments
Track audit issues, regulatory submissions, and compliance review completion.
📈 Senior Management
Get instant visibility into rating progress, bottlenecks, and improvement areas.
👨💼 Analysts & Team Leads
Evaluate productivity, efficiency, and performance against targets.
📝 Internal Audit Teams
Use drill-through definitions for transparent governance.
Whether you manage 50 KPIs or 500 KPIs, this dashboard simplifies performance monitoring for your entire agency.


Reviews
There are no reviews yet.