The electronics and semiconductor industry moves faster than any other manufacturing sector. Costs change daily, production runs continuously, energy usage keeps fluctuating, and profitability depends on how quickly companies react to new data. But when insights are hidden inside spreadsheets, emails, and manual reports, decision-making slows down. Delays become expensive, and opportunities disappear.
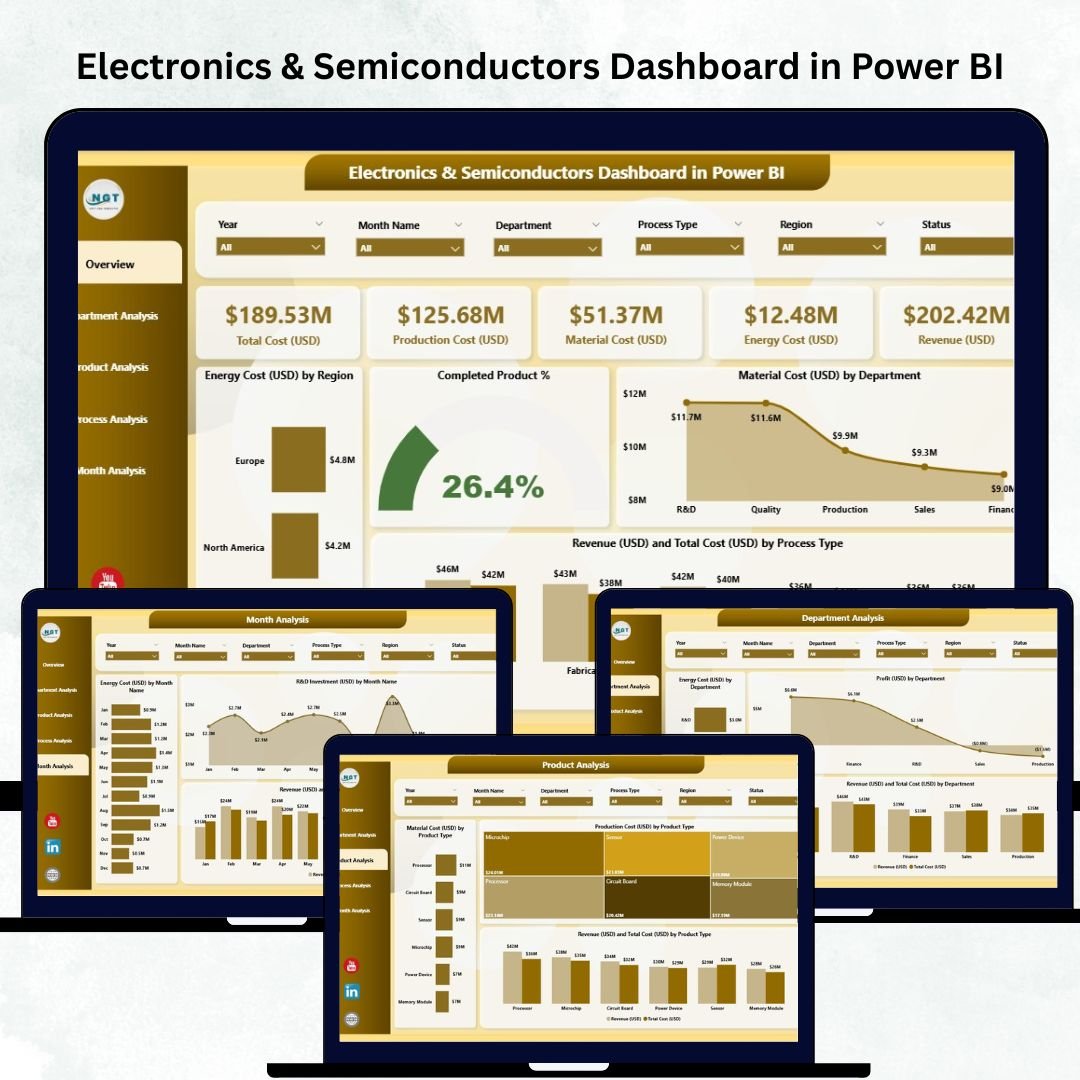
The Electronics & Semiconductors Dashboard in Power BI solves this problem completely. It transforms raw manufacturing and financial data into clean visuals, automated charts, and interactive insights. You track material cost, energy usage, production cost, revenue, profit, R&D investment, and monthly trends — all from one dashboard. Power BI refreshes the visuals instantly, giving you real-time clarity and complete control over your operations.
Whether you work in production, finance, R&D, procurement, supply chain, or quality control, this dashboard helps you understand performance immediately and take smarter decisions every day.
✨ Key Features of the Electronics & Semiconductors Dashboard in Power BI
This dashboard includes five powerful pages, each designed to highlight a specific area of operations.
📦 What’s Inside the Electronics & Semiconductors Dashboard
1️⃣ Overview Page – Your Complete Business Snapshot
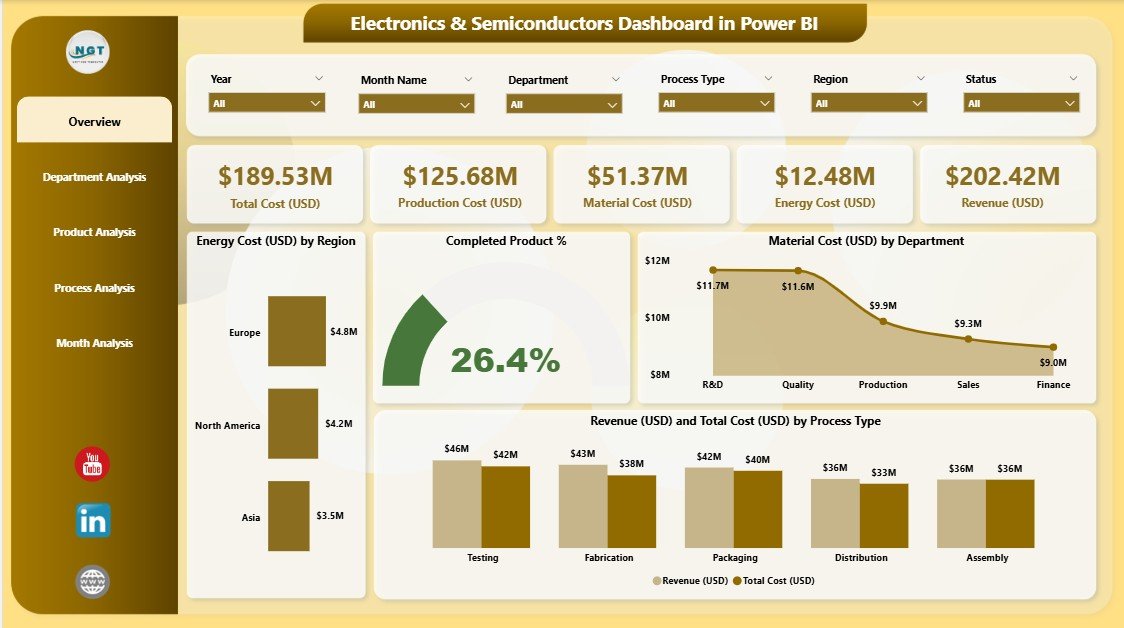
The Overview Page gives a high-level summary of performance across cost, energy, product completion, and revenue. It includes:
-
⭐ Five KPI Cards, showing:
-
Total Energy Cost
-
Completed Product %
-
Total Material Cost
-
Total Revenue
-
Total Cost
-
-
📊 Four Interactive Charts:
-
Energy Cost (USD) by Region
-
Completed Product %
-
Material Cost (USD) by Department
-
Revenue (USD) & Total Cost (USD) by Process Type
-
This page helps leaders instantly understand overall health, identify high-cost areas, and track manufacturing output.
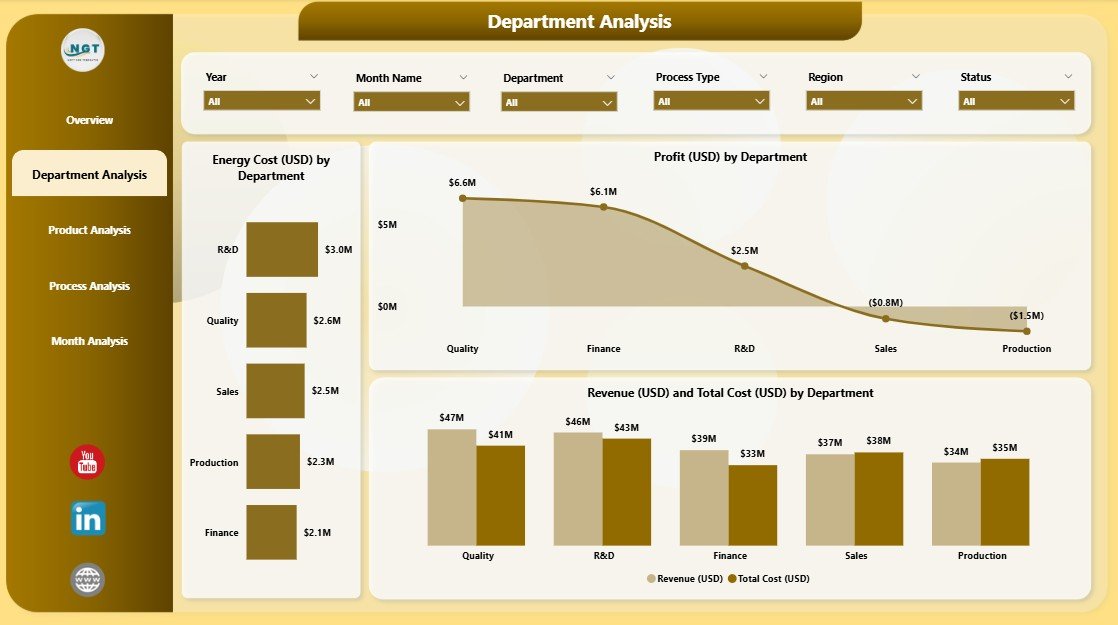
2️⃣ Department Analysis Page – Find Strong & Weak Departments
Every department contributes differently to cost, revenue, and energy usage. This page helps analyze internal operations clearly through:
-
Energy Cost (USD) by Department
-
Profit (USD) by Department
-
Revenue (USD) & Total Cost (USD) by Department
This section helps teams cut waste, improve budgets, and optimize operational efficiency.
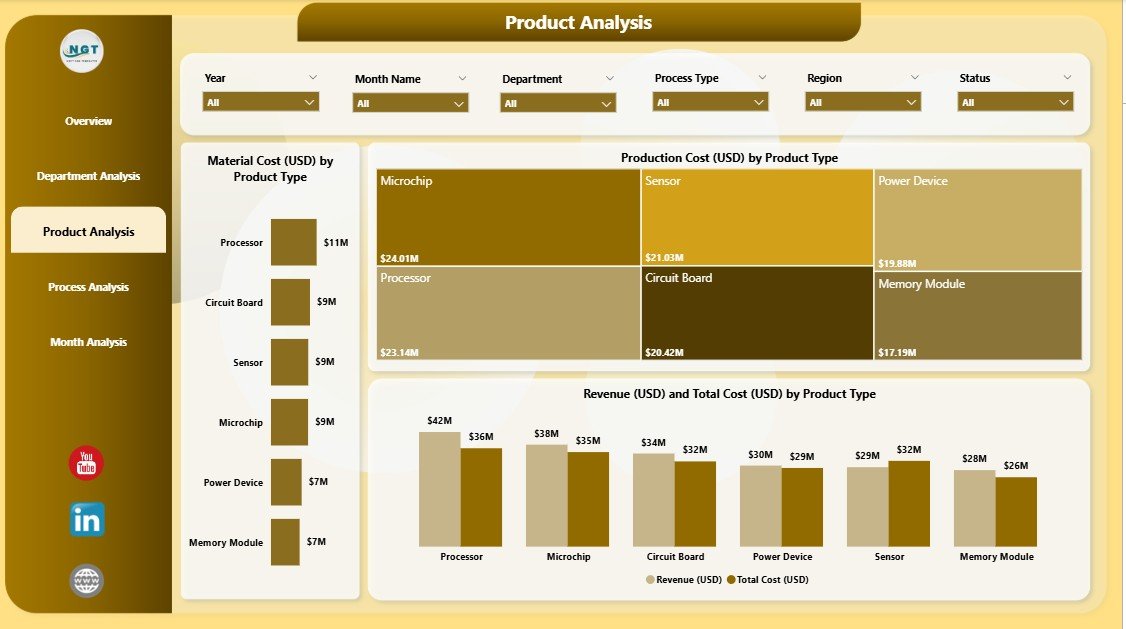
3️⃣ Product Analysis Page – Compare Product Performance
Different product types have different material needs, production cost, and revenue potential. This page includes:
-
Material Cost (USD) by Product Type
-
Production Cost (USD) by Product Type
-
Revenue (USD) & Total Cost (USD) by Product Type
You quickly identify high-margin, high-cost, or underperforming products and make smarter pricing and production decisions.
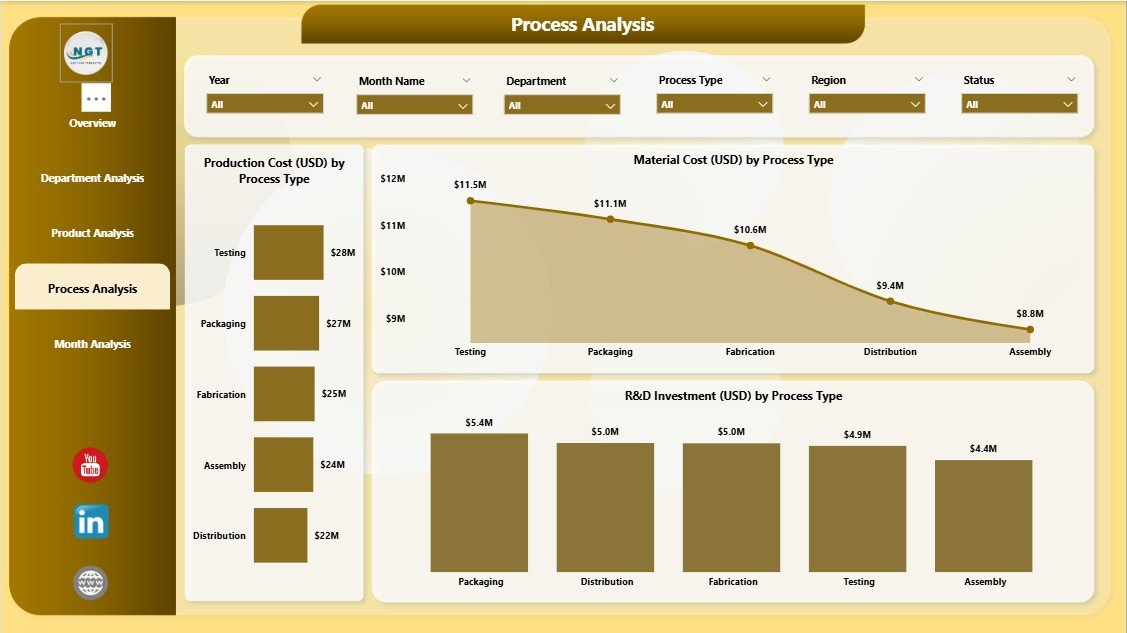
4️⃣ Process Analysis Page – Understand Complex Manufacturing Processes
Semiconductor production involves processes like assembly, lithography, etching, packaging, testing, and R&D. This page helps you evaluate process-level efficiency with:
-
Material Cost (USD) by Process Type
-
Production Cost (USD) by Process Type
-
R&D Investment (USD) by Process Type
This is extremely useful for improving efficiency, controlling costs, and supporting innovation.
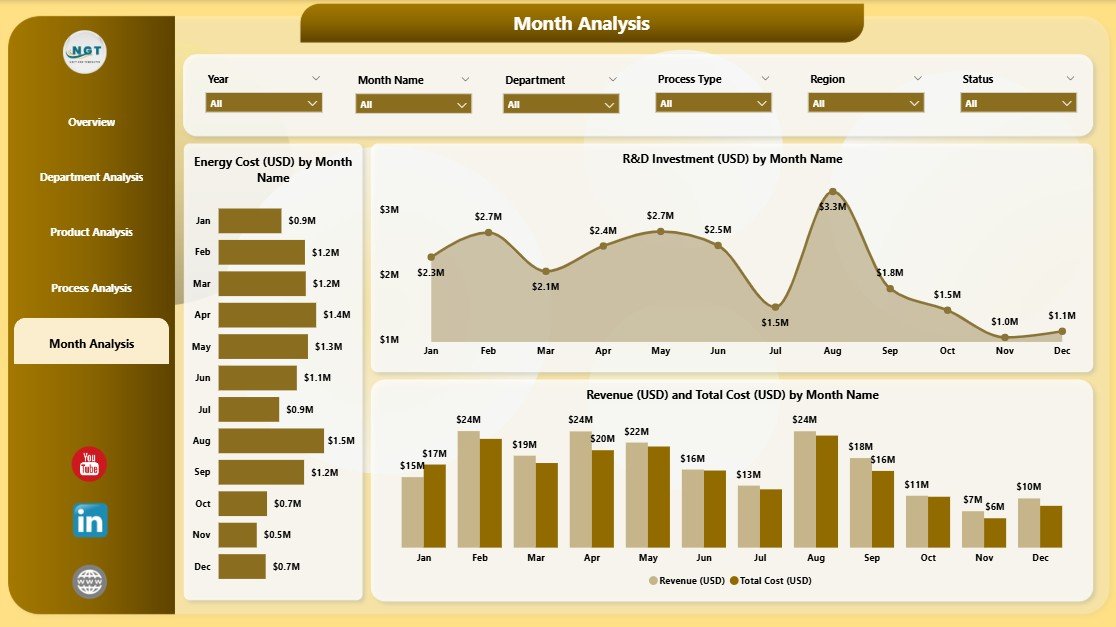
5️⃣ Monthly Trends Page – Track Cost, Revenue & Growth Over Time
This page highlights time-based performance so you can understand patterns across the year. It includes:
-
Energy Cost (USD) by Month
-
R&D Investment (USD) by Month
-
Revenue (USD) & Total Cost (USD) by Month
Trend charts help with budgeting, forecasting, seasonal planning, and performance comparison.
🧩 How to Use the Electronics & Semiconductors Dashboard
Using this dashboard is simple:
-
Update your source data in Excel or connect to your ERP/MRP system
-
Refresh your Power BI report
-
Use slicers to filter by month, region, department, product, or process
-
View real-time changes in charts and KPIs instantly
It requires zero coding and only basic Power BI navigation skills.
👥 Who Can Benefit from This Dashboard?
This dashboard is designed for:
-
Manufacturing teams
-
Semiconductor production managers
-
R&D departments
-
Finance and cost-control teams
-
Procurement teams
-
Quality and operations leaders
-
Senior management
Anyone involved in decision-making, budgeting, planning, or production control will benefit immediately.
💡 Why This Dashboard Makes a Big Difference
-
Real-time visibility of costs and performance
-
Automated analytics instead of manual reports
-
Clear breakdown of energy, material, and production cost
-
Strong comparison across departments, processes, and product lines
-
Faster and more accurate decision-making
-
Easy customization for your company’s workflow
-
Powerful visual insights for presentations and meetings
This dashboard brings complete clarity to complex semiconductor operations.
### Click hare to read the Detailed blog post
Visit our YouTube channel to learn step-by-step video tutorials
👉 Youtube.com/@PKAnExcelExpert


Reviews
There are no reviews yet.