Managing an accounting firm is not easy. Accounting Firms KPI Dashboard in Power BI You handle multiple clients, track billing hours, monitor team productivity, ensure compliance, manage audits, review cash flow, and maintain financial accuracy—every single day. Accounting Firms KPI Dashboard in Power BI When this information sits across disconnected Excel files or outdated reports, decision-making becomes slow and unclear. That is why accounting firms struggle to identify performance gaps, meet targets, and maintain efficiency.
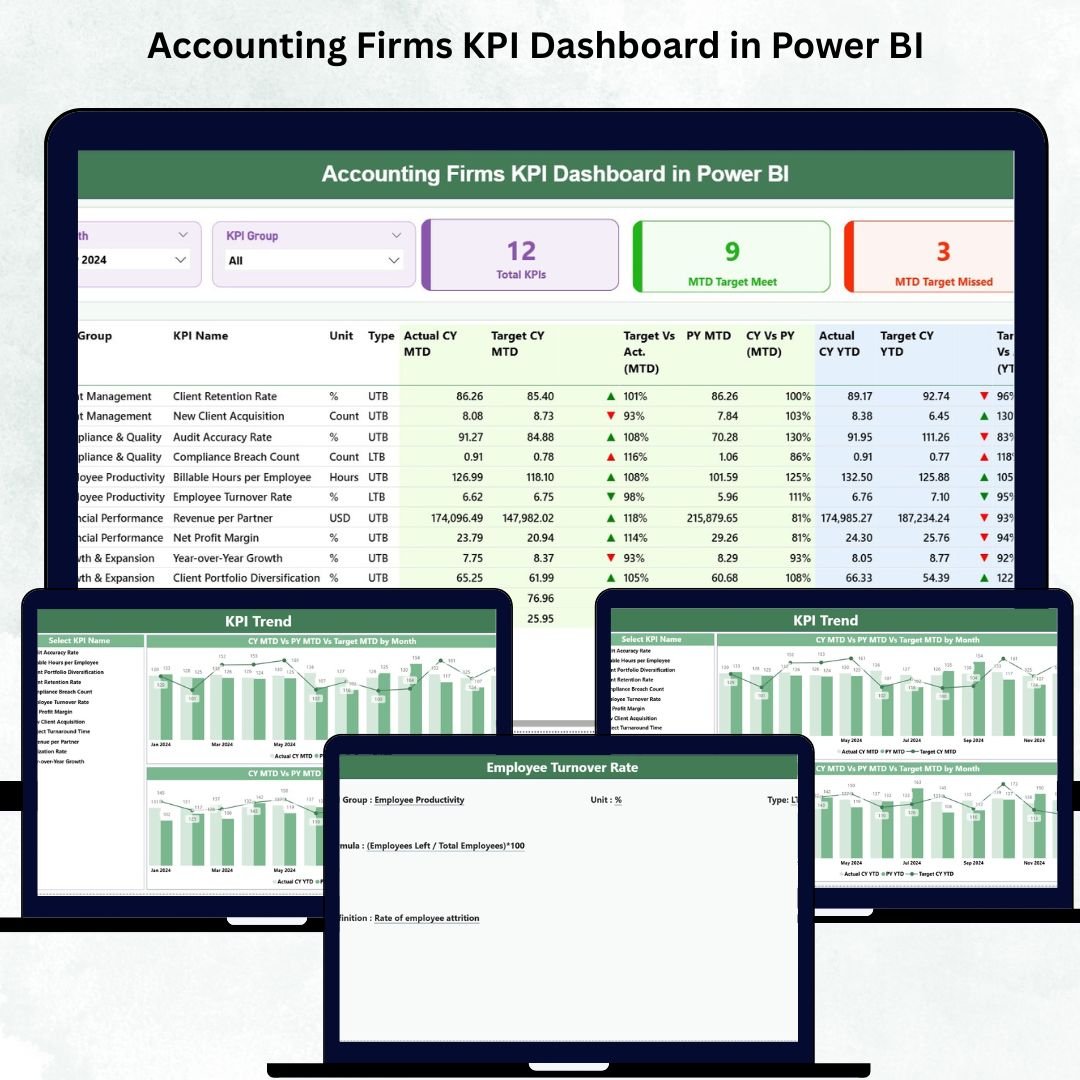
The Accounting Firms KPI Dashboard in Power BI solves these challenges instantly. It combines all accounting KPIs into one clean, visual, and interactive dashboard. With automated insights, real-time updates, and powerful analysis features, this dashboard helps you monitor monthly performance, compare targets, and track improvements across departments with complete clarity.
Whether you are a CA firm, tax consultant, corporate finance team, audit department, or outsourced accounting service provider—this dashboard gives you the visibility you need to boost productivity and grow faster.
✨ Key Features of the Accounting Firms KPI Dashboard in Power BI
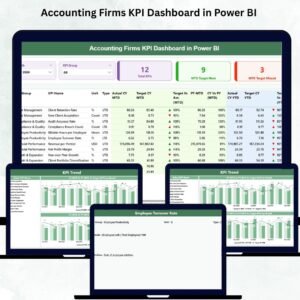
📊 Summary Page – Your Main Financial Overview
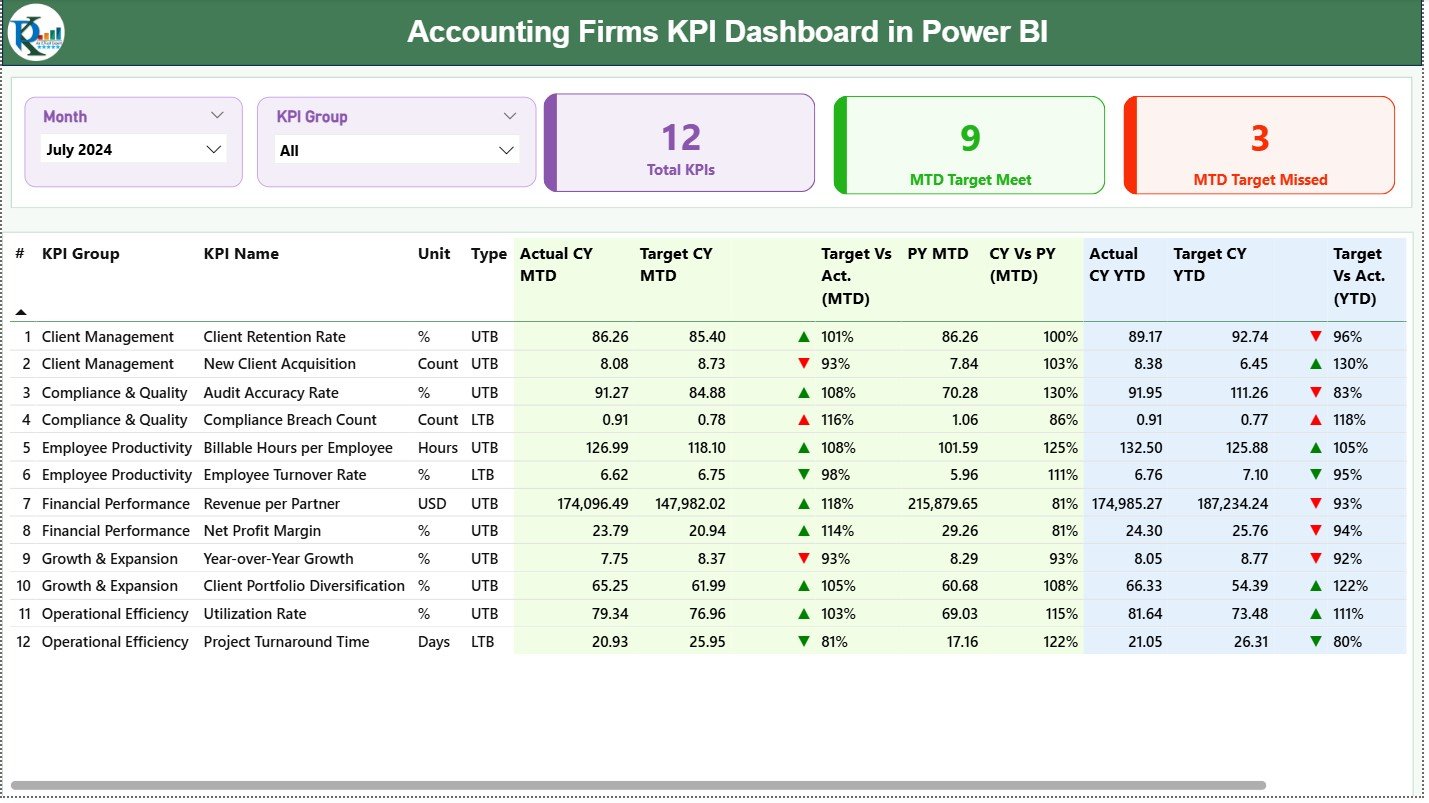
This is the most important page of the dashboard, designed to give you a complete snapshot of your monthly performance.
You get:
-
🗓️ Month Slicer – Quickly switch between months to view updated KPI reports.
-
🗂️ KPI Group Slicer – Filter KPIs by category such as Revenue, Billing, Audits, Productivity, Compliance, Project KPIs, and more.
-
⭐ Three KPI Cards showing:
-
Total KPIs Count
-
MTD Target Met Count
-
MTD Target Missed Count
-
The detailed KPI table provides complete insights, including:
-
KPI Number
-
KPI Group & KPI Name
-
Unit of Measurement
-
KPI Type (UTB or LTB)
-
Actual CY MTD vs Target CY MTD
-
MTD Icons (▲ Green, ▼ Red)
-
Target vs Actual %
-
Previous Year MTD & CY vs PY %
-
Actual CY YTD vs Target CY YTD
-
YTD Icons (▲ ▼)
-
Previous Year YTD & CY vs PY %
Everything appears in one structured, easy-to-read format, helping accounting teams make faster decisions every month.
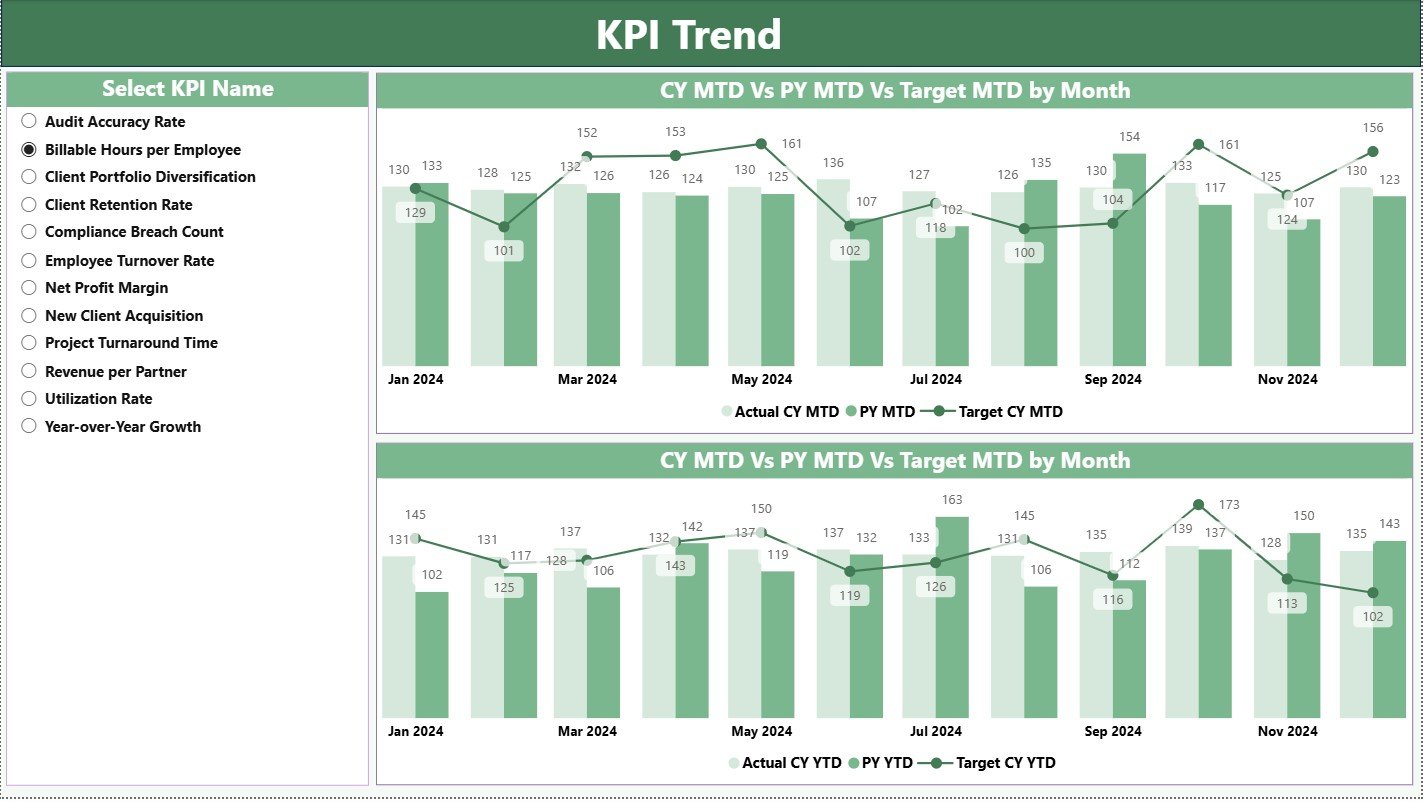
📈 KPI Trend Page – Analyze Monthly & Yearly Movement
The KPI Trend Page gives you powerful insights into performance patterns. Accounting firms rely on long-term trends to manage workflows, optimize productivity, and predict financial results.
You get:
-
🔽 KPI Name Slicer
-
📉 MTD Trend Chart (Actual vs Target vs PY)
-
📈 YTD Trend Chart (Actual vs Target vs PY)
These visuals help you identify improvement areas, understand seasonal changes, and plan better strategies for clients and teams.
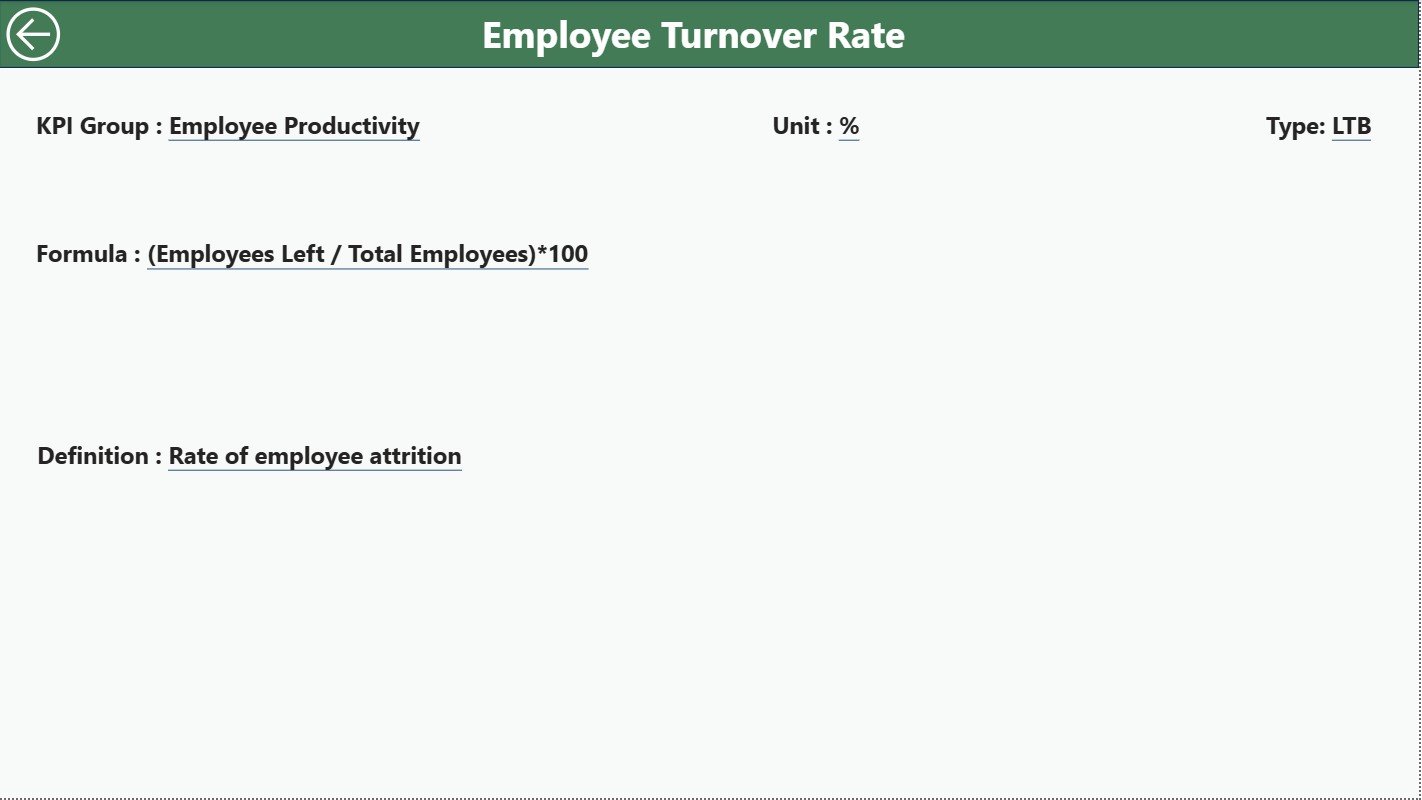
📘 KPI Definition Page – Full Drill-Through Transparency
This hidden page provides complete clarity for each KPI. It opens through drill-through navigation.
It displays:
-
KPI Number
-
KPI Group
-
KPI Name
-
Unit
-
KPI Type (UTB or LTB)
-
Formula
-
KPI Definition
A Back Button takes you instantly back to the Summary Page.
This ensures every team member, from junior accountants to partners, understands how KPIs are calculated.
📂 How the Excel Data Source Works
The dashboard refreshes automatically based on your Excel file. Update only three sheets:
1️⃣ Input Actual Sheet
Enter:
-
KPI Name
-
Month (1st day of month)
-
Actual MTD Values
-
Actual YTD Values
2️⃣ Input Target Sheet
Record:
-
KPI Name
-
Month
-
Target MTD
-
Target YTD
3️⃣ KPI Definition Sheet
Fill:
-
KPI Number
-
KPI Group
-
KPI Name
-
Unit
-
Formula
-
KPI Definition
-
KPI Type (UTB/LTB)
This structure makes your dashboard simple, consistent, and easy to maintain.
🎯 Who Can Benefit from This Dashboard?
👨💼 CA Firms & Tax Consultants
Track clients, billing, audit progress, and compliance KPIs.
🧮 Corporate Finance Departments
Monitor cash flow, revenue KPIs, and productivity metrics.
🗂️ Outsourced Accounting Providers
Get a full view of client performance.
🧑🤝🧑 Audit Teams
Stay updated on audit completion, exceptions, and turnaround times.
🧑💻 Internal Accounting Teams
Analyze targets, MTD/YTD progress, employee efficiency, and utilization.
🌟 Why Your Accounting Firm Needs This Dashboard
-
📈 All KPIs in one place – No more scattered reports
-
💡 Real-time insights – Power BI updates instantly
-
🎯 Track Target vs Actual with icons – Clear performance signals
-
📉 Trend charts show long-term improvement
-
🧮 Reduced manual work – Excel + Power BI automation
-
📘 Clear KPI definitions for consistency
-
🚀 Faster decision-making and higher productivity


Reviews
There are no reviews yet.