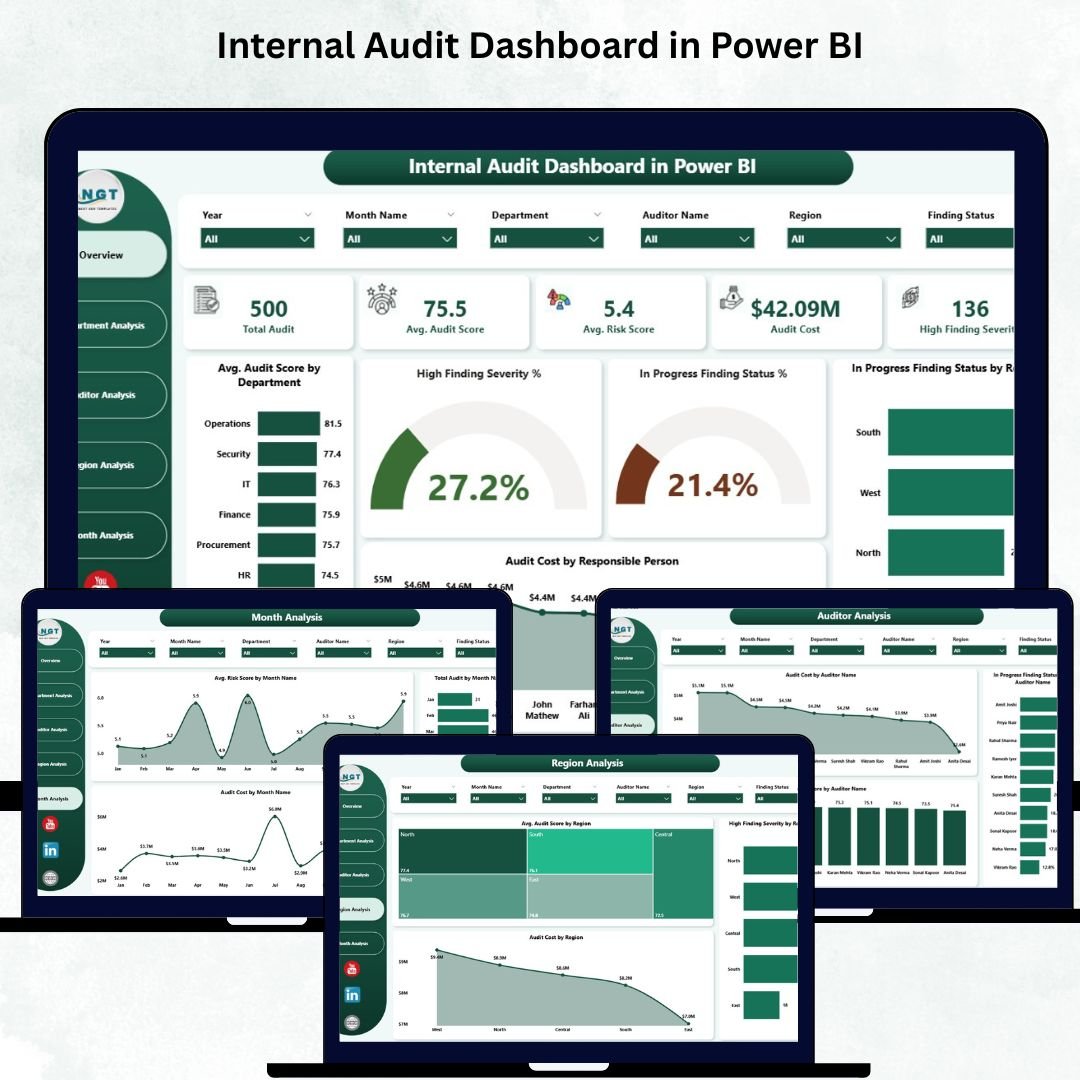
Internal audits generate enormous amounts of data—risk scores, findings, severity levels, audit scores, costs, and monthly trends. When all of this sits inside scattered Excel files, emails, and handwritten notes, audit teams struggle to see the full audit picture. Decision-making slows down, risks stay hidden, and reporting becomes stressful. To overcome these challenges, we created the Internal Audit Dashboard in Power BI — a powerful, interactive, and ready-to-use audit performance monitoring dashboard.
This dashboard consolidates all audit KPIs into one place. With automated visuals, KPI cards, slicers, and drill-through capabilities, you can track audit progress instantly. You see risk patterns, severity spikes, unresolved findings, cost variations, auditor performance, and department-wise issues—all in a single, easy-to-understand view. Since Power BI updates automatically when your data source refreshes, your audit reports stay accurate, reliable, and real-time.
✨ Key Features of Internal Audit Dashboard in Power BI
🟦 Five Powerful Pages for Complete Audit Insights
The dashboard includes separate pages for Overview, Department Analysis, Auditor Analysis, Region Analysis, and Monthly Trends. Each page highlights audit health from a different angle, allowing teams to dig deeper and act faster.
📊 Interactive KPI Cards & Charts
The dashboard includes five major KPI cards showing high-level audit metrics. Four impactful charts help visualize audit score trends, severity distribution, in-progress findings, cost insights, and region-wise performance.
🔍 Smart Filters & Slicers
Users can filter data by department, region, auditor, and month. With one click, Power BI updates every visual, making the dashboard extremely intuitive.
⚡ Automatic Refresh & Real-Time Visibility
As soon as your Excel or database source updates, Power BI refreshes all pages. You get clean, updated visuals—without manual effort.
📦 What’s Inside the Internal Audit Dashboard in Power BI
📁 1. Fully Designed PBIX File
A structured Power BI dashboard with all visuals, slicers, KPI cards, and drill-through actions already built.
📊 2. Five Interactive Pages
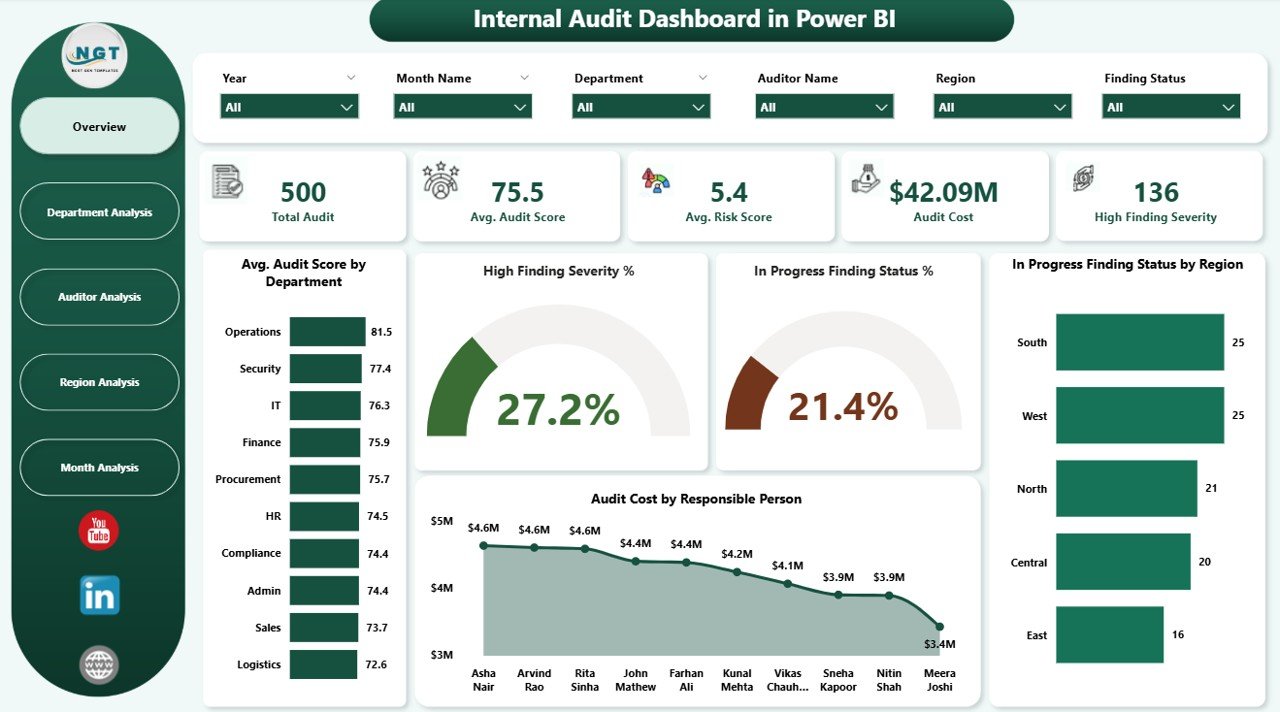
🟦 1. Overview Page – Your Main Control Center
This page shows the overall audit condition in one screen. It includes:
-
5 KPI cards
-
Avg. Audit Score by Department
-
High Severity Findings
-
In Progress Finding Status %
-
Audit Cost by Responsible Person
This page helps leaders understand risks, severity, and cost instantly.
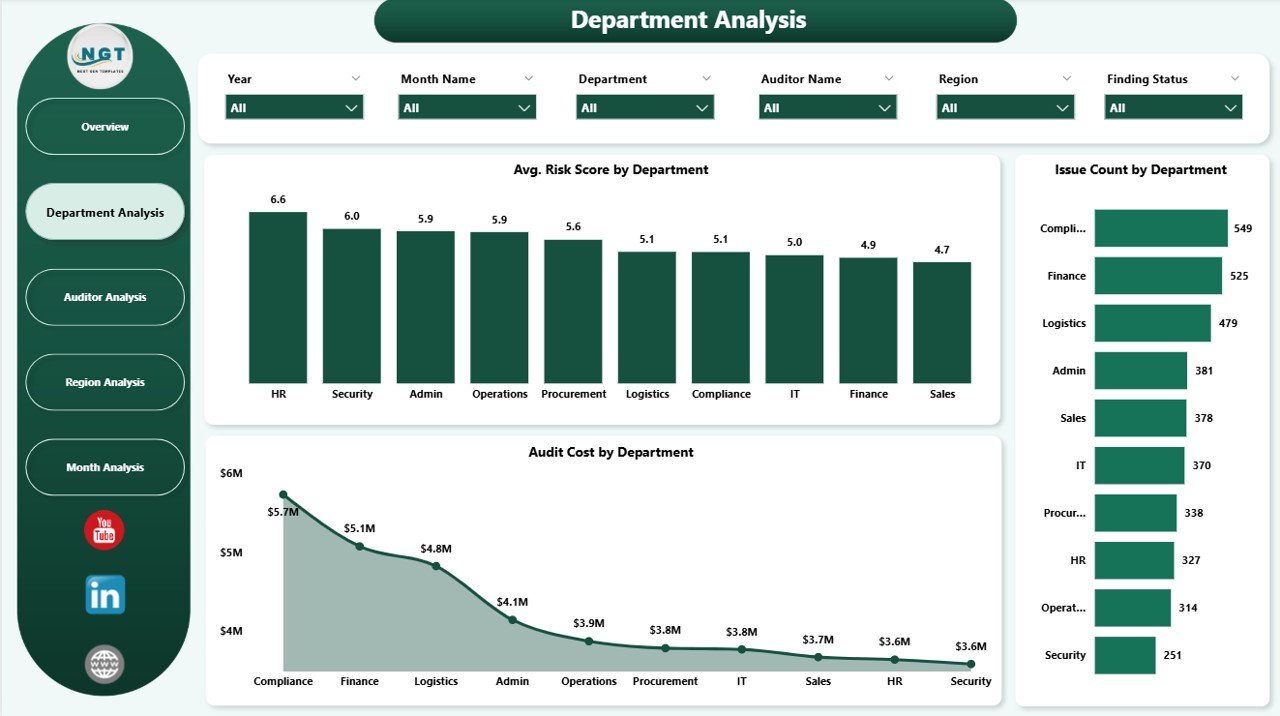
🟧 2. Department Analysis Page – Identify High-Risk Departments
This page includes visuals for:
-
Average Risk Score by Department
-
Issue Count by Department
-
Audit Cost by Department
You can quickly identify departments with repeated issues or high-severity findings.
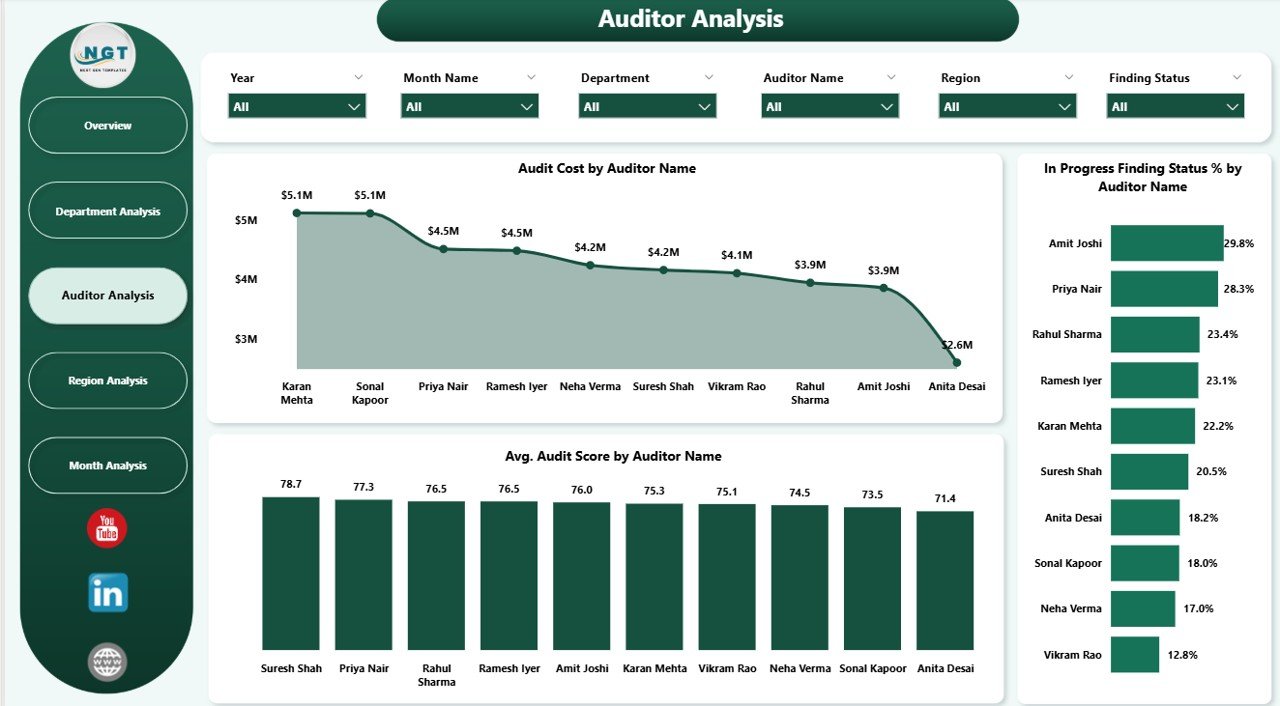
🟪 3. Auditor Analysis Page – Improve Auditor Performance
Charts highlight:
-
Audit Cost by Auditor
-
In Progress Status %
-
Average Audit Score by Auditor
This helps audit managers plan workload, training, and evaluations.
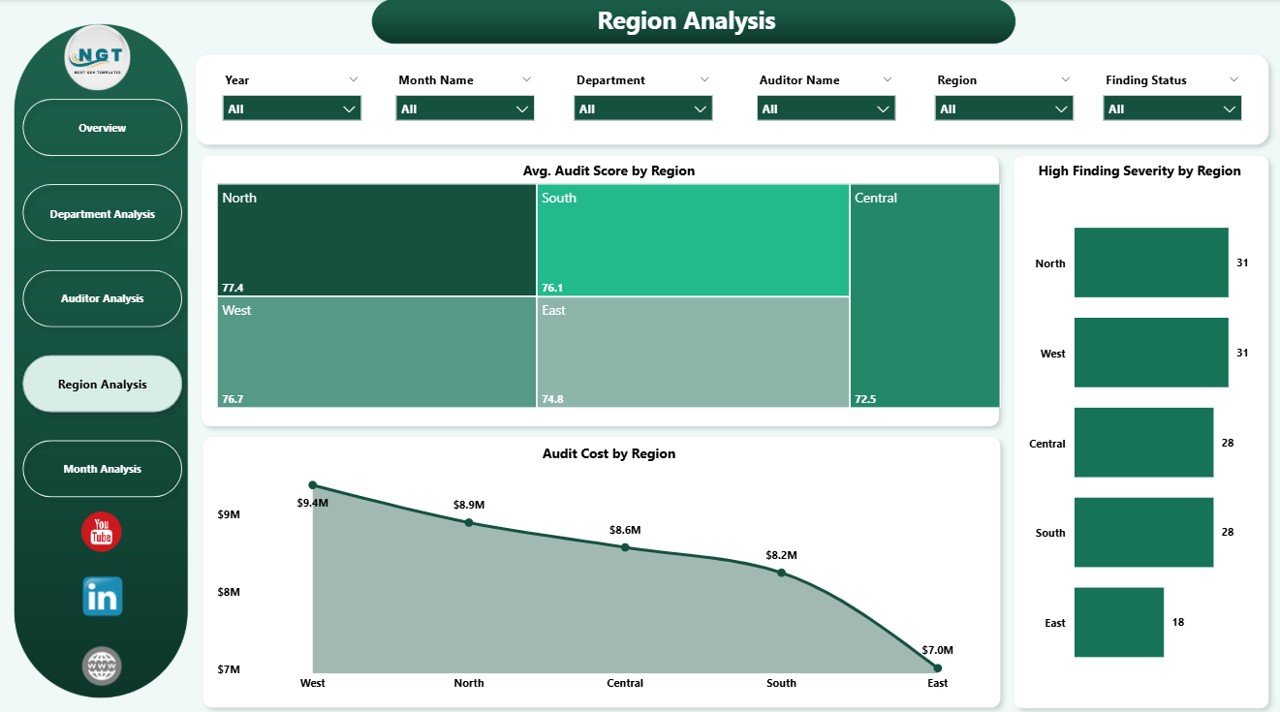
🟩 4. Region Analysis Page – Monitor Region-Wise Audit Health
Includes charts for:
-
Avg. Audit Score by Region
-
High Finding Severity %
-
Audit Cost by Region
This helps identify regional hotspots that require immediate attention.
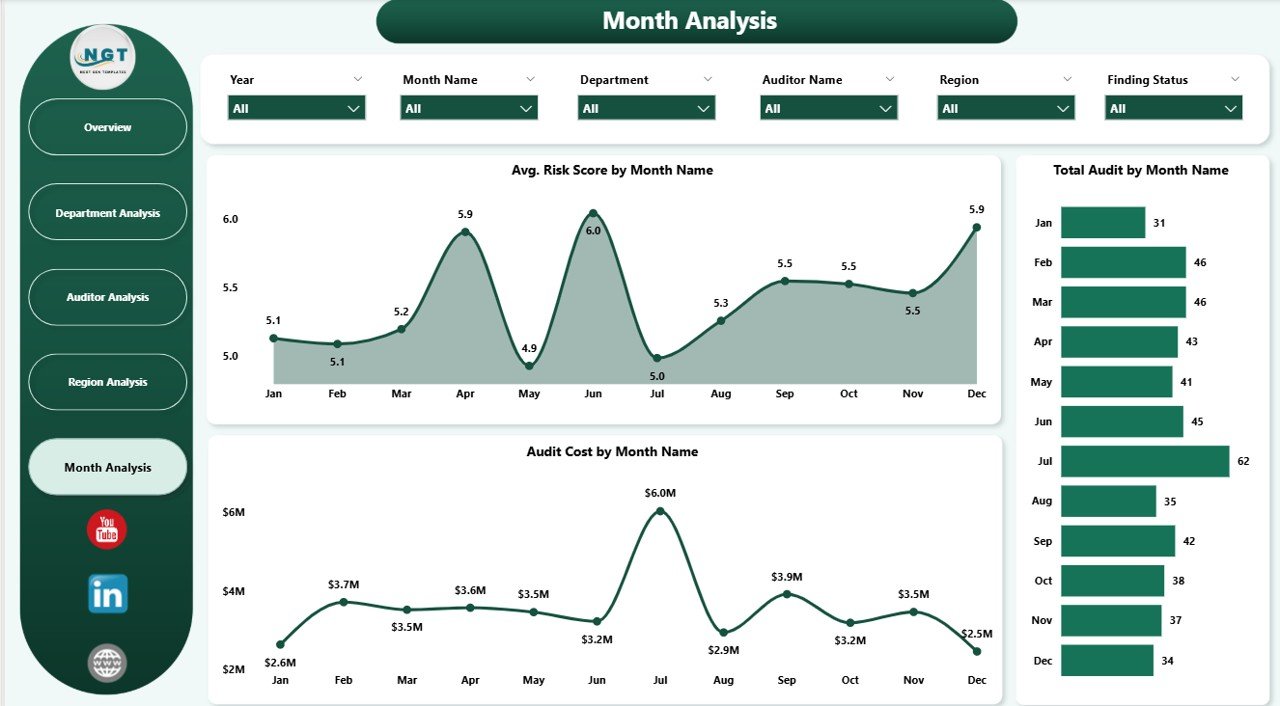
🟨 5. Monthly Trends Page – Understand Audit Performance Over Time
This page shows long-term patterns such as:
-
Avg. Risk Score by Month
-
Total Audits by Month
-
Audit Cost by Month
These insights help plan audits more efficiently.
🛠️ How to Use the Internal Audit Dashboard in Power BI
1️⃣ Update Your Data Source
Add new audit details—findings, severity, scores, cost, and status—in your Excel or database.
2️⃣ Refresh Power BI
All charts and tables update instantly.
3️⃣ Apply Filters & Explore Pages
Use slicers to filter by month, region, auditor, or department.
4️⃣ Review Key Indicators
Check severity spikes, cost changes, audit score trends, and open findings.
5️⃣ Analyze Trends Monthly
Use the Monthly Trends page to spot patterns and plan corrective actions.
🎯 Who Can Benefit from This Powerful Dashboard
🧑💼 Internal Audit Managers
Monitor overall audit performance and risk levels.
🧾 Senior Auditors
Track score trends and finding statuses for deeper analysis.
🏢 Risk & Compliance Teams
Identify high-risk areas and improve follow-up actions.
👨💼 Executive Leadership
See audit performance across regions and departments instantly.
🏭 Department Heads
Understand department-specific findings and performance gaps.
### Click hare to read the Detailed blog post
Visit our YouTube channel to learn step-by-step video tutorials
👉 Youtube.com/@PKAnExcelExpert


Reviews
There are no reviews yet.