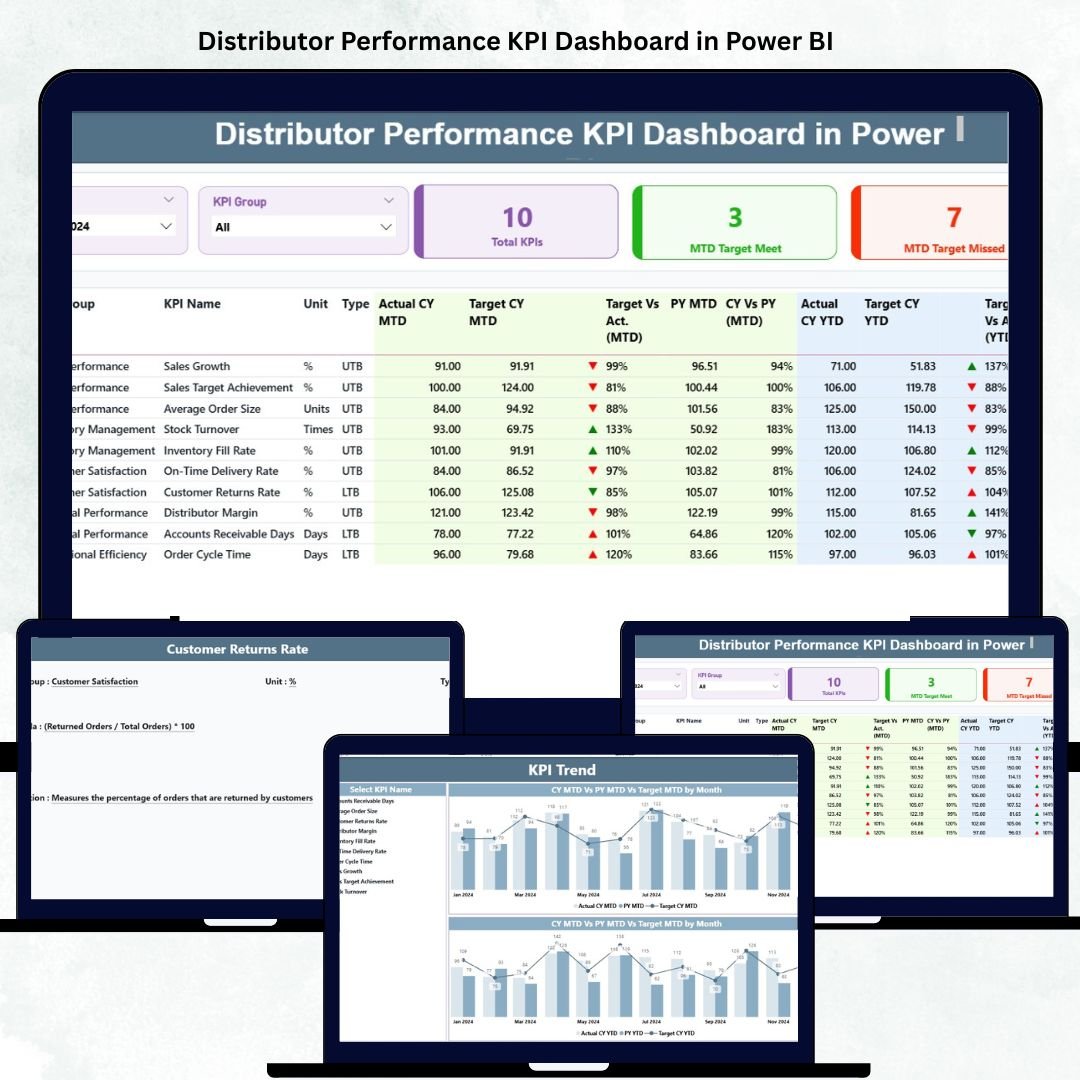
In the fast-paced world of distribution and supply chain management, keeping track of distributor performance is crucial to maintaining profitability and ensuring efficient product delivery. Manual tracking often leads to delays, inconsistent reports, and missed insights — that’s why the Distributor Performance KPI Dashboard in Power BI is a total game-changer.
This ready-to-use Power BI dashboard helps sales managers, supply-chain heads, and business analysts monitor distributor KPIs in real time, visualize achievements, and make informed, data-driven decisions. Built using Power BI’s advanced visualization and DAX capabilities, it transforms Excel data into actionable insights for instant business clarity. 📊⚙️
Whether you manage a regional distributor network or oversee nationwide sales, this dashboard offers a complete performance view — from monthly trends to YTD comparisons — helping you identify gaps, highlight strengths, and drive continuous improvement.
🌟 Key Features of the Distributor Performance KPI Dashboard in Power BI
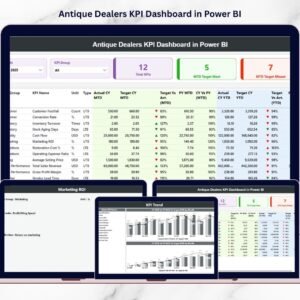
📈 Summary Page – The Performance Hub
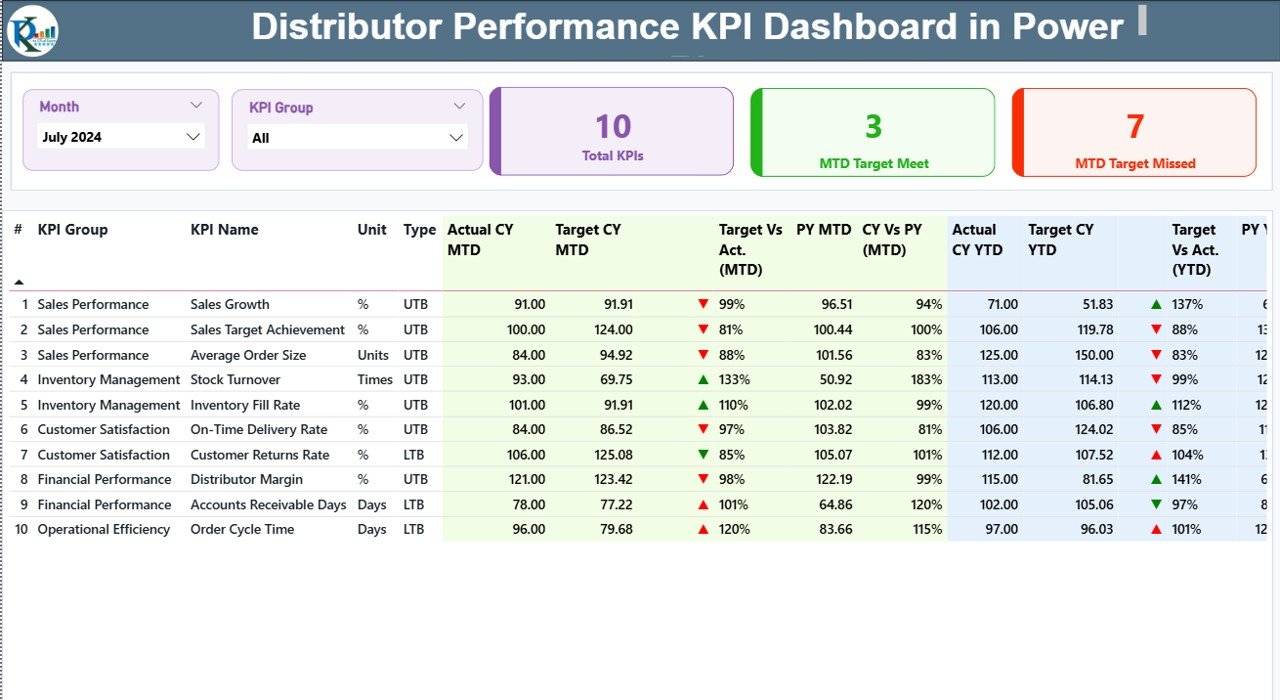
The Summary Page provides a high-level snapshot of distributor performance through KPIs, tables, and icons that make analysis effortless.
-
Interactive Slicers: Filter data by Month and KPI Group for focused insights.
-
Performance Cards: Instantly see total KPIs, MTD Target Met, and MTD Target Missed counts.
-
Dynamic KPI Table:
-
KPI Number, Group, Name, Unit, and Type (LTB/UTB)
-
Actual vs Target (MTD & YTD)
-
CY vs PY comparisons
-
Green (▲) and Red (▼) arrows for instant visual performance indicators
-
This page helps teams quickly detect where targets are being met — and where improvement is needed.
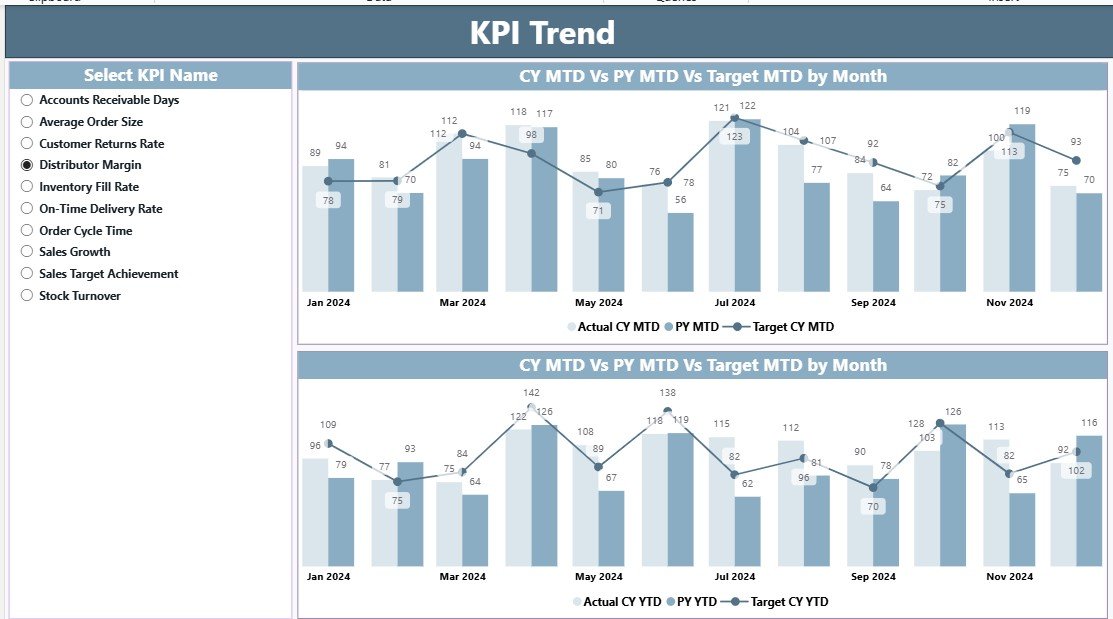
📊 KPI Trend Page – Analyze Over Time
Understand the bigger picture with visual trend analysis.
-
KPI Selector: Choose any KPI to see historical data.
-
Combo Charts: Display Actual CY, Target CY, and Previous Year (PY) data for both MTD and YTD.
-
Comparative Analysis: Identify long-term trends, seasonal dips, or emerging opportunities.
This page is ideal for analyzing performance trajectories and forecasting future outcomes.
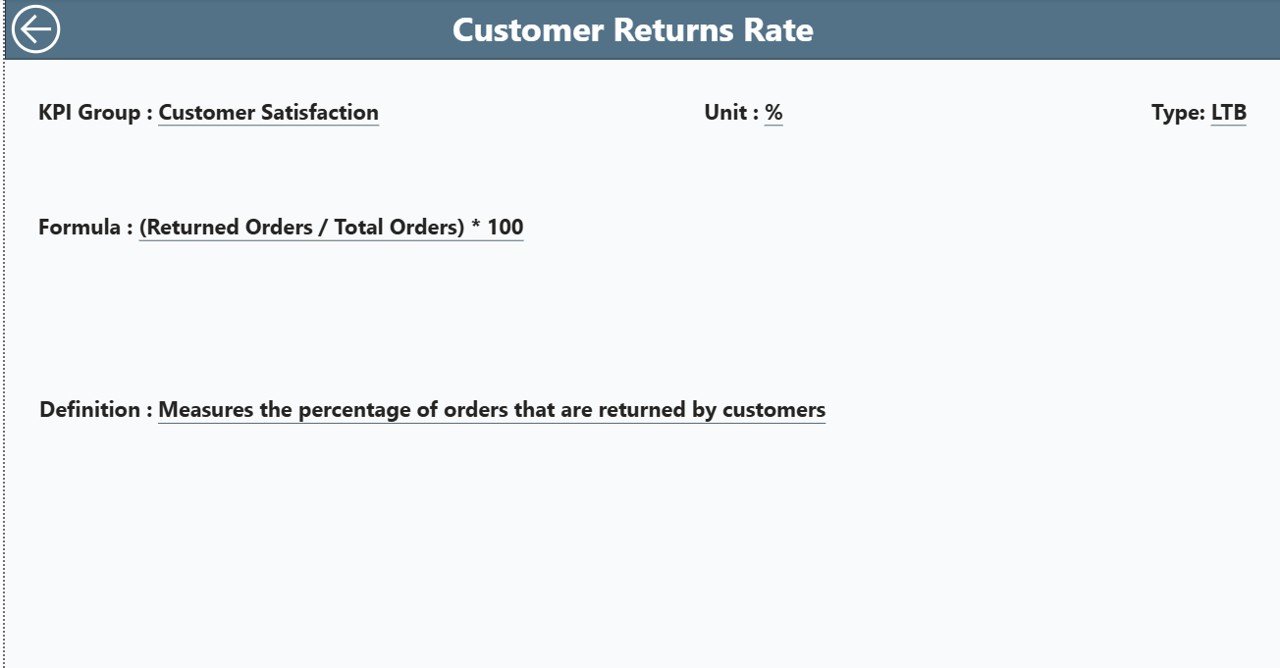
📘 KPI Definition Page – Clarity at a Glance
No more confusion about KPI logic or formulas!
-
Contains KPI Name, Group, Unit, Formula, Definition, and Type (LTB/UTB).
-
Drill-through from the Summary Page to view detailed KPI explanations.
-
“Back” button navigation ensures smooth movement between pages.
This page ensures your entire team understands how each KPI is calculated and measured.
📦 What’s Inside the Dashboard
✅ 3 Insightful Pages: Summary, KPI Trend, and KPI Definition
✅ Excel Data Source: Structured backend sheets for Actual, Target, and KPI Definitions
✅ Real-Time Slicers: Filter by month, KPI group, or year instantly
✅ Conditional Formatting: Green/red icons for performance clarity
✅ Drill-Through Functionality: Explore KPI details in seconds
✅ Fully Customizable: Add new KPIs, adjust visuals, or expand datasets
🧭 How to Use the Dashboard
1️⃣ Open the Power BI file and connect to your Excel data source.
2️⃣ Update Actual and Target Sheets in Excel monthly or weekly.
3️⃣ Refresh the Power BI dataset to load the latest values.
4️⃣ Use the slicers to filter by month or KPI group.
5️⃣ Drill through to the KPI Definition page for deeper insights.
6️⃣ Review KPI trends on the Trend page to spot performance gaps or growth areas.
No coding or advanced technical skills required — just update, refresh, and analyze! ⚡
👥 Who Can Benefit from This Dashboard
🏢 Business Managers: Track distributor performance across multiple metrics.
💼 Sales Directors: Measure MTD and YTD target achievements.
🏭 Supply Chain Teams: Monitor efficiency and delivery performance.
📊 Financial Analysts: Compare cost, sales, and profit ratios for each distributor.
📦 Distribution Heads: Identify high-performing distributors and improvement areas.
This Power BI dashboard makes distributor management more transparent, measurable, and performance-focused.
🌍 Why Choose This Power BI Dashboard
✔️ Real-Time Visibility: Always stay updated with live metrics and insights.
✔️ Automated Data Integration: Directly connects with Excel or databases.
✔️ Data Accuracy: Reduces manual reporting errors.
✔️ Easy Comparisons: Evaluate performance across months, years, or distributors.
✔️ Scalable Design: Perfect for businesses of all sizes.
✔️ Professional Presentation: Clear visuals ideal for executive meetings or audits.
The Distributor Performance KPI Dashboard in Power BI is your all-in-one solution for transforming distributor data into strategic intelligence — driving accountability, performance, and growth. 🚀
### Click here to read the Detailed blog post
Visit our YouTube channel to learn step-by-step video tutorials


Reviews
There are no reviews yet.