⚡ Power generation companies deal with vast volumes of operational and financial data every day — from fuel expenses and downtime to energy output and profit margins. Managing this data manually often leads to delays and errors. The Power Generation Dashboard in Excel eliminates these problems by turning raw data into crystal-clear visual insights, helping energy leaders make fast, data-driven decisions.
Built entirely in Microsoft Excel, this ready-to-use template gives you an instant view of your organization’s energy performance, cost distribution, and revenue generation — all within a simple, interactive interface. Whether you’re managing multiple plants, monitoring fuel consumption, or analyzing profitability, this dashboard is your all-in-one analytics companion.
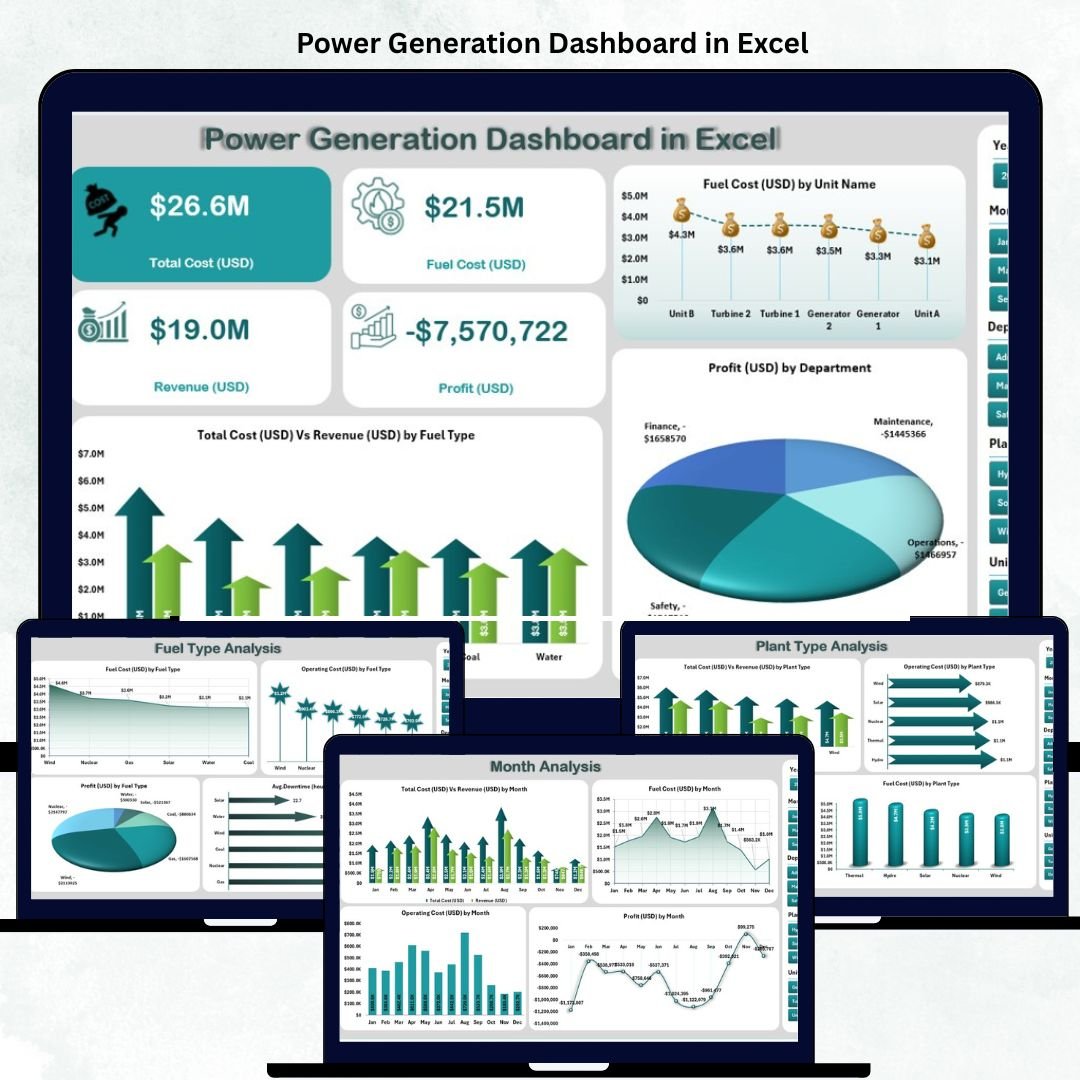
✨ Key Features of the Power Generation Dashboard in Excel
✅ 📋 Page Navigator – A smart, left-side navigation panel lets you jump quickly between dashboard pages for seamless exploration.
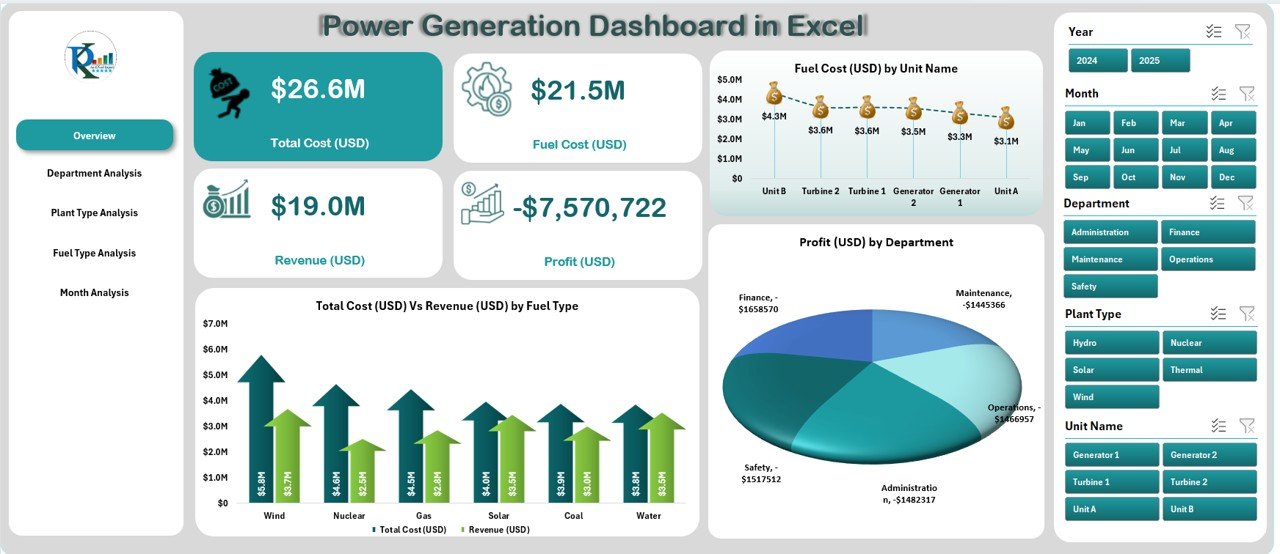
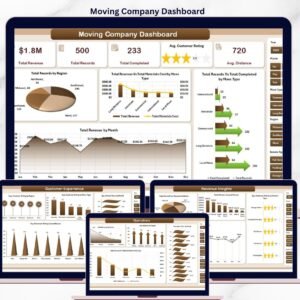
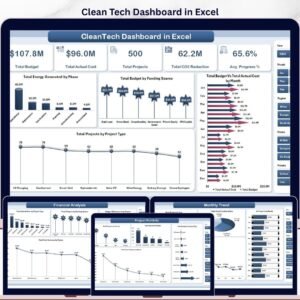
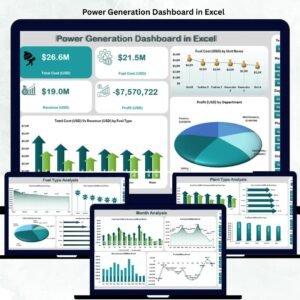
✅ 📊 Overview Page – Displays total cost, revenue, profit, and operating cost cards with interactive charts like:
-
Total Cost (USD) vs. Revenue (USD) by Fuel Type
-
Fuel Cost by Unit Name
-
Profit (USD) by Department
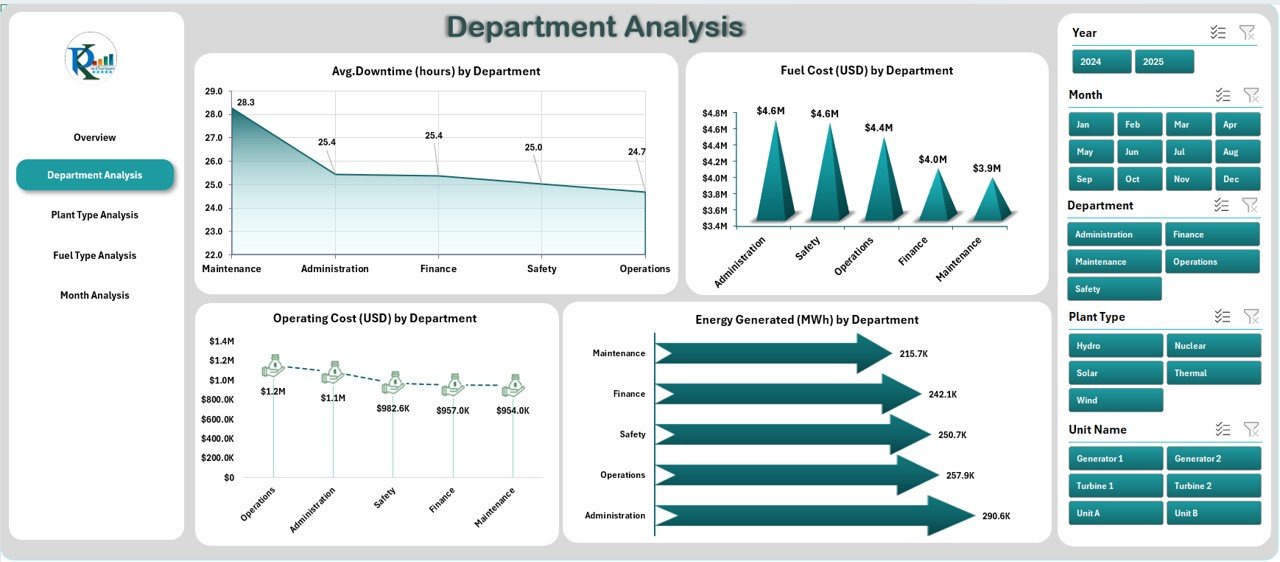
✅ 🏢 Department Analysis Page – Compare performance across departments using visuals for:
-
Average Downtime (Hours)
-
Fuel Cost and Operating Cost by Department
-
Energy Generated (MWh)
Perfect for identifying cost-heavy units and optimizing maintenance cycles.
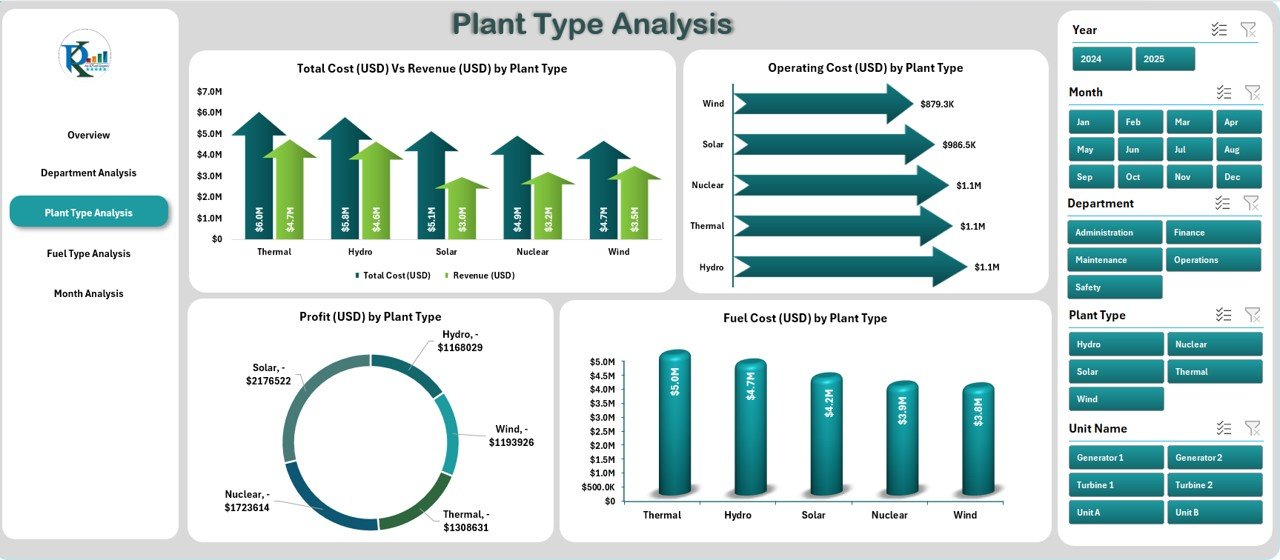
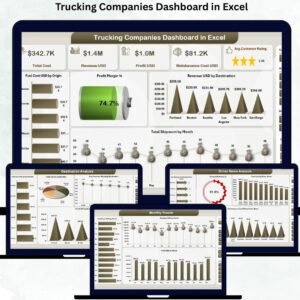
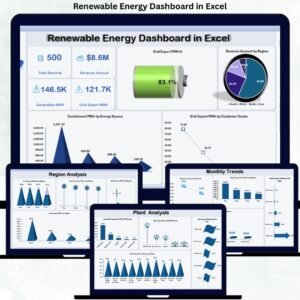
✅ 🏭 Plant Type Analysis Page – Understand ROI across different plant types — thermal, hydro, solar, or wind — through charts like:
-
Total Cost vs. Revenue by Plant Type
-
Operating Cost and Profit by Plant Type
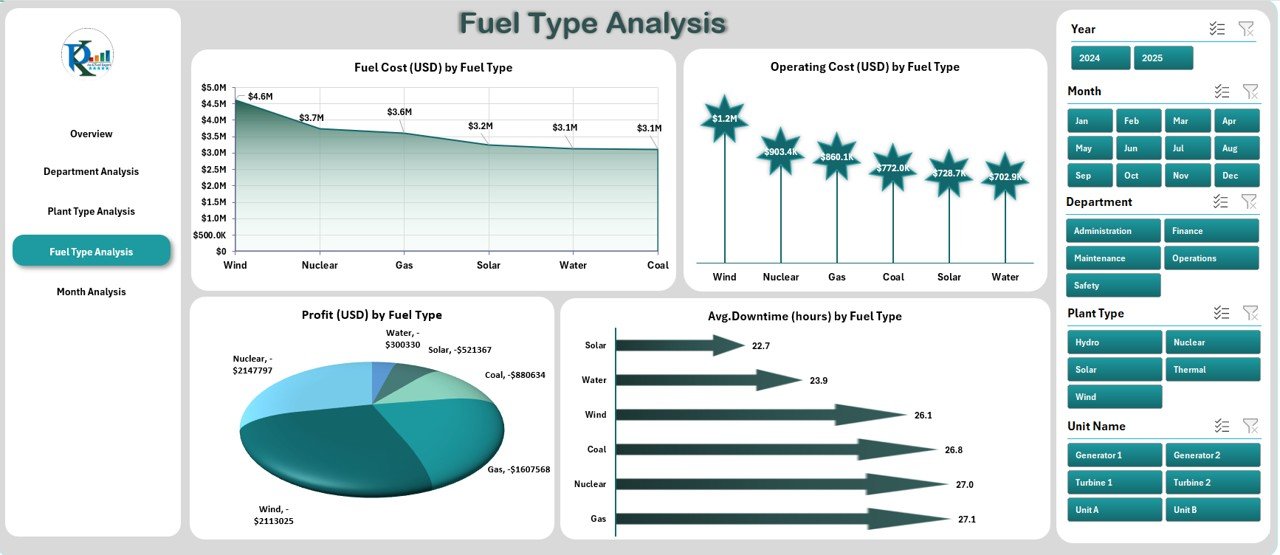
✅ ⛽ Fuel Type Analysis Page – Evaluate energy economics by fuel source. Visualize which fuels yield the best balance between cost, output, and downtime.
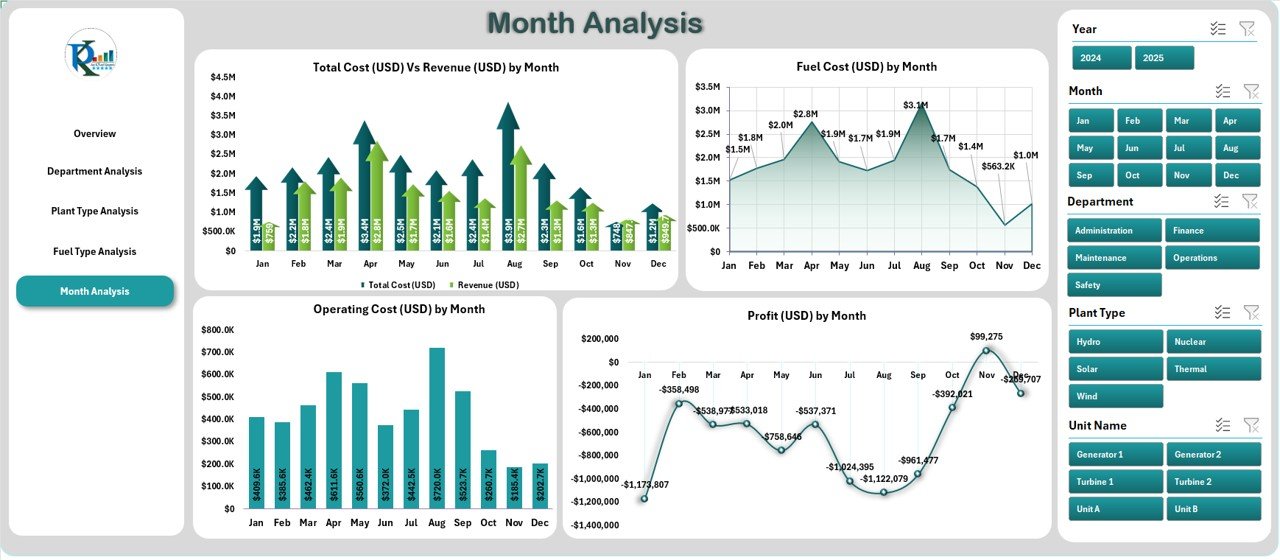
✅ 📅 Month Analysis Page – Monitor performance trends throughout the year with charts comparing monthly cost, revenue, fuel usage, and profit.
✅ 🧮 Support Sheets & Data Foundation – The backend data sheet automatically feeds all visuals through formulas and pivot tables. Just update your raw data — the dashboard refreshes instantly!
✅ ⚙️ Fully Customizable – Modify charts, add KPIs, or insert new categories anytime without coding knowledge.
📦 What’s Inside the Power Generation Dashboard
📁 Five Interactive Analytical Pages:
1️⃣ Overview Page – Financial summary of power generation operations.
2️⃣ Department Analysis – Compare costs, energy output, and downtime.
3️⃣ Plant Type Analysis – Evaluate profitability by plant category.
4️⃣ Fuel Type Analysis – Assess efficiency by energy source.
5️⃣ Month Analysis – Track performance and cost trends over time.
📊 Support Data Sheets:
-
Pre-structured tables for raw data, calculations, and pivot-ready analysis.
-
Automatically linked visuals for real-time updates.
🎯 Built-in Automation:
-
Conditional formatting for quick KPI insights.
-
Pivot charts for dynamic performance tracking.
-
Drop-downs and slicers for flexible filtering.
⚙️ How to Use the Power Generation Dashboard
1️⃣ Enter or import data into the Data Sheet (fuel cost, energy generated, downtime, etc.).
2️⃣ Use the Page Navigator on the left to switch between pages.
3️⃣ View real-time charts for financial, operational, and energy KPIs.
4️⃣ Compare month-to-month performance and identify improvement areas.
5️⃣ Refresh data regularly to keep metrics up to date.
6️⃣ Interpret visuals for decision-making — whether optimizing costs or maximizing output.
💡 Pro Tip: Protect formulas and use conditional formatting to highlight critical downtime or low-profit zones.
👥 Who Can Benefit from This Dashboard
⚡ Energy & Utility Companies – Gain instant visibility into power output and operational efficiency.
🏭 Plant Managers – Monitor downtime, costs, and productivity in real time.
💰 Finance Teams – Track expenses, profit margins, and department-wise performance.
🌿 Renewable Energy Firms – Compare solar, wind, and hydro performance data easily.
📈 Consultants & Analysts – Deliver professional, insight-driven energy reports.
🧩 Executives & Directors – Access high-level financial insights and ROI metrics.
This Excel-based dashboard ensures clarity, control, and cost optimization, empowering every energy professional to make data-backed strategic decisions.


Reviews
There are no reviews yet.