Running a rehabilitation center involves much more than patient treatment — it’s about tracking recovery outcomes, optimizing staff performance, and maintaining operational efficiency. The Rehabilitation Center KPI Dashboard in Google Sheets is your all-in-one solution for doing exactly that. 💪
Built for rehabilitation facilities, therapy centers, and healthcare administrators, this interactive and data-driven dashboard provides real-time visibility into your key performance indicators (KPIs). It empowers you to make smarter, faster, and more strategic decisions — all within an easy-to-use Google Sheets interface.
Unlike complicated software or manual reporting, this ready-to-use template requires zero coding, works entirely online, and can be shared instantly with your team. Whether you want to measure patient recovery, therapy sessions, or staff efficiency, this dashboard helps you track it all — clearly and visually.
✨ Key Features of Rehabilitation Center KPI Dashboard in Google Sheets
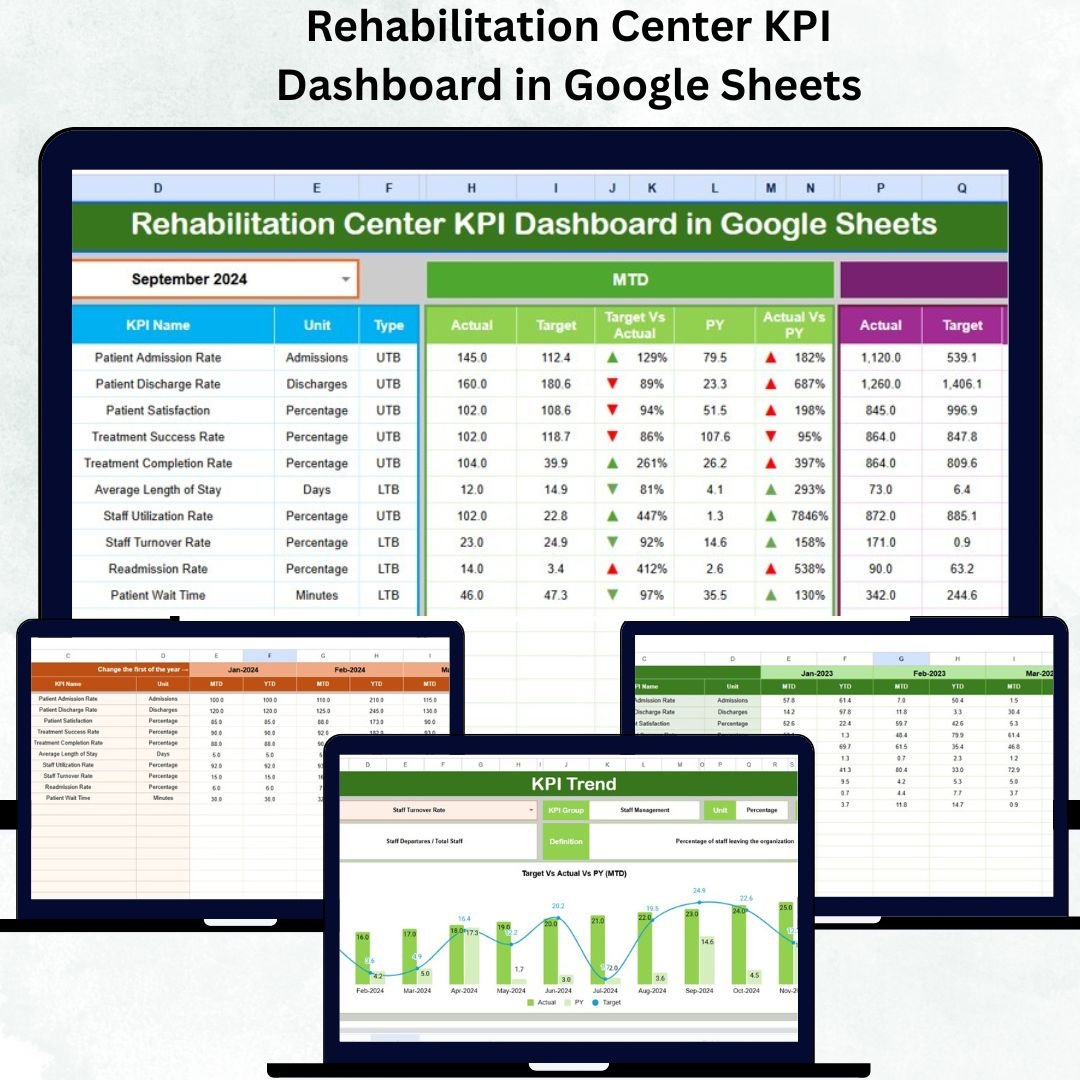
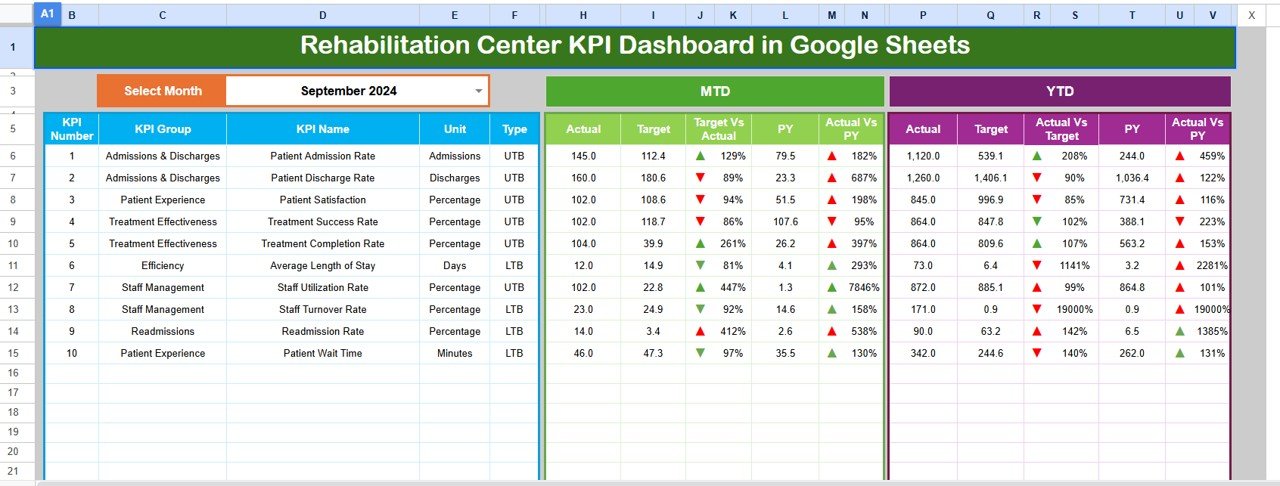
📊 Dynamic Dashboard Page – Analyze your performance instantly. A simple month selector updates all KPIs automatically, displaying both MTD (Month-To-Date) and YTD (Year-To-Date) data for quick insights.
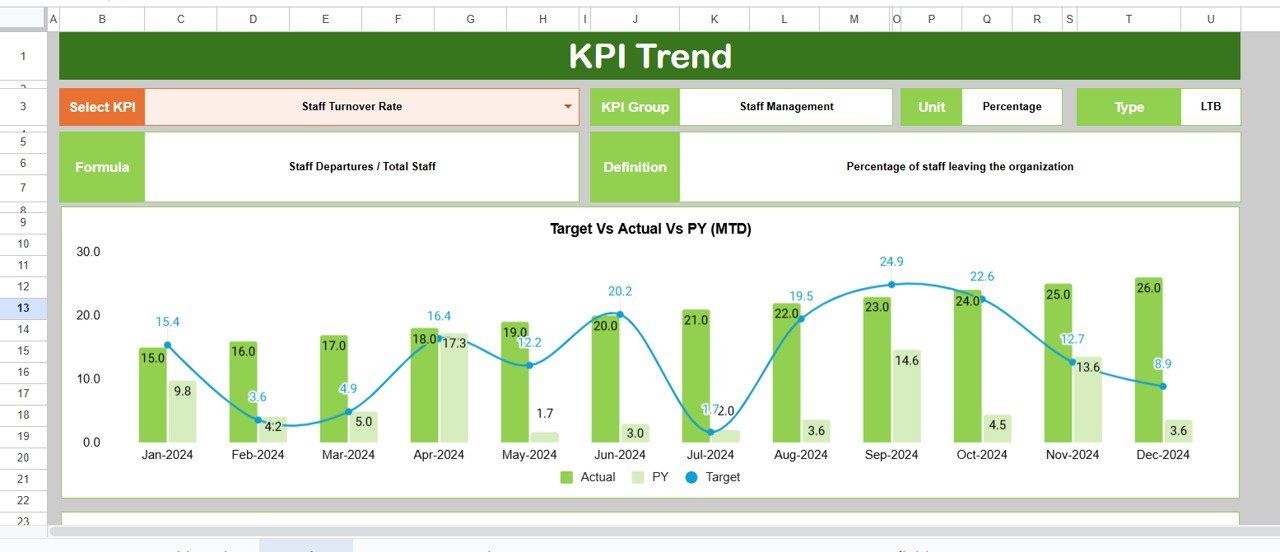
📈 Real-Time Trend Analysis – View interactive KPI trend charts comparing Actual, Target, and Previous Year (PY) data to identify progress or areas needing attention.
📋 Target vs Actual Tracking – Track how well your rehabilitation center meets its monthly and yearly targets with visual variance indicators and color-coded arrows.
📁 Comprehensive Data Tabs – Six organized worksheets for Dashboard, Trend, Actual Numbers, Targets, Previous Year Data, and KPI Definitions keep your analytics clean and structured.
☁️ Cloud-Based & Collaborative – Work seamlessly with your team from anywhere, at any time, using the collaborative power of Google Sheets.
🔧 Easy Customization – Modify KPIs, formulas, and definitions to match your center’s unique goals — whether physiotherapy outcomes, counseling success, or occupancy rates.
📊 Automatic Variance Calculations – Instantly compare performance across years to evaluate growth, improvements, and areas needing focus.
🧠 Data-Driven Decisions – Turn raw data into actionable insights that help improve patient satisfaction, operational efficiency, and overall outcomes.
📂 What’s Inside the Rehabilitation Center KPI Dashboard
🗂️ Dashboard Sheet Tab – The main analytical page with all KPI summaries, trend arrows, and variance highlights.
📈 Trend Sheet Tab – A detailed view with a KPI selector and comparative trend charts to monitor growth and seasonal patterns.
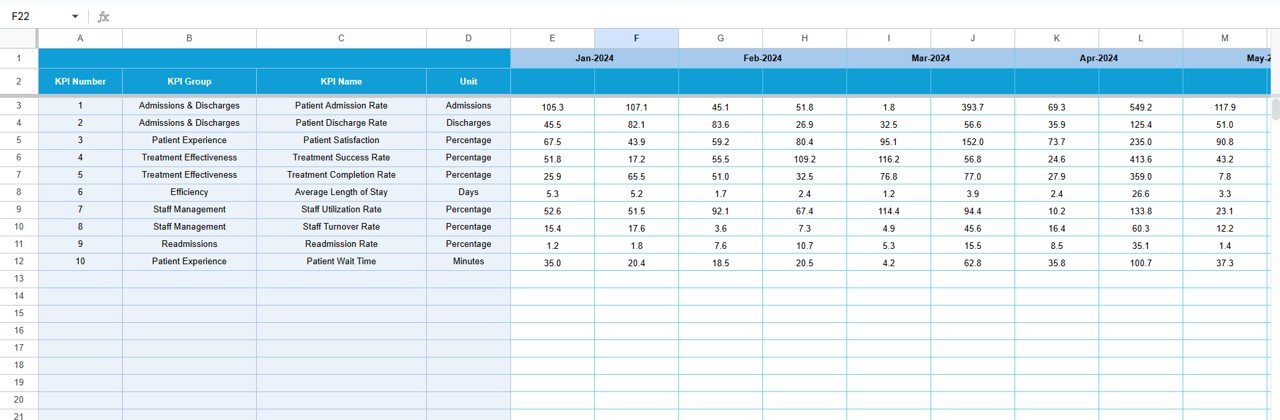
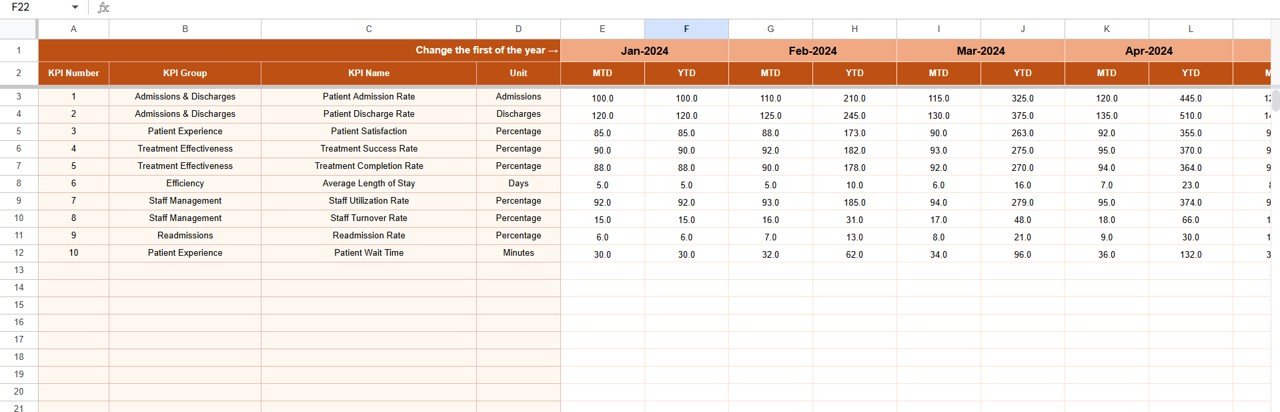
🧾 Actual Numbers Input Sheet – Input your actual monthly results for each KPI with MTD and YTD breakdowns.
🎯 Target Sheet Tab – Record monthly and yearly goals to track progress toward defined performance benchmarks.
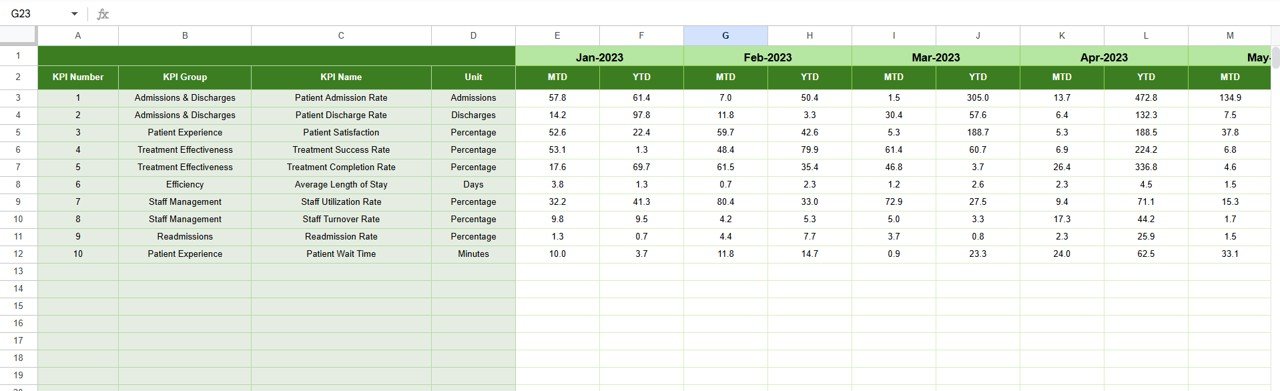
📅 Previous Year Sheet – Store historical data to automatically calculate and visualize year-over-year differences.
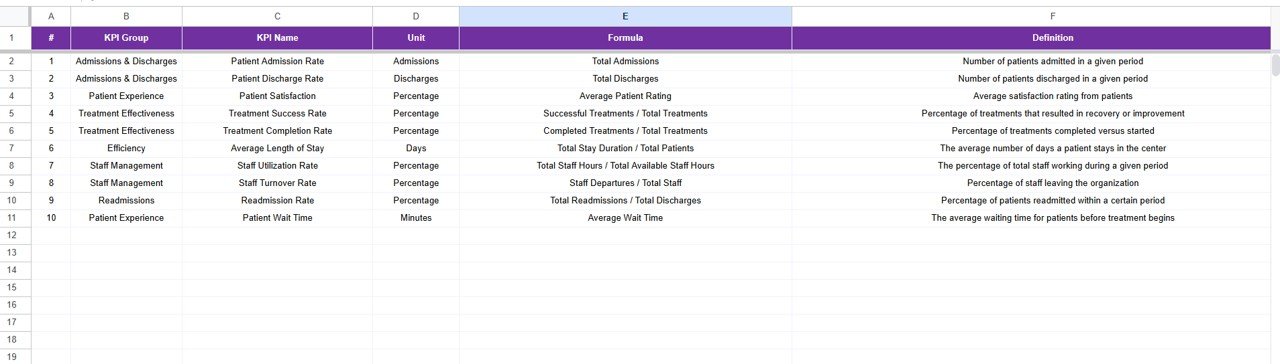
📘 KPI Definition Sheet – A clear reference for each KPI, including Group, Unit, Formula, Definition, and Type (UTB or LTB).
Together, these sheets form a robust system that helps rehabilitation centers maintain transparency and continuous improvement.
⚙️ How to Use the Rehabilitation Center KPI Dashboard
1️⃣ List Your KPIs: Begin by entering all relevant KPIs in the KPI Definition Sheet — such as Patient Recovery Rate, Therapy Attendance, or Readmission Rate.
2️⃣ Set Targets: Define monthly goals for each KPI in the Target Sheet to establish performance expectations.
3️⃣ Enter Actual Data: Input your monthly figures in the Actual Numbers Sheet for real-time tracking.
4️⃣ Add Previous Year Data: Include last year’s data to enable year-over-year comparison.
5️⃣ View the Dashboard: Choose any month in the Dashboard Tab (cell D3) to instantly view updated metrics and performance trends.
6️⃣ Analyze Trends: Use the Trend Sheet to identify strengths, weaknesses, and seasonal variations.
💡 The entire process is automated and requires no technical skills — perfect for any healthcare or rehabilitation professional.
👥 Who Can Benefit from This Rehabilitation Center KPI Dashboard
🏥 Rehabilitation Centers & Clinics – Monitor patient recovery and therapy success rates effortlessly.
🧑⚕️ Healthcare Administrators – Manage staff performance and facility efficiency with clarity.
💼 Operations & Finance Teams – Track cost efficiency, bed occupancy, and service quality.
📊 Therapists & Counselors – Measure session effectiveness and identify improvement areas.
🌐 Multi-Branch Networks – Consolidate data from multiple centers into one centralized reporting system.
Whether you run a small rehab center or a large healthcare institution, this Google Sheets dashboard ensures data transparency, accountability, and measurable progress.


Reviews
There are no reviews yet.