In the fast-paced and data-driven steel and metals industry, every decision depends on accurate numbers — from production output to energy consumption, from safety performance to supply chain reliability. Managing all these metrics effectively can be complex — unless you have the right analytics tool.
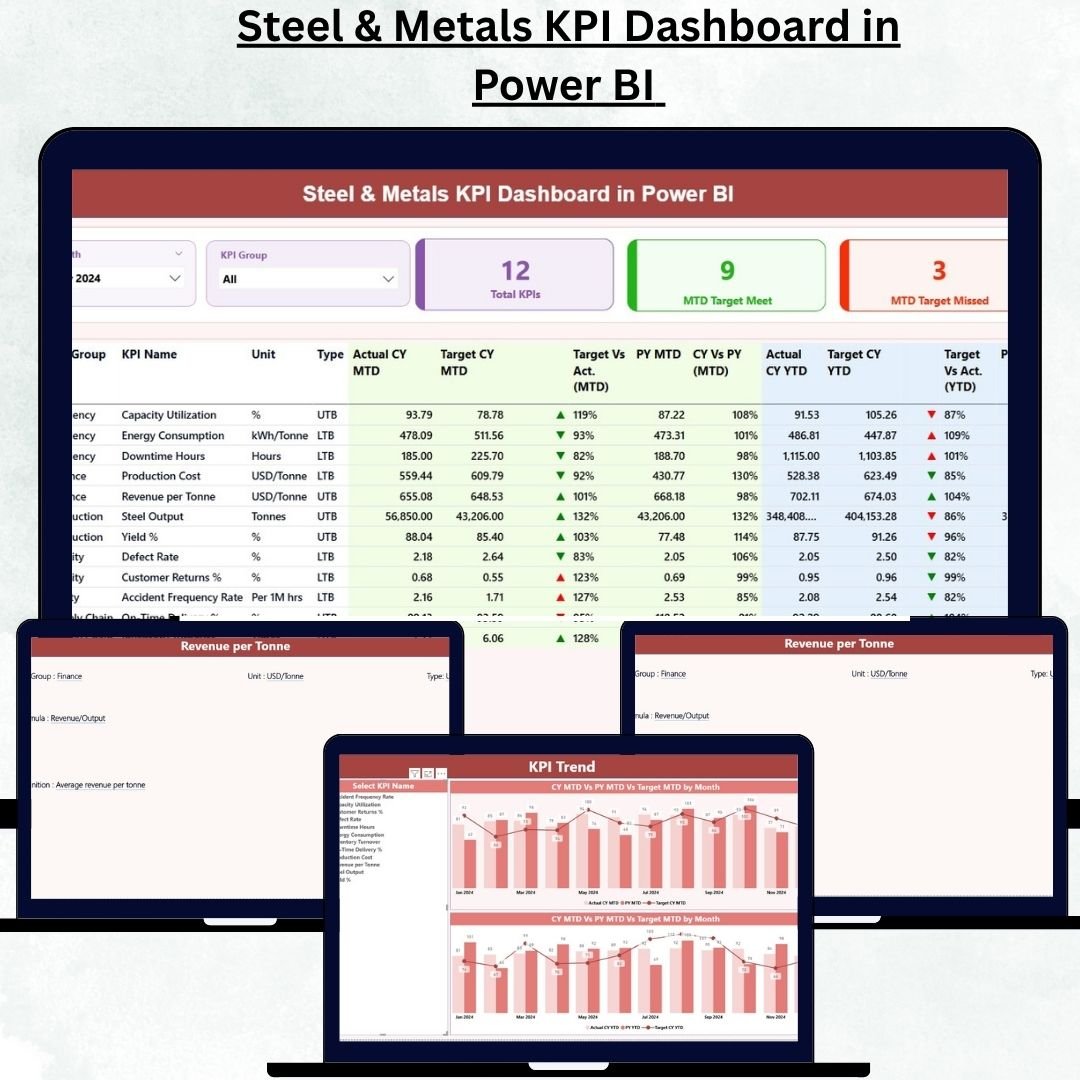
The Steel & Metals KPI Dashboard in Power BI is a ready-to-use performance management solution that transforms raw Excel data into interactive, real-time visual insights. It enables production managers, quality engineers, and executives to monitor, compare, and improve performance across departments, ensuring smarter and faster decision-making.
With this Power BI dashboard, organizations can visualize key performance indicators (KPIs), identify bottlenecks, track monthly and yearly progress, and ensure alignment with operational targets. Built for both small plants and large manufacturers, this tool delivers clarity, transparency, and efficiency — all in one place.
⚙️ Key Features of the Steel & Metals KPI Dashboard in Power BI
📊 Three Interactive Pages – Summary Page, KPI Trend Page, and KPI Definition Page.
🎯 Real-Time Insights – View actual vs. target values dynamically with automated visuals.
📅 Month Selector – Choose the reporting month and refresh KPIs instantly.
🧩 KPI Group Filter – Analyze performance by Production, Quality, Energy, Safety, or Supply Chain.
📈 MTD & YTD Trends – Compare Month-to-Date and Year-to-Date performance at a glance.
🔍 Drill-Through Analysis – Access detailed KPI definitions, formulas, and calculations.
📘 Excel-Integrated Source – Update input sheets easily (Actual, Target, Definition).
💡 Color-Coded Indicators – Instantly distinguish between achieved and missed targets.
🚀 Automated Refresh – No manual calculations — just refresh and view.
📱 Scalable Design – Ideal for plants, corporate offices, and regional dashboards.
🧭 Dashboard Structure and Pages
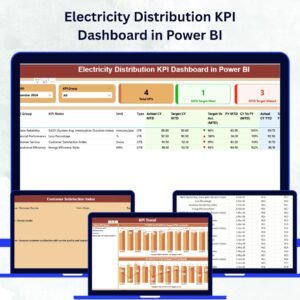
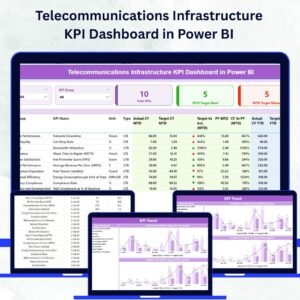
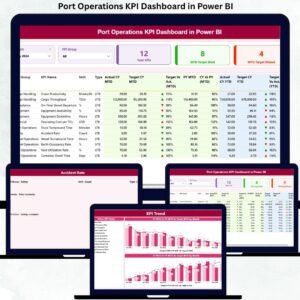
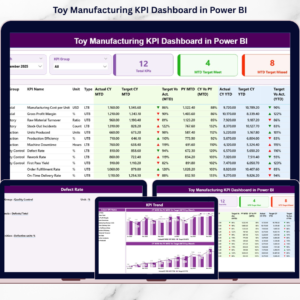
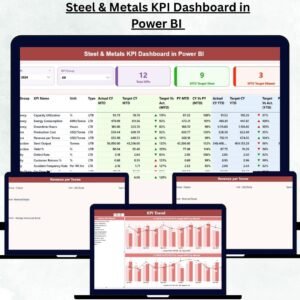
🏠 1️⃣ Summary Page – The Central Performance Hub
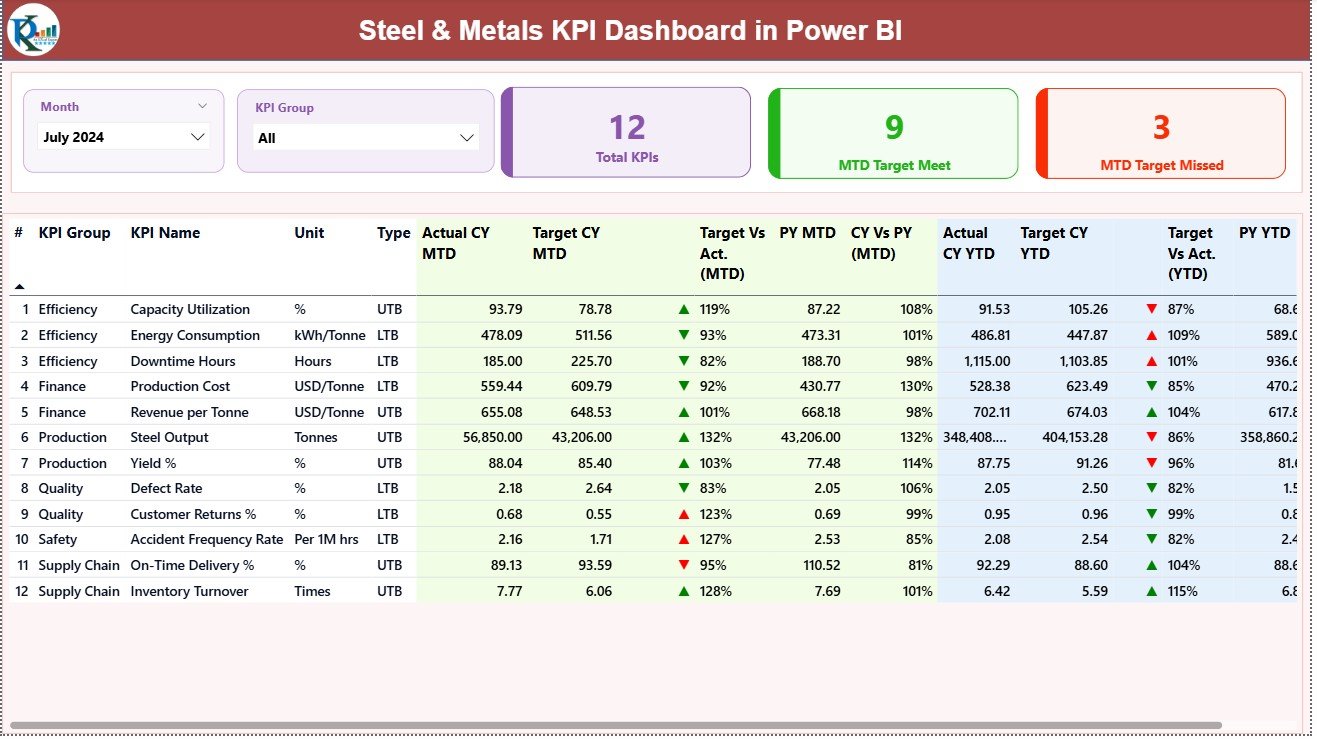
The Summary Page provides a complete overview of operational performance in one view.
It includes:
-
Month Selector for real-time filtering.
-
KPI Group Slicer to view metrics by category (e.g., Production, Safety, Quality).
-
Three summary cards:
-
Total KPI Count
-
MTD Target Met Count
-
MTD Target Missed Count
-
Below, interactive charts and tables display detailed KPI-level performance, highlighting improvement areas and deviations from targets.
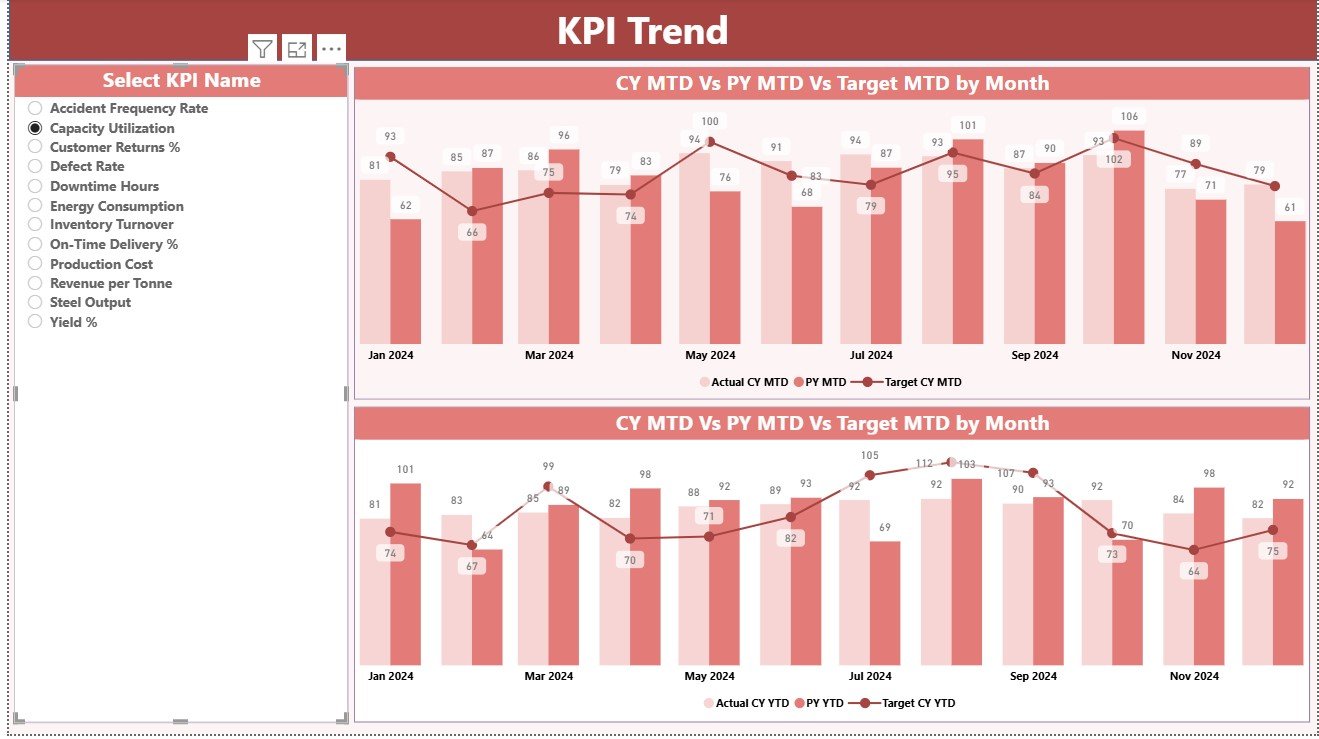
📈 2️⃣ KPI Trend Page – Analyze Performance Over Time
This page is dedicated to time-based analysis.
-
Select any KPI from a dropdown menu to view its history.
-
MTD Chart: Compare current vs. previous year actual and target values.
-
YTD Chart: See cumulative results for deeper trend evaluation.
These combo charts help identify consistent performers, seasonal dips, or process inefficiencies — making it easier to forecast future performance.
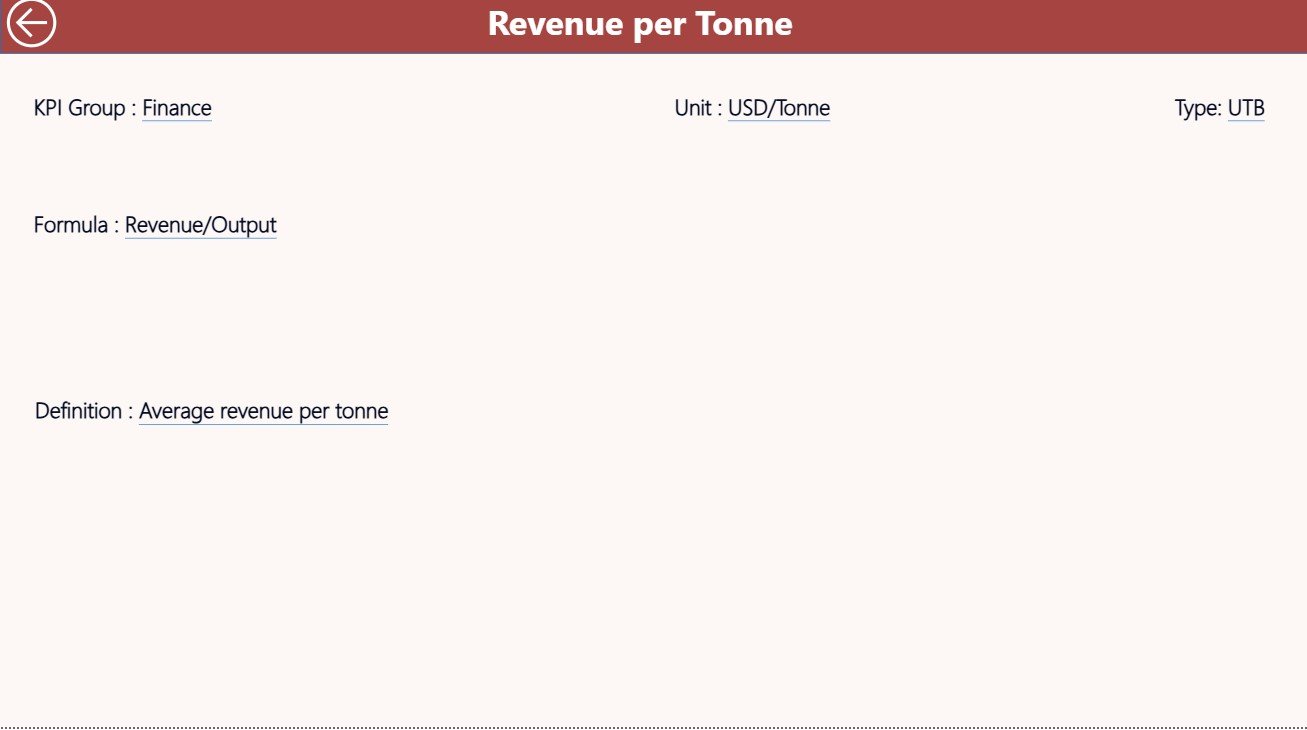
📘 3️⃣ KPI Definition Page – The Knowledge Base
A drill-through page that displays detailed information about each KPI:
-
Formula and calculation method
-
Unit of measurement
-
Definition and interpretation
-
Type (UTB – Upper the Better, LTB – Lower the Better)
This ensures data standardization and transparency across departments.
💾 Excel Data Source (Input Sheets)
The Power BI dashboard is powered by a structured Excel file with three main sheets:
1️⃣ Input_Actual Sheet – Records monthly MTD and YTD actual performance.
2️⃣ Input_Target Sheet – Stores MTD and YTD target values.
3️⃣ KPI Definition Sheet – Contains KPI names, formulas, and definitions.
Simply update your Excel file, refresh Power BI, and view updated insights instantly.
⚙️ Advantages of the Steel & Metals KPI Dashboard in Power BI
✅ Centralized KPI Management – View all performance data in one visual dashboard.
✅ Real-Time Insights – Get instant updates as soon as new data is uploaded.
✅ Error-Free Reporting – Automated calculations reduce human error.
✅ Better Decision-Making – Compare actual vs. target to plan improvement strategies.
✅ Transparent Communication – Share standardized metrics across teams.
✅ Efficiency Gains – Save time spent on manual reporting and spreadsheet analysis.
✅ Scalable and Flexible – Expandable from Excel-based tracking to live ERP data integration.
🏭 Use Cases in the Steel & Metals Industry
⚙️ Production: Track yield, capacity utilization, and machine downtime.
🔩 Quality Control: Monitor defect rates, rework %, and customer complaints.
⚡ Energy Management: Analyze energy usage per ton and savings achieved.
🦺 Safety: Measure incident frequency, lost-time injuries, and compliance rates.
🚚 Supply Chain: Track on-time delivery, transport costs, and supplier quality performance.
This 360° view empowers leadership teams to optimize efficiency, reduce costs, and maintain high operational standards.
🧠 Best Practices for Using the Dashboard
📌 Keep data consistent — use standardized KPI names and units.
📌 Refresh Power BI after every data update.
📌 Use green/red color codes consistently for clarity.
📌 Review KPI trends monthly for continuous improvement.
📌 Train department heads to interpret dashboard visuals.
🚀 Opportunities for Enhancement
🔹 Add forecasting and predictive models using Power BI AI tools.
🔹 Connect to live ERP/MES systems for automated updates.
🔹 Include department-specific sub-dashboards.
🔹 Add alerts for KPIs below target thresholds.
🔹 Optimize visuals for mobile devices.
👥 Who Can Benefit
🏭 Production Managers – Track yield and capacity efficiency.
⚙️ Quality Teams – Monitor defect and compliance KPIs.
💡 Operations Heads – Align process performance with targets.
📊 Executives & Analysts – Gain strategic insights from real-time data.
🔋 Energy & Safety Officers – Measure sustainability and safety compliance.


Reviews
There are no reviews yet.