In today’s corporate landscape, audit management is essential for ensuring compliance, accountability, and operational excellence. The Corporate Audit Dashboard in Excel is your one-stop solution for tracking, analyzing, and managing all audit activities — all within a dynamic Excel interface.Corporate Audit Dashboard in Excel
This ready-to-use dashboard template transforms complex audit data into insightful visuals, KPI cards, and trend charts, allowing business leaders to monitor audit performance and make data-driven decisions quickly and efficiently.
✨ Key Features of Corporate Audit Dashboard in Excel
✅ All-in-One Dashboard: Consolidates audits, findings, recommendations, and cost impacts in one organized Excel file.
✅ Interactive Analytics: Use slicers to filter by month, department, risk level, or audit type instantly.
✅ Dynamic Visuals: Visualize audit outcomes through professional charts, graphs, and progress indicators.
✅ Automated Calculations: Instantly updates KPIs and charts when new data is entered in the Data Sheet.
✅ Department, Location & Type Analysis: Dive deep into how audits perform across various business units.
✅ Monthly Trend Monitoring: Track progress over months and identify recurring issues or seasonal trends.
✅ No Coding Required: Built entirely using Excel formulas, pivot tables, and conditional formatting.
✅ Printable & Presentable: Perfect for board reviews, audit committee meetings, and compliance reports.
📦 What’s Inside the Corporate Audit Dashboard
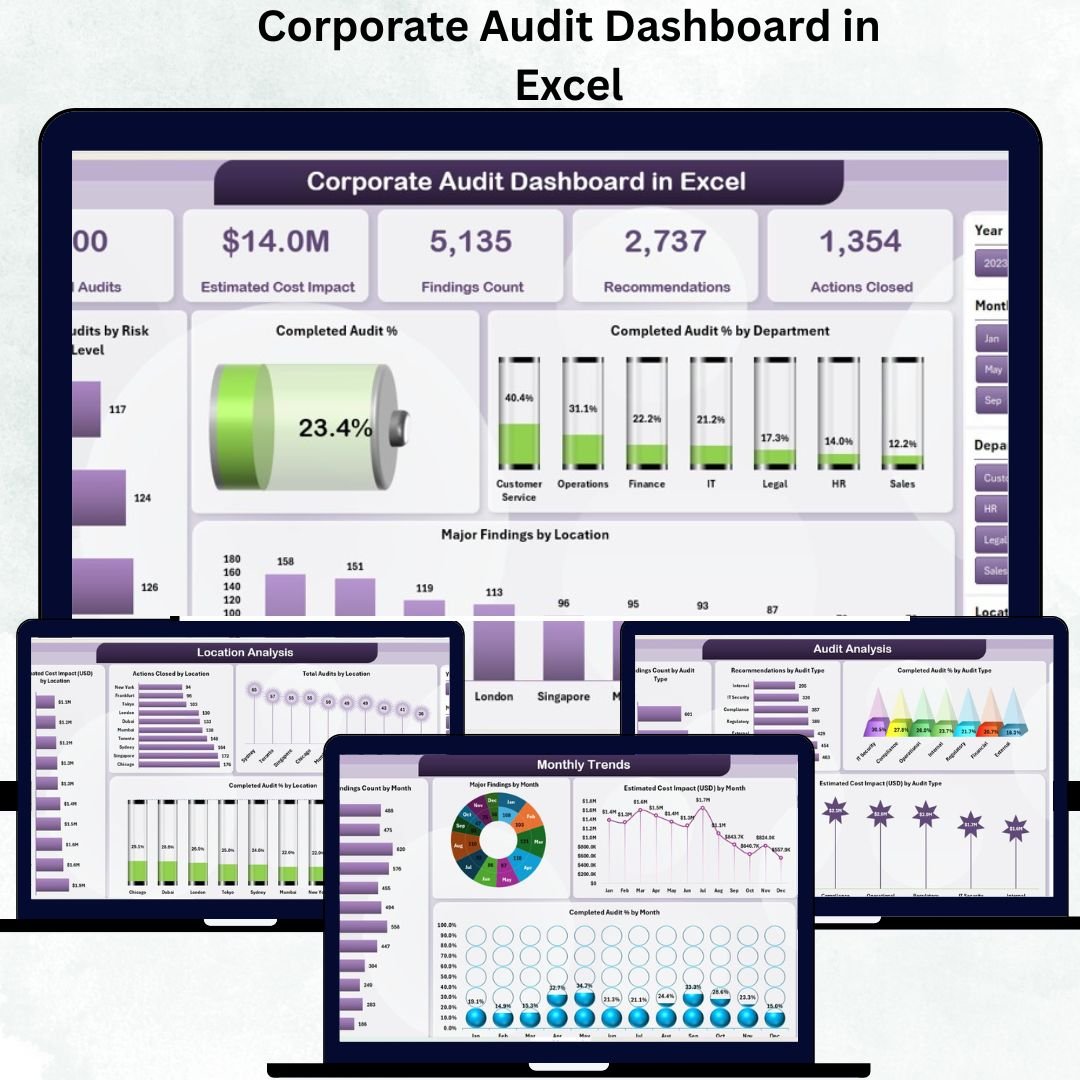
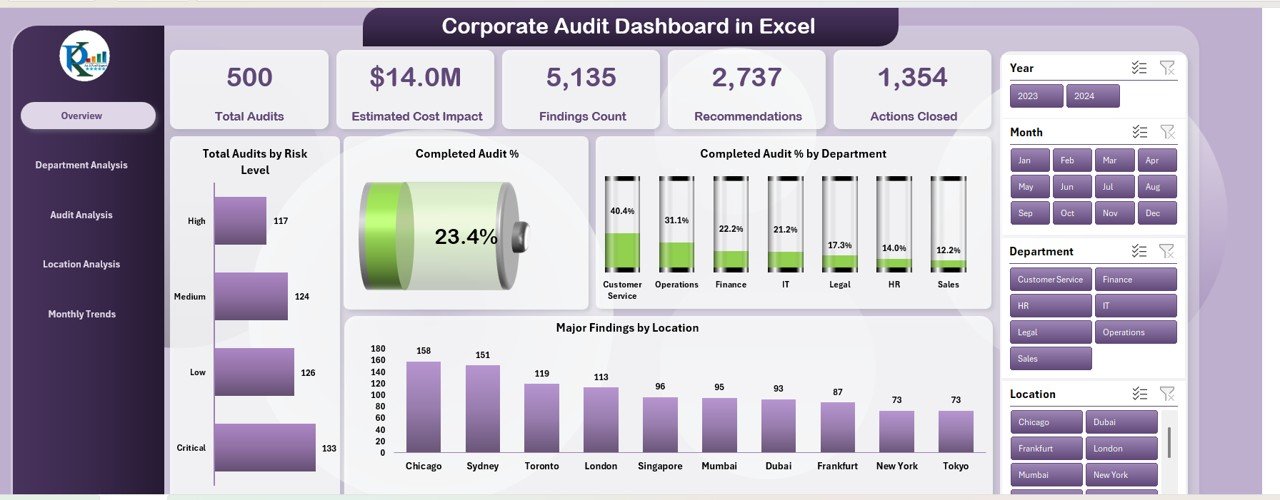
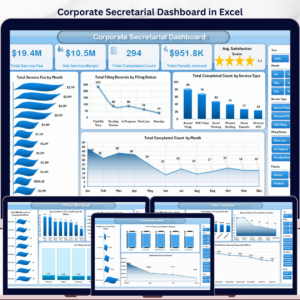
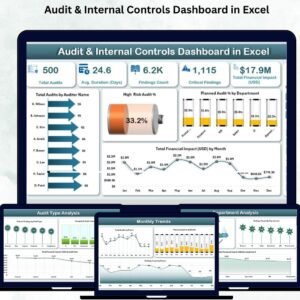
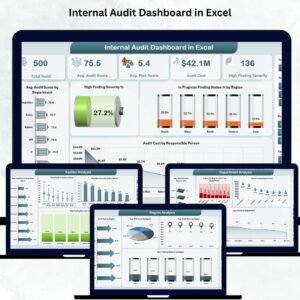
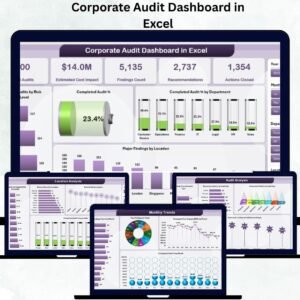
🗂 Overview Sheet:
Shows a quick summary through KPI cards for Total Audits, Estimated Cost Impact (USD), Findings Count, Recommendations, and Actions Closed. Charts include “Total Audits by Risk Level,” “Completed Audit %,” and “Major Findings by Location.”
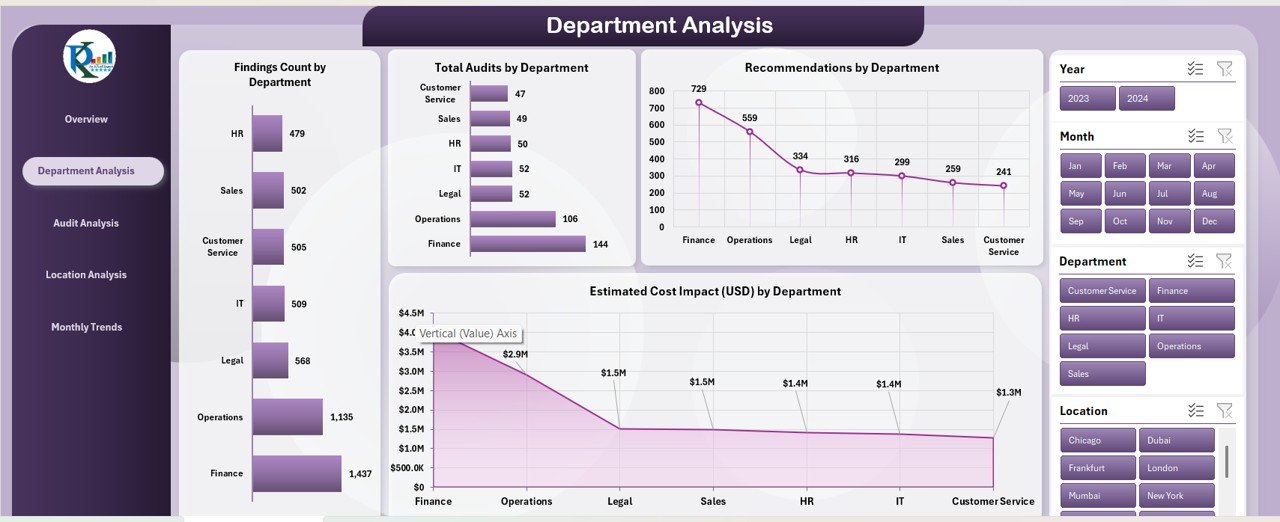
🏢 Department Analysis Sheet:
Displays Findings Count by Department, Total Audits, Recommendations, and Estimated Cost Impact (USD) — helping identify departments that need more focus.
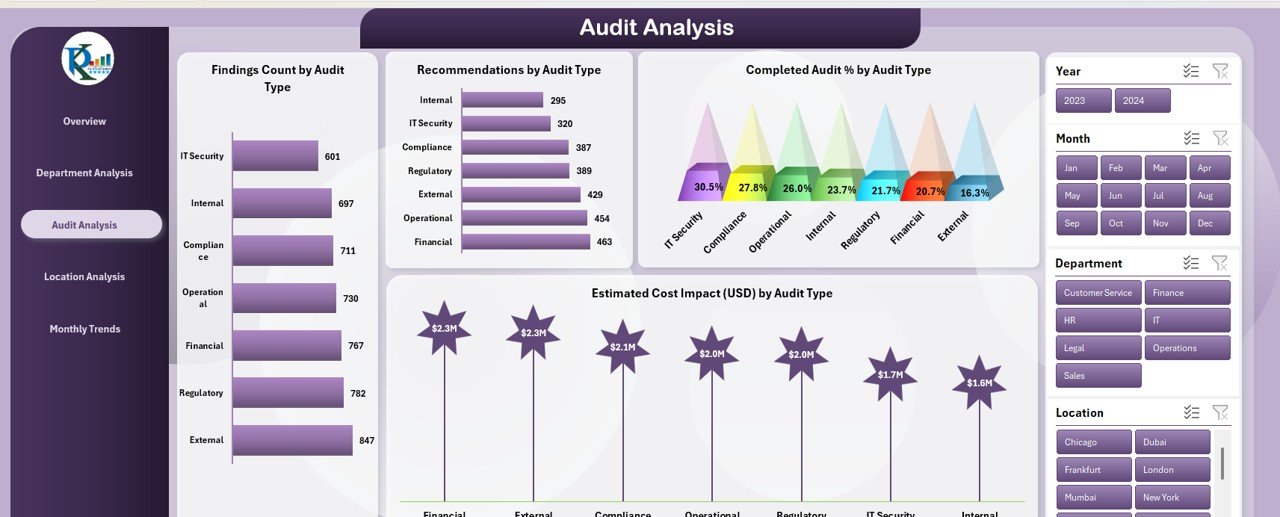
📋 Audit Analysis Sheet:
Compares performance across Internal, Compliance, Financial, or Process Audits through charts such as “Completed Audit %” and “Estimated Cost Impact by Audit Type.”
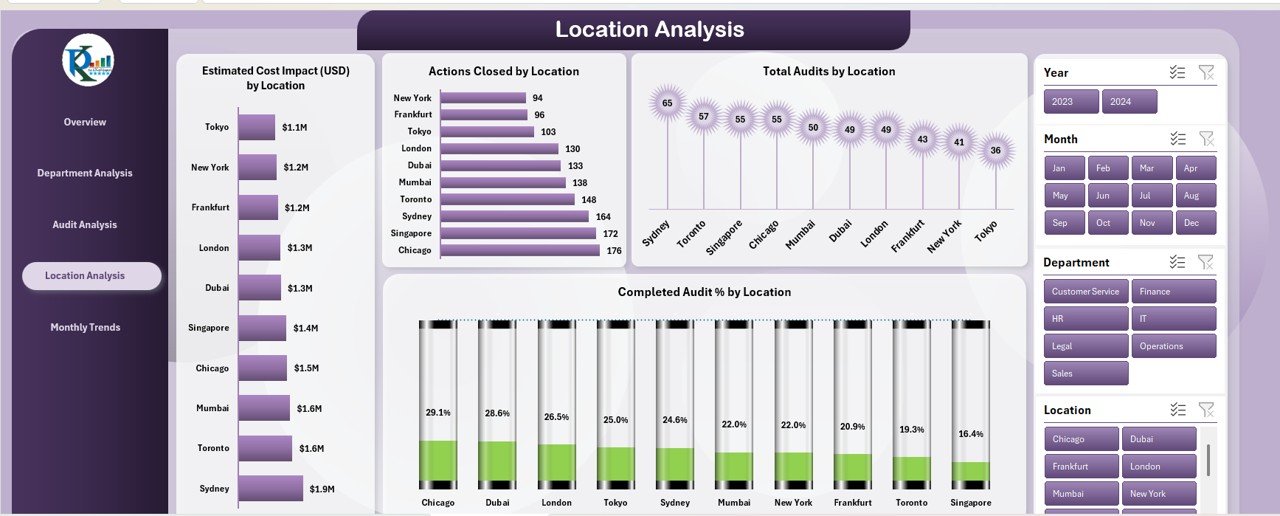
📍 Location Analysis Sheet:
Highlights regional audit outcomes with visuals for Actions Closed by Location and Cost Impact by Branch.
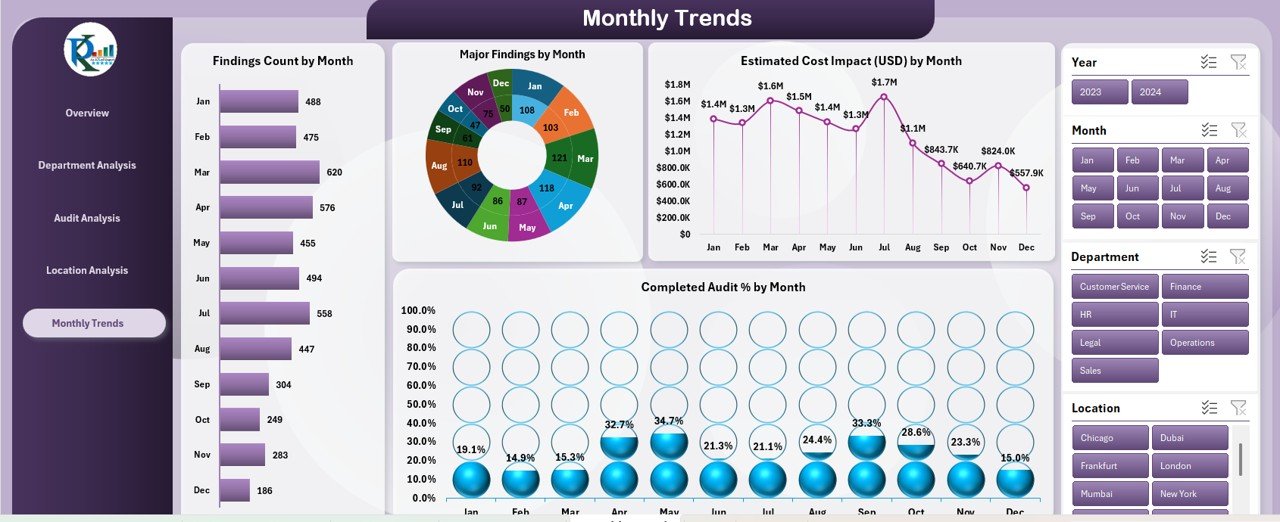
📅 Monthly Trends Sheet:
Tracks Findings Count, Completed Audit %, and Estimated Cost Impact month by month for better forecasting and performance review.
📑 Data Sheet Tab:
A structured table to input audit data — including Audit ID, Type, Department, Findings, Recommendations, and Completion Status. The dashboard automatically refreshes visuals as you update data.
⚙️ How to Use the Corporate Audit Dashboard
1️⃣ Open the Data Sheet tab and enter your audit details.
2️⃣ Navigate to the Overview page to view KPIs and visuals.
3️⃣ Use slicers to filter by month, department, or risk level.
4️⃣ Explore Department, Audit, and Location Analysis for deeper insights.
5️⃣ Review Monthly Trends to evaluate progress or highlight problem areas.
Within minutes, you can turn complex spreadsheets into a visual audit summary ready for presentations or management reviews.
👥 Who Can Benefit from This Dashboard
👨💼 Internal Auditors: Streamline audit tracking and reduce manual effort.
🏢 Corporate Executives: Get instant insights into audit risks, cost impacts, and completion rates.
📊 Compliance Teams: Monitor adherence to internal and external standards effortlessly.
💼 Finance Managers: Identify high-cost audit areas and optimize budget allocation.
🏭 Operations & Risk Teams: Detect recurring issues early and improve preventive actions.
📈 Consultants & Analysts: Present professional, visual audit reports for multiple clients.
Whether your organization runs financial audits, compliance checks, or process reviews, this Excel dashboard adapts seamlessly to your workflow.
Click here to read the Detailed Blog Post
Watch the step-by-step video tutorial:
Visit our YouTube channel to learn step-by-step video tutorials


Reviews
There are no reviews yet.