In the fight against climate change, data-driven sustainability is the key to real progress. Whether you’re a business, government body, or non-profit organization, tracking your environmental performance is critical to achieving measurable results.
That’s where the Climate Action KPI Scorecard in Excel comes in — a smart, structured, and ready-to-use template designed to help organizations measure and monitor their environmental performance with precision.
Built entirely in Microsoft Excel, this scorecard transforms raw sustainability data into visual insights across energy, waste, water, and emissions. It’s ideal for ESG teams, sustainability officers, and environmental managers aiming to achieve net-zero goals, optimize resource usage, and ensure transparency in reporting.
With dynamic charts, conditional formatting, and automatic calculations, this Excel-based solution empowers decision-makers to act on data — not assumptions.
⚙️ Key Features of the Climate Action KPI Scorecard in Excel
🌎 Comprehensive Climate Dashboard – Monitor carbon emissions, energy usage, waste, and water performance in one view.
📊 Month & Year Analysis – Switch easily between Month-to-Date (MTD) and Year-to-Date (YTD) comparisons.
🎯 Actual vs Target Tracking – Instantly identify which KPIs meet or miss targets with visual indicators.
💡 Color-Coded Indicators – Green for progress, red for attention — simplifying sustainability reporting.
📈 Trend Charts – View historical patterns to analyze seasonal or long-term performance.
📘 KPI Definition Sheet – Standardize metrics with clear formulas, definitions, and measurement units.
📂 Centralized Data Entry – Input, update, and store all climate metrics in structured Excel sheets.
🔄 Fully Customizable – Add or modify KPIs as per your sustainability framework or reporting needs.
💻 No Additional Software Required – 100% Excel-based with automated visual updates.
♻️ Supports ESG & SDG Reporting – Perfectly aligns with corporate sustainability frameworks.
📂 What’s Inside the Climate Action KPI Scorecard
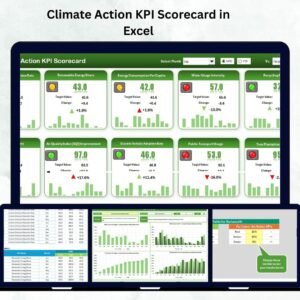
🌱 1️⃣ Scorecard Sheet – The Main Climate Dashboard
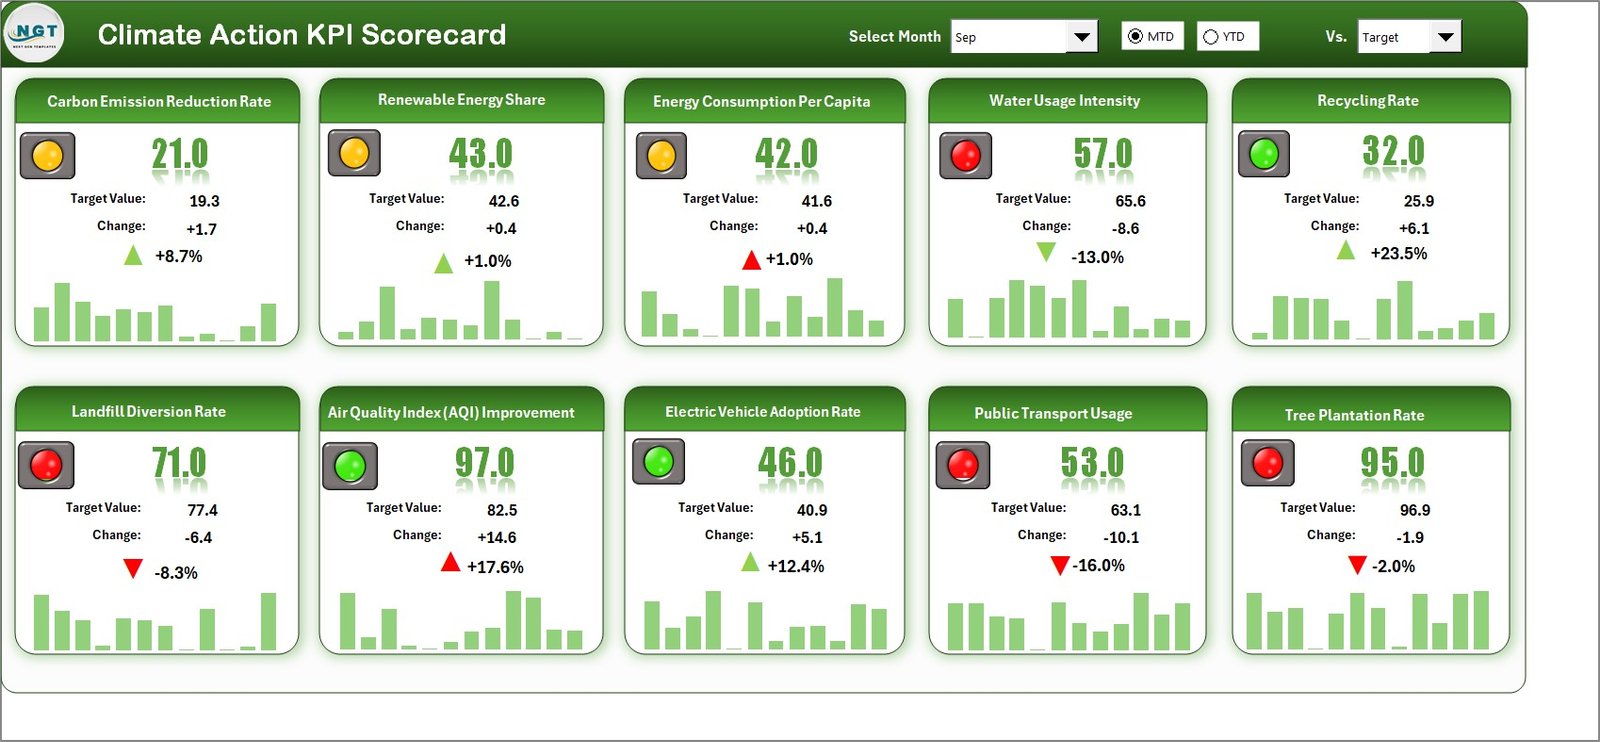
The Scorecard Sheet is your real-time control center.
-
Choose MTD or YTD view using dropdowns.
-
Compare actual vs target values across key KPIs.
-
See results instantly with green/red visual cues.
-
Review metrics for energy, water, waste, and emissions at a glance.
📈 2️⃣ KPI Trend Sheet – Analyze Environmental Progress Over Time
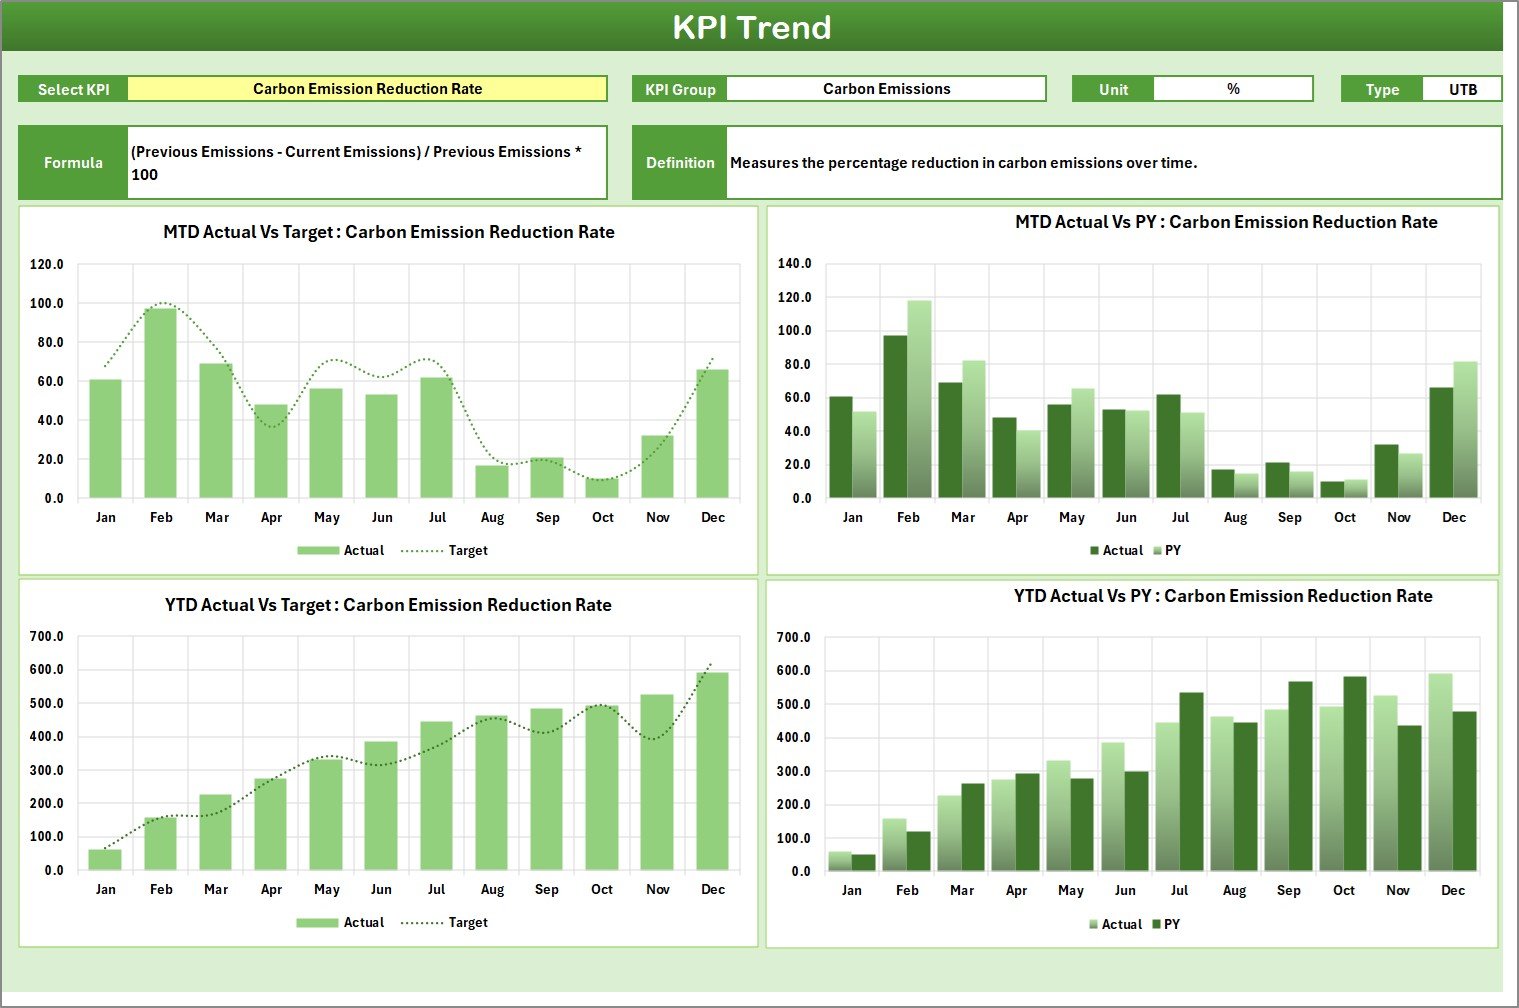
Select a KPI (cell C3) to view detailed trends via dual charts — MTD and YTD.
Includes KPI group, unit, formula, and type (UTB or LTB).
Perfect for tracking progress in emissions reduction or renewable energy use.
📋 3️⃣ Input Data Sheet – Centralized Data Management
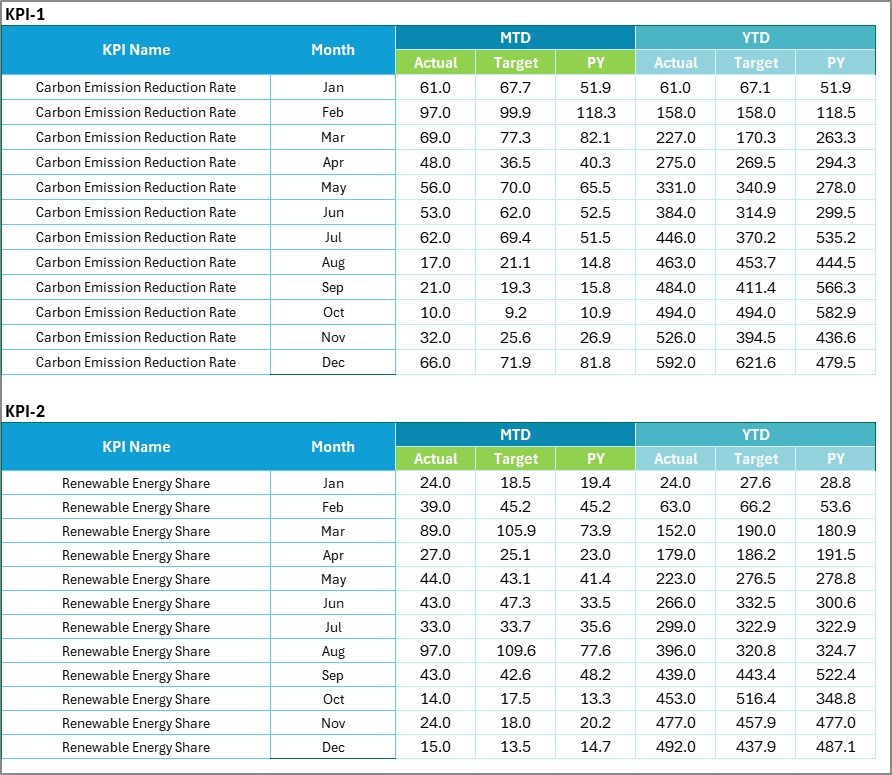
Record monthly actuals and targets for each KPI.
Data automatically feeds into all dashboard visuals for real-time accuracy.
📘 4️⃣ KPI Definition Sheet – Reference & Clarity
Lists all KPIs with their formulas, definitions, and measurement units to maintain consistency across teams and reports.
🌍 Sample KPIs Included
⚡ Energy & Efficiency KPIs
-
Total Energy Consumption (kWh)
-
Renewable Energy Share (%)
-
Energy Savings Achieved (%)
🌫️ Carbon & Emissions KPIs
-
Total Greenhouse Gas Emissions (tons CO₂e)
-
Carbon Offset Contribution (tons compensated)
-
Scope 1, 2, and 3 Emissions (%)
🗑️ Waste & Recycling KPIs
-
Waste Recycled (%)
-
Waste to Landfill (tons)
-
Hazardous Waste Reduction (%)
💧 Water Management KPIs
-
Water Consumption (liters/employee)
-
Wastewater Reuse (%)
-
Water Efficiency Improvement (%)
🌿 Sustainability & Awareness KPIs
-
Employee Climate Awareness Training (%)
-
Green Initiatives Implemented
-
Climate Risk Mitigation Plans Completed
🌟 Advantages of Using the Climate Action KPI Scorecard
✅ Centralized Climate Management – One platform for all sustainability data.
✅ Real-Time Insights – Quickly identify underperforming areas.
✅ Data-Driven Decision-Making – Make informed sustainability and investment choices.
✅ Compliance & Accountability – Support ESG, SDG, and CSR reporting.
✅ Visual Storytelling – Present complex environmental data clearly.
✅ Easy Customization – Add KPIs or modify existing ones without disrupting structure.
✅ Perfect for All Organizations – From startups to large corporations.
🧠 Best Practices for Effective Use
📌 Set SMART goals for each KPI (Specific, Measurable, Achievable, Relevant, Time-bound).
📌 Update data monthly for accurate tracking.
📌 Validate your source data before reporting.
📌 Use consistent colors for clarity and readability.
📌 Integrate with Power BI or Power Query for automation.
📌 Train team members to interpret trends for continuous improvement.
👥 Who Can Benefit
🌍 Sustainability Managers – Monitor KPIs and progress toward carbon-neutral goals.
🏢 Corporate ESG Teams – Align climate actions with organizational commitments.
💧 Facility & Energy Managers – Track resource efficiency and savings.
💰 Finance & CSR Departments – Report on sustainability ROI and compliance.
🔬 Environmental Consultants – Simplify client reporting and audits.


Reviews
There are no reviews yet.