Managing open and distance-learning institutions requires handling vast amounts of academic, financial, and operational data. Tracking tuition payments, student enrollments, and satisfaction scores across multiple programs can quickly become overwhelming. That’s why the Open Universities Dashboard in Excel is a true game-changer for education leaders. 📊
This ready-to-use Excel template brings together every critical insight — tuition revenue, academic performance, satisfaction ratings, and more — into one professional, easy-to-navigate dashboard. Designed for university administrators, education boards, and analysts, it turns scattered data into a clear visual story that supports data-driven decisions.
Built entirely in Microsoft Excel, the dashboard leverages pivot charts, slicers, and conditional formatting to help you analyze trends, monitor financials, and track student outcomes — without any coding or complex setup.
⚙️ Key Features of the Open Universities Dashboard in Excel
🎯 All-in-One Performance View – Track tuition, student enrollment, and satisfaction metrics across institutions and programs.
📊 Dynamic Charts & KPIs – Visualize Paid %, Overdue %, Average GPA, and Credits Completed through interactive visuals.
📈 Five Analytical Pages – Explore Overview, University, Funding Source, Program, and Monthly Trend pages.
💾 Data-Driven Navigation – Use slicers and filters to view insights by month, university, or region.
💡 Automatic Calculations – Built-in formulas instantly update KPI values when new data is entered.
🧮 Financial Transparency – Monitor tuition collection, overdue amounts, and payment completion rates.
📚 Academic Insights – Compare GPA, credits, and satisfaction ratings across programs.
⚙️ Customizable & Scalable – Easily expand with new programs, KPIs, or visuals.
🔒 No Coding Needed – 100 % Excel-based and beginner-friendly.
📂 What’s Inside the Open Universities Dashboard in Excel
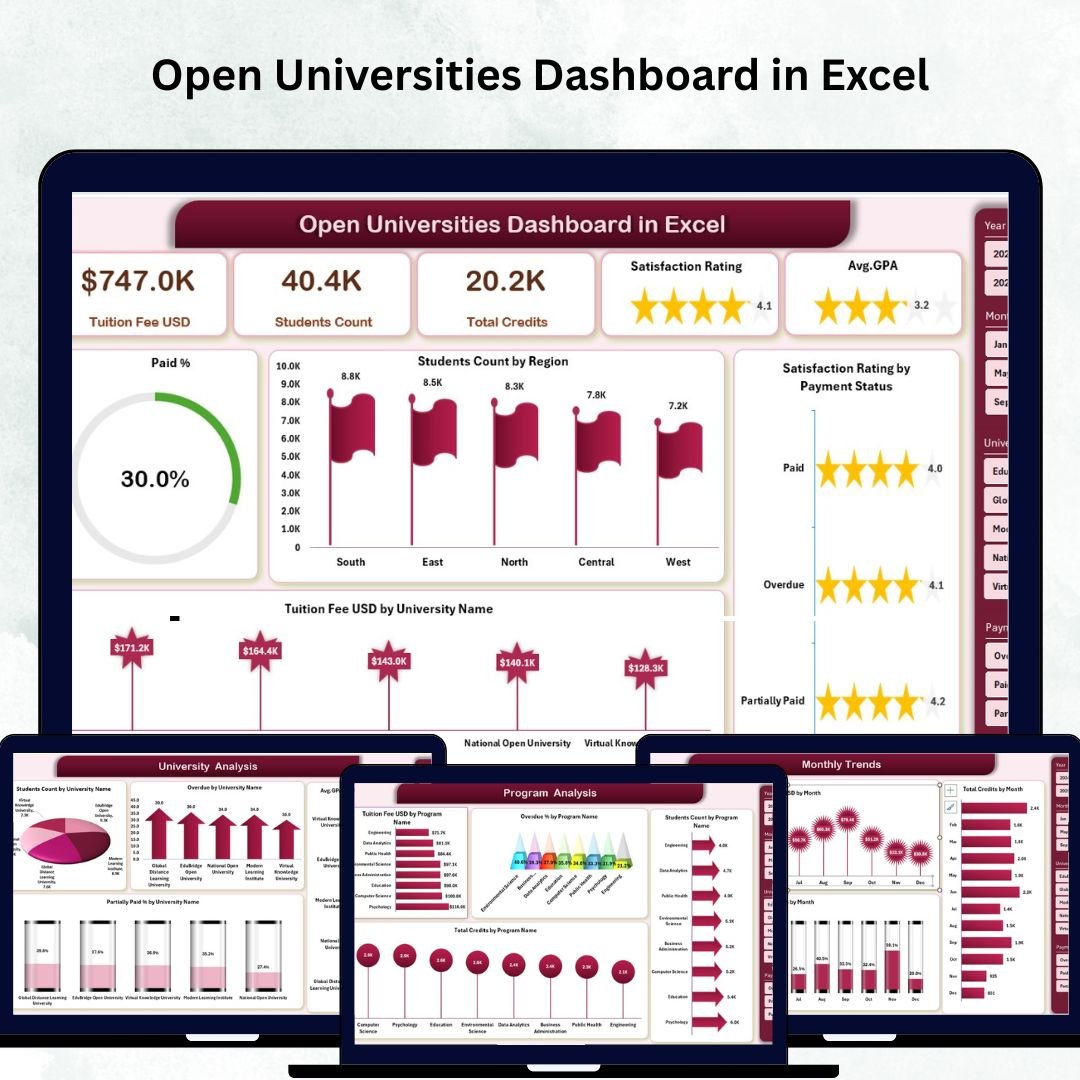
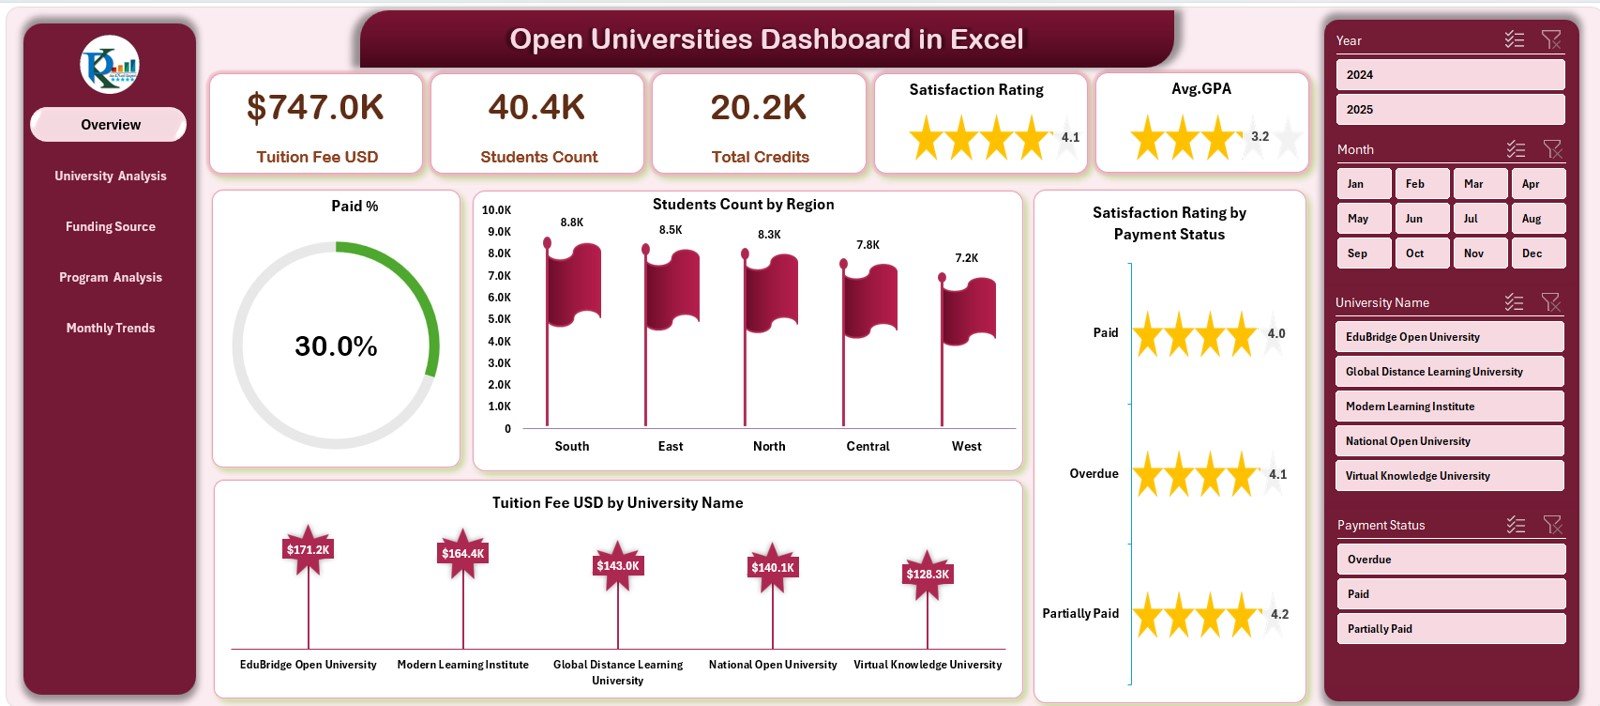
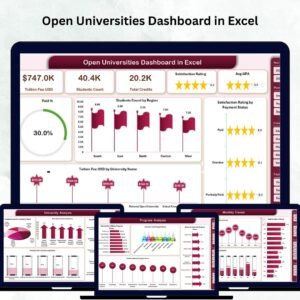
🏠 1. Overview Page:
The main summary hub. Displays KPI cards for Total Students, Tuition Revenue, Satisfaction %, and paid %.
Includes charts such as:
-
Paid % by Region
-
Student Count by Region
-
Tuition (USD) by University Name
-
Satisfaction Rating by Payment Status
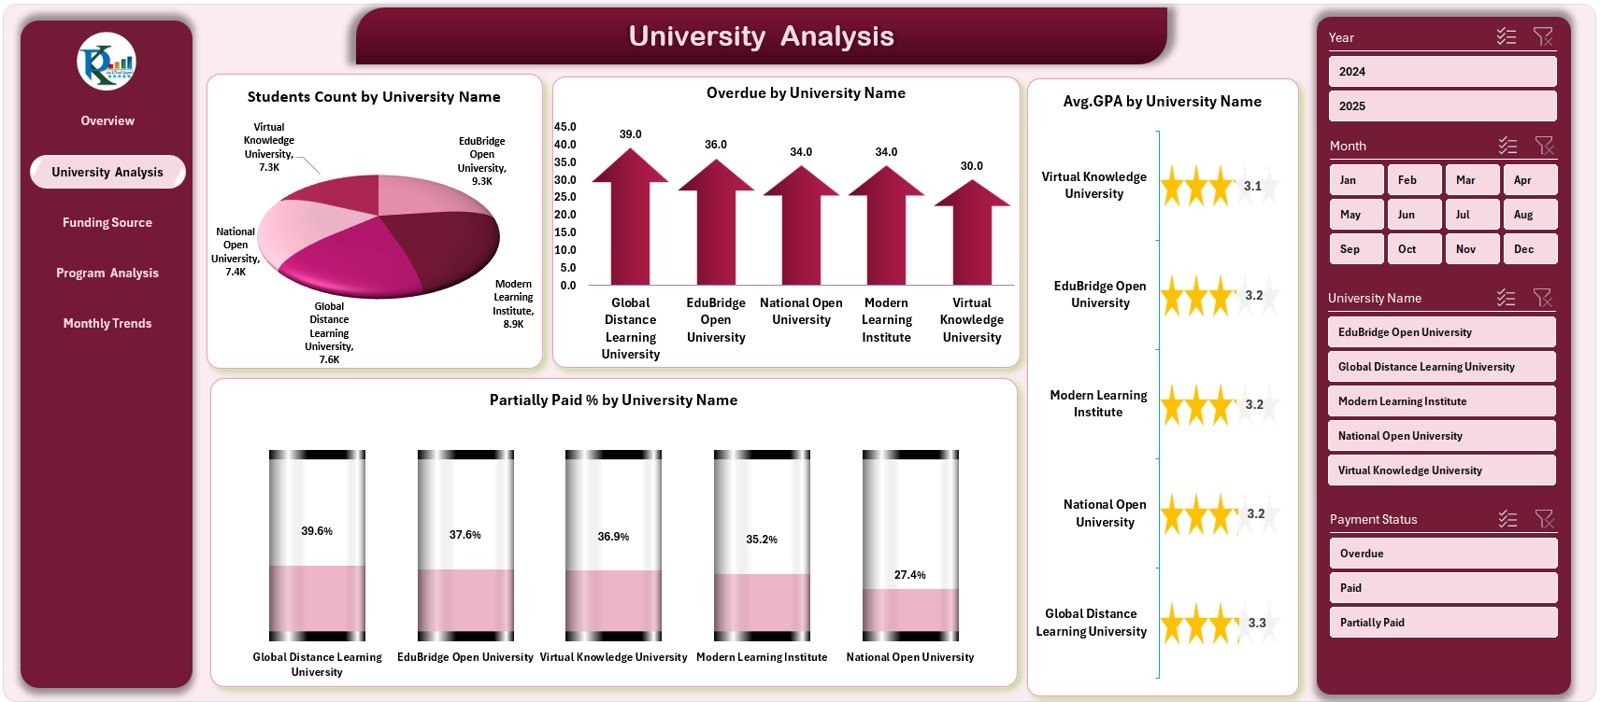
📊 2. University Analysis Page:
Evaluate each university’s performance through visuals like Student Count, Overdue Amounts, Partially Paid %, and Average GPA.
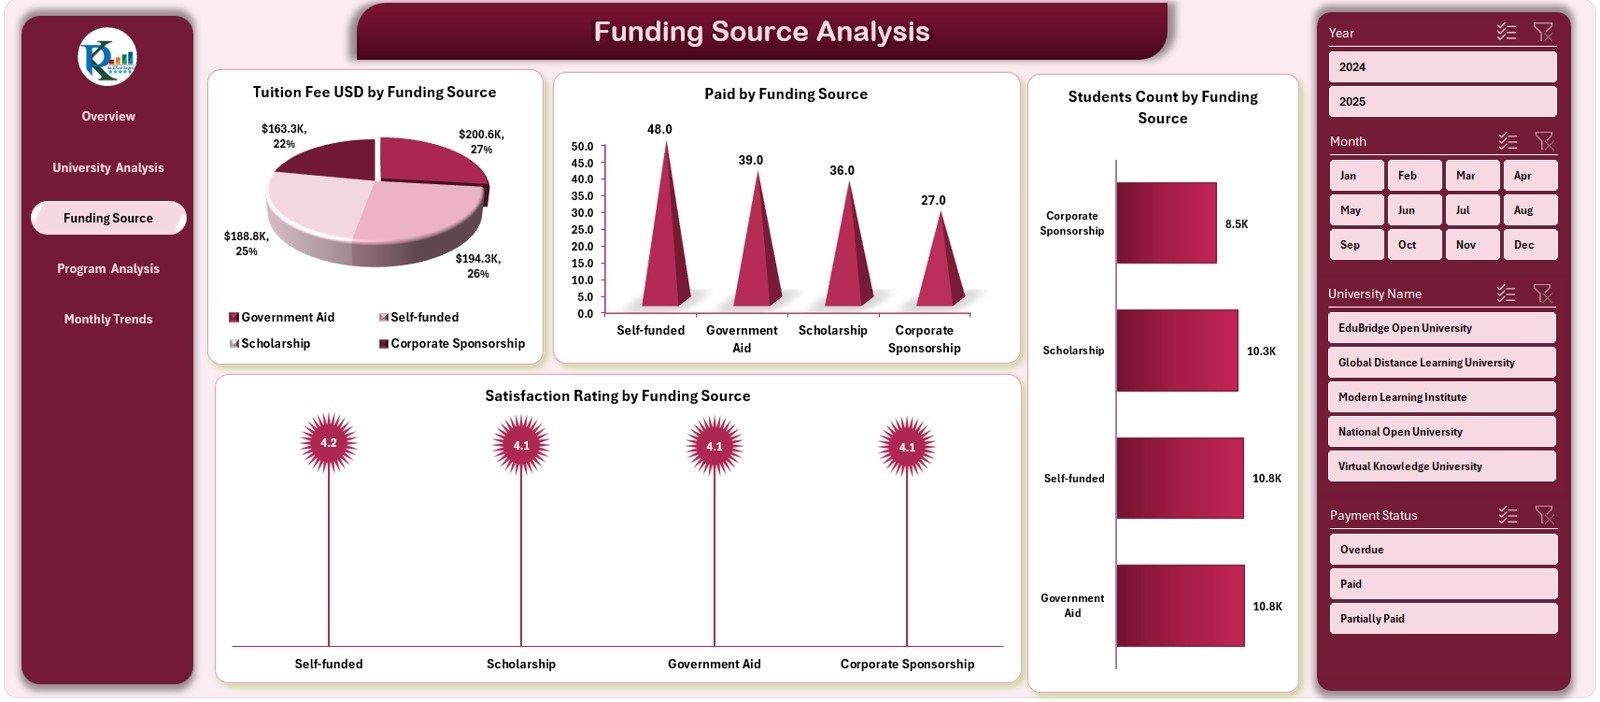
💰 3. Funding Source Analysis Page:
Understand how different funding models influence enrollment and satisfaction. Charts include Tuition Fee, Paid Amount, Student Count, and Satisfaction Rating by Funding Source.
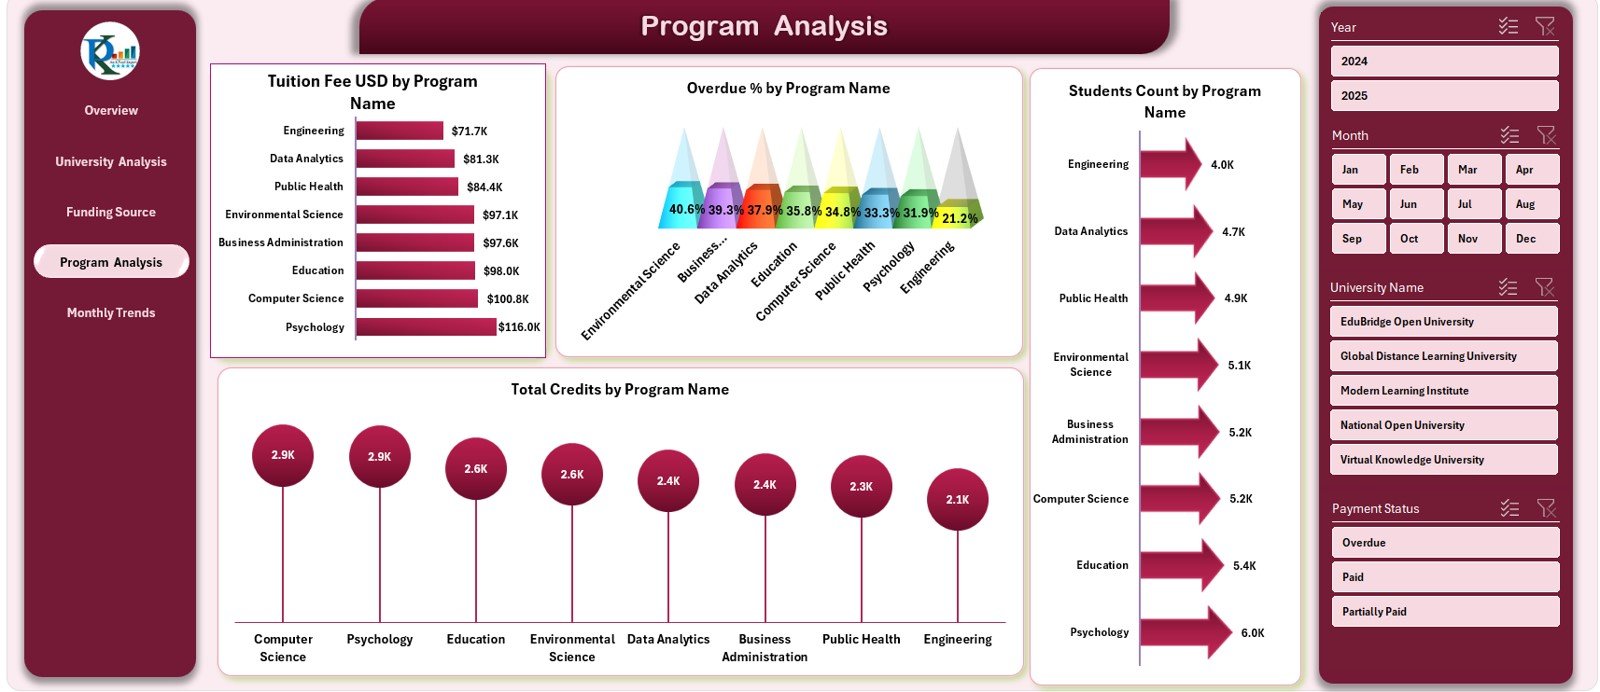
🎓 4. Program Analysis Page:
Drill into academic and financial metrics by program. Track Tuition Fee (USD), Overdue %, Student Count, and Credits Completed for each course.
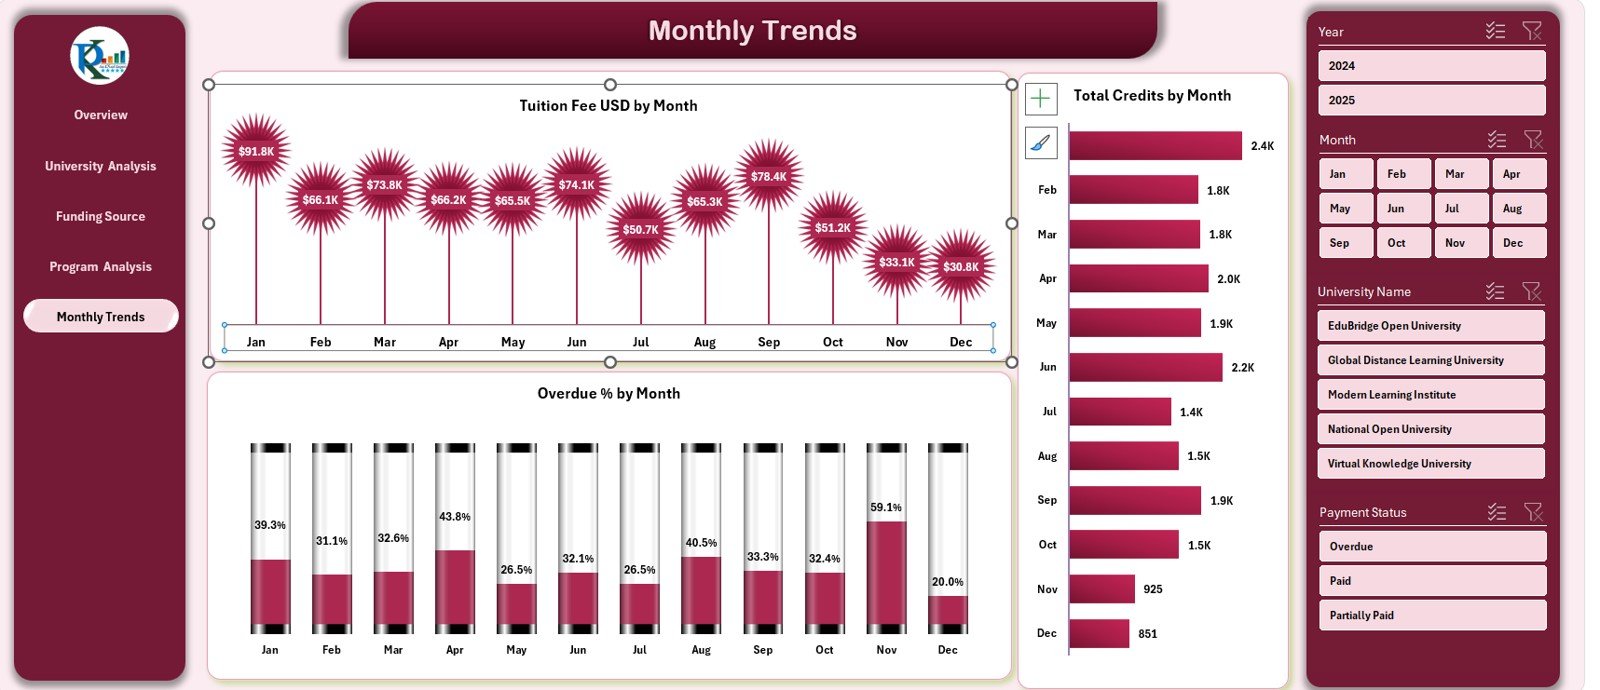
📅 5. Monthly Trends Page:
Visualize time-based performance with charts for Tuition Fee (USD) by Month, Total Credits, and Overdue %. Identify seasonal patterns and plan resources accordingly.
🧾 Support & Data Sheets:
-
Data Sheet: Houses all raw monthly data.
-
Support Sheet: Manages slicers and dropdown validation lists for smooth interactivity.
This logical structure ensures that updates, analysis, and navigation remain effortless for all users.
🧭 How to Use the Open Universities Dashboard in Excel
1️⃣ Open the File: Review all analytical pages and the Overview hub.
2️⃣ Enter Data: Fill in tuition, GPA, and satisfaction metrics in the Data Sheet.
3️⃣ Select Filters: Use slicers to choose months, universities, or regions.
4️⃣ Analyze KPIs: Examine Paid %, Overdue %, and Tuition Revenue % for performance clarity.
5️⃣ Drill Down: Move to Program or Funding Source pages for detailed analysis.
6️⃣ Track Trends: Visit the Monthly Trends page to monitor progress throughout the year.
7️⃣ Update Monthly: Keep data fresh for the most accurate decision-making.
💡 Pro Tip: Protect formula cells and keep a backup version monthly for historical comparison.
👥 Who Can Benefit from This Dashboard
🏛️ University Administrators: Gain financial and academic insights at a glance.
💼 Government Education Boards: Track funding utilization and performance across regions.
🎓 Program Directors: Identify high-performing or under-enrolled courses.
💰 Finance Departments: Manage overdue and paid tuition efficiently.
📊 Data Analysts & Researchers: Evaluate long-term trends in open university performance.
Whether you oversee a single campus or a national network of institutions, this Excel dashboard delivers the clarity you need for strategic planning and accountability.


Reviews
There are no reviews yet.