In today’s era of space innovation, precision and performance define mission success. Every second, every metric, and every reading counts — and that’s exactly why the Space Mission Operations KPI Dashboard in Excel was created. This ready-to-use Excel-based dashboard transforms complex space mission data into clear, visual insights that help teams monitor performance, identify trends, and make quick, informed decisions.Space Mission Operations KPI Dashboard in Excel
Built for mission analysts, engineers, and control teams, this dashboard consolidates everything — from spacecraft telemetry to communication uptime — into one streamlined interface. It’s your all-in-one mission intelligence system, designed to keep your operations on track and your data under control.Space Mission Operations KPI Dashboard in Excel.
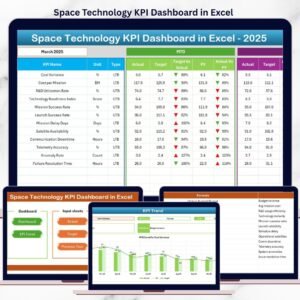
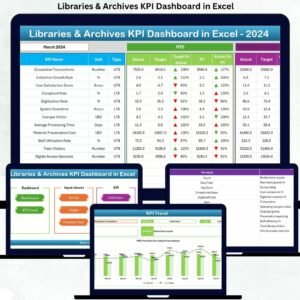
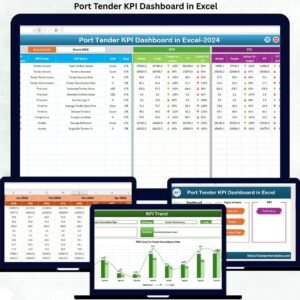
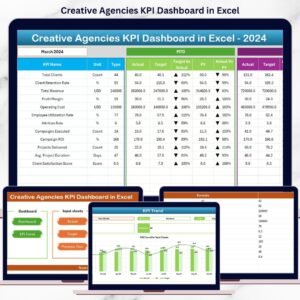
✨ Key Features of Space Mission Operations KPI Dashboard in Excel
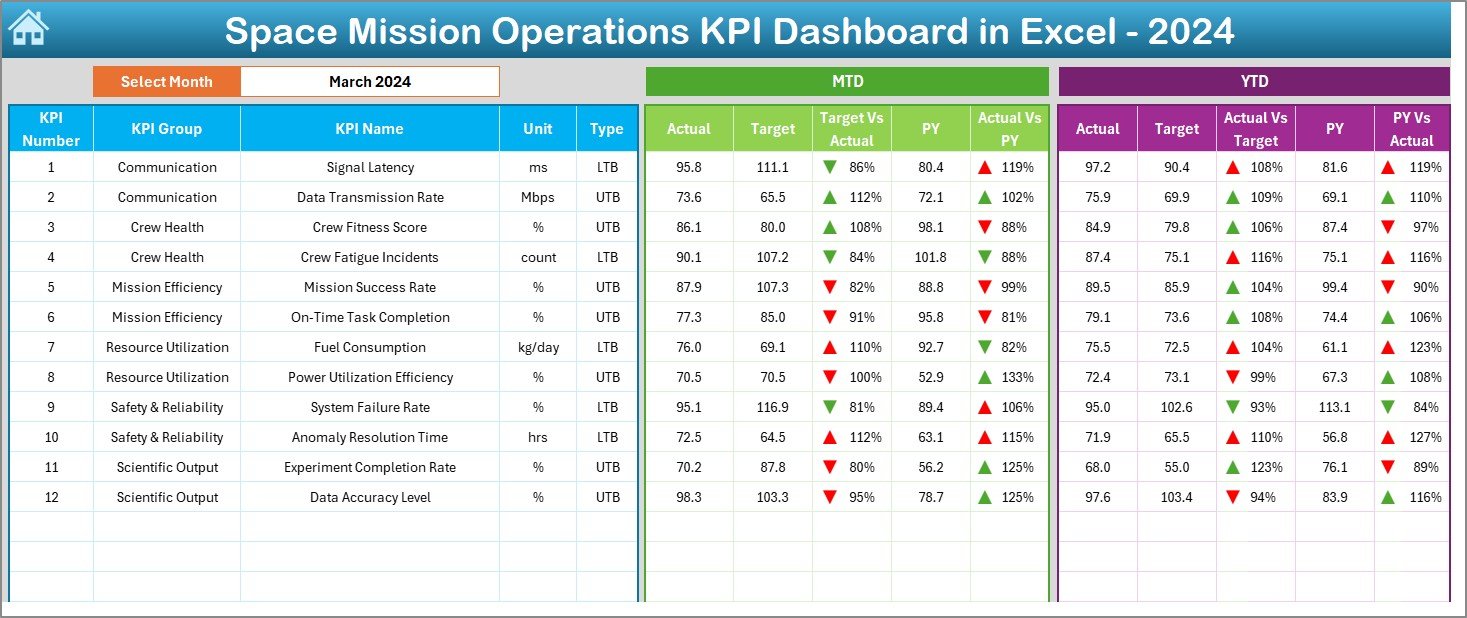
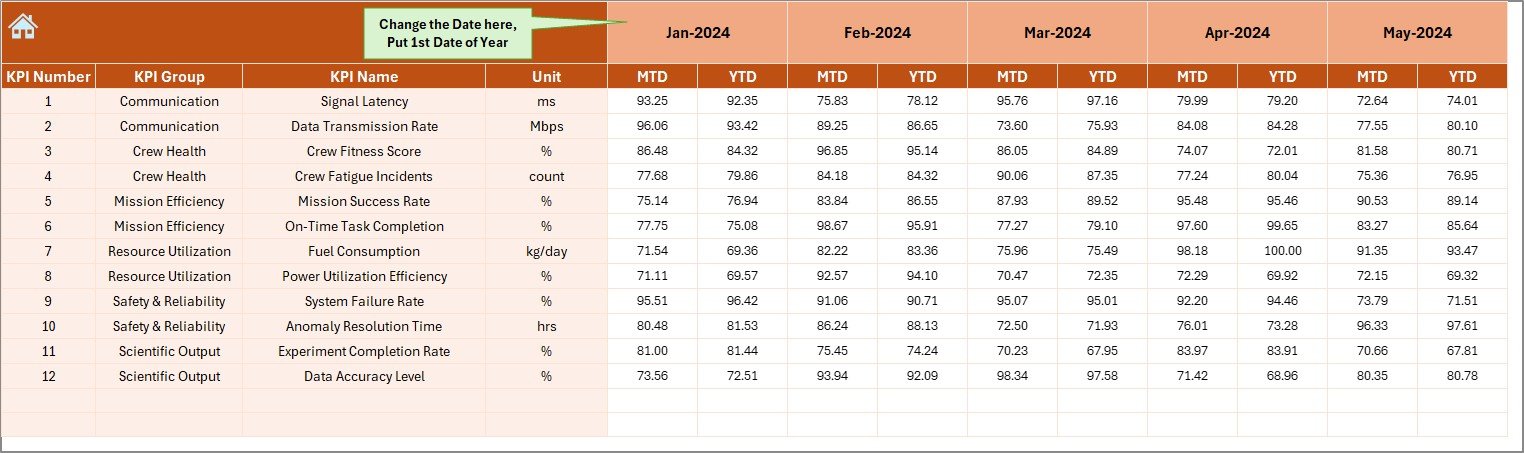
✅ All-in-One Dashboard – View MTD (Month-to-Date) and YTD (Year-to-Date) performance in one place with dynamic dropdowns for month selection.Space Mission Operations KPI Dashboard in Excel
📊 Automated Visual Analytics – Compare Actual vs Target vs Previous Year instantly using interactive charts, tables, and arrows indicating progress or decline.
🛰️ Comprehensive KPI Tracking – Monitor crucial mission indicators such as fuel efficiency, communication uptime, payload status, and telemetry accuracy.
🔁 Real-Time Updates – Enter your actual data once and watch every chart and number update automatically.
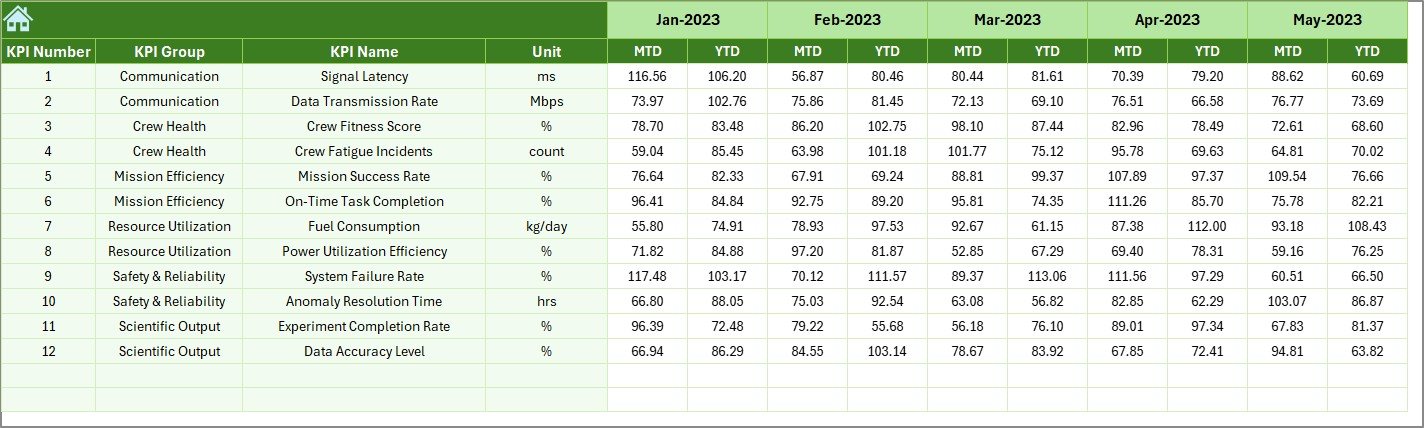
📅 Historical Comparisons – Review previous year’s performance to track long-term improvements or detect recurring issues.
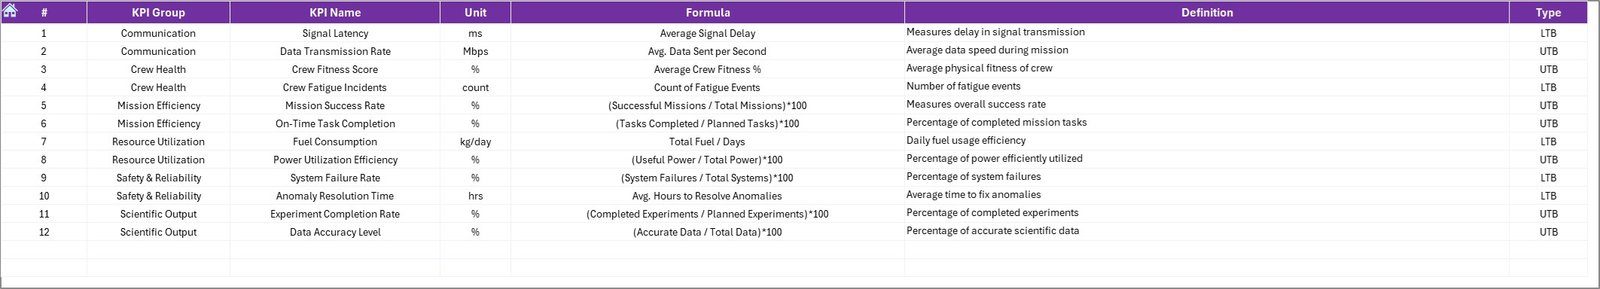
🔒 Data Consistency and Transparency – Every KPI is supported by its formula, definition, and unit of measurement.
⚙️ Automation with Simplicity – Built on Excel’s native formulas, dropdowns, and conditional formatting — no coding expertise needed.
🌍 Professional Design – Sleek, mission-ready interface for effortless navigation between sheets using quick-access buttons.
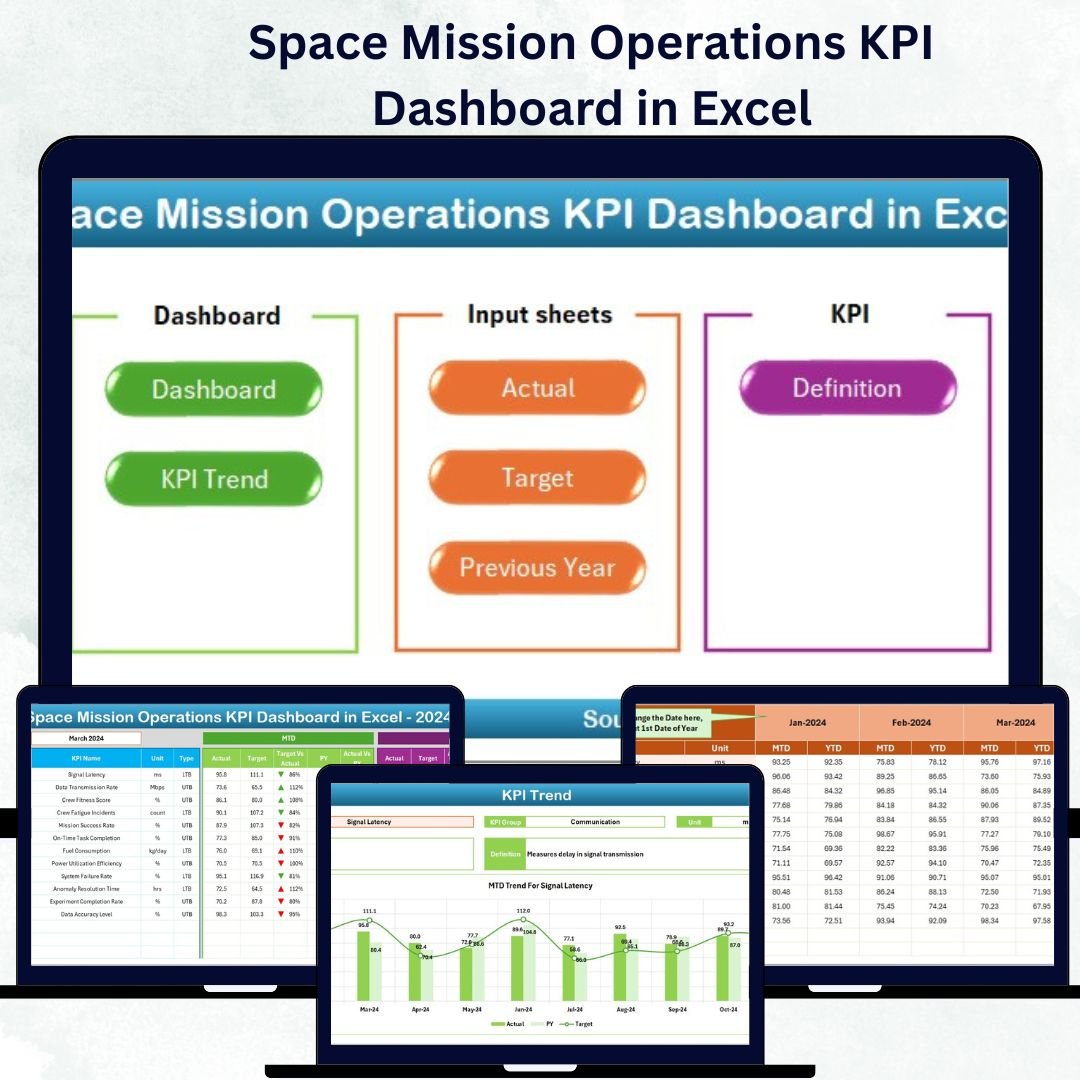
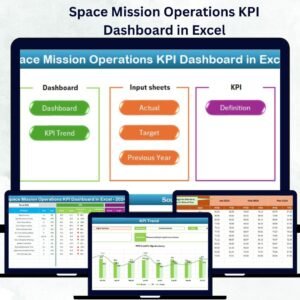
🧾 What’s Inside the Space Mission Operations KPI Dashboard
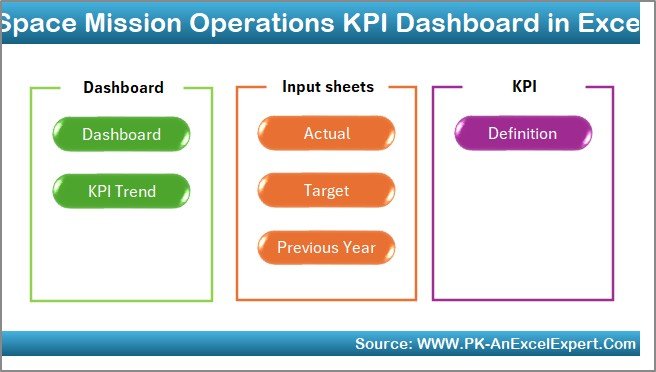
This dashboard is organized into seven structured worksheet tabs, each serving a mission-critical purpose:
1️⃣ Home Sheet: The control hub with six navigation buttons for smooth movement across sheets.
2️⃣ Dashboard Sheet: The main analytical view showing MTD and YTD KPIs with conditional formatting arrows.
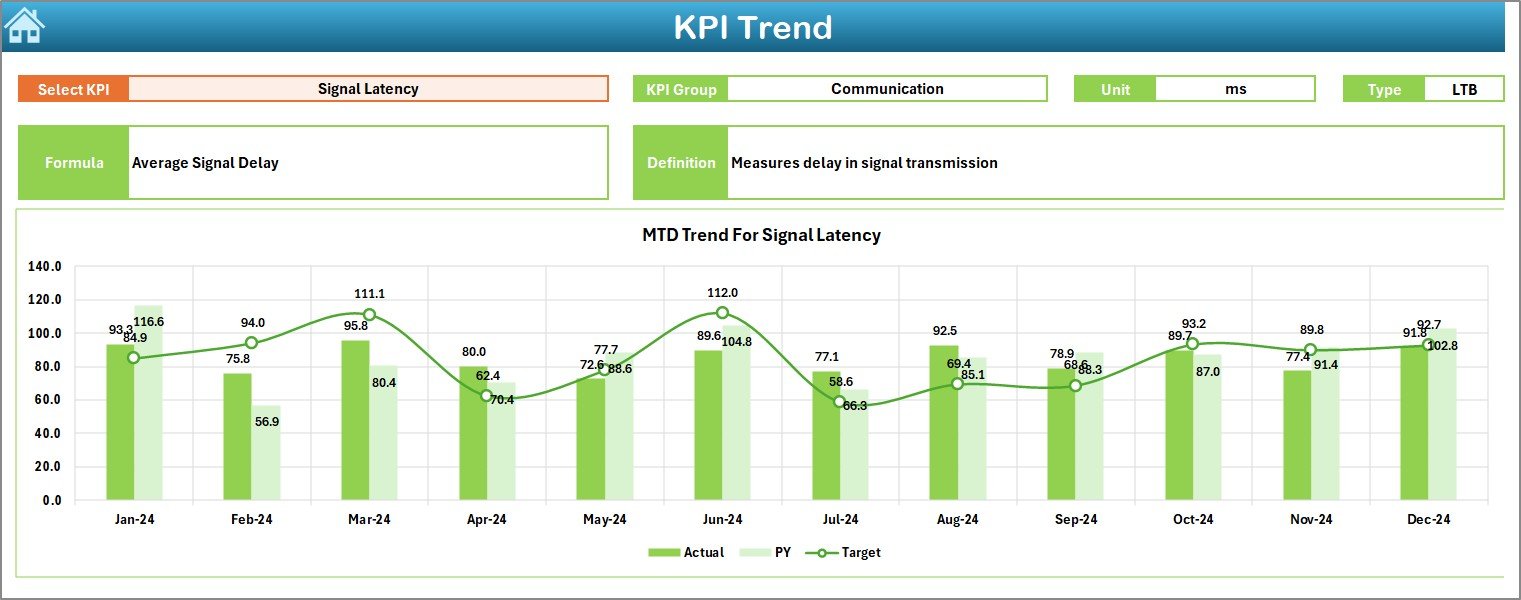
3️⃣ KPI Trend Sheet: Select any KPI and view its trend over time with two insightful charts — MTD and YTD.
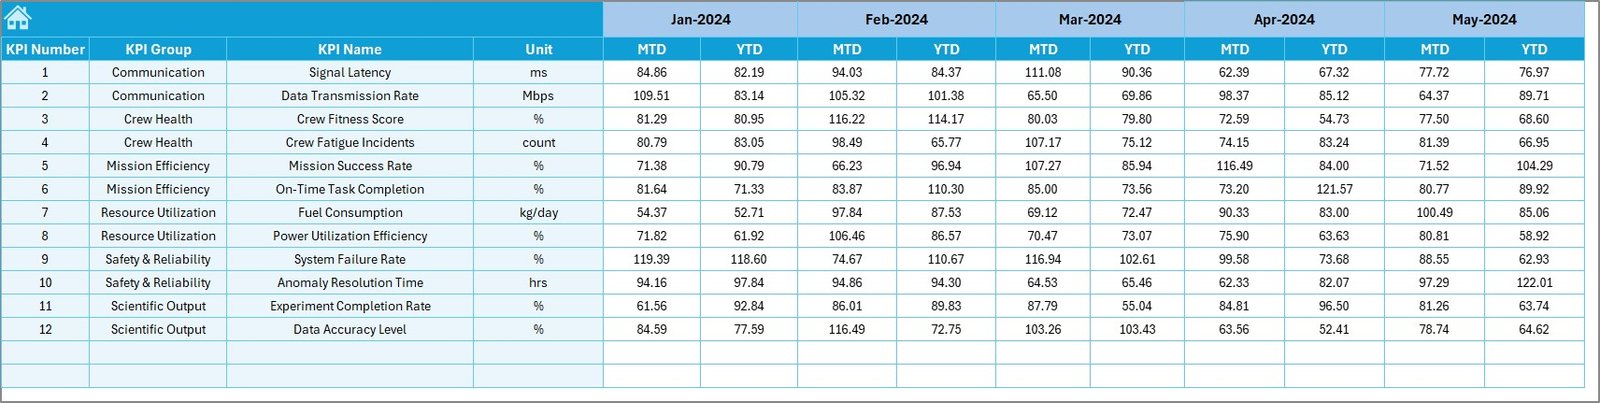
4️⃣ Actual Numbers Input Sheet: Update your real mission data and automatically refresh the entire dashboard.
5️⃣ Target Sheet: Define monthly and yearly performance goals for each KPI.
6️⃣ Previous Year Sheet: Store and compare last year’s data for year-on-year performance tracking.
7️⃣ KPI Definition Sheet: A complete knowledge base listing every KPI with its formula, unit, and purpose.
Together, these sheets offer a 360° operational view — from planning to execution — ensuring your mission data is accurate, connected, and actionable.Space Mission Operations KPI Dashboard in Excel.Space Mission Operations KPI Dashboard in Excel
🧠 How to Use the Space Mission Operations KPI Dashboard
🧩 Step 1: Enter the latest data into the Actual Numbers sheet.
🎯 Step 2: Set clear benchmarks in the Target sheet.
📈 Step 3: Compare your results using the Dashboard and KPI Trend sheets.
🔍 Step 4: Review monthly and yearly patterns to detect performance gaps.
🧮 Step 5: Update KPI definitions as your mission parameters evolve.
💡 Step 6: Share visuals with your team for data-driven discussions during reviews or debriefings.
Within minutes, you’ll be able to visualize complex mission data and make informed decisions with complete confidence.
👩🚀 Who Can Benefit from This Space Mission Operations KPI Dashboard
🚀 Mission Control Teams: Analyze operational data and ensure mission reliability.
🛰️ Aerospace Engineers: Track system performance, propulsion metrics, and subsystem health.
📡 Ground Communication Teams: Monitor uptime, signal strength, and transmission success rate.
📊 Data Analysts & Strategists: Study year-on-year performance, trends, and anomalies.
🏢 Research & Development Units: Use KPI data to enhance future mission designs.
💼 Defense & Government Agencies: Ensure compliance and optimize high-value operations.
Whether you’re managing a full-scale space mission or a research project, this dashboard helps you simplify the data chaos and achieve operational excellence — all within Excel.


Reviews
There are no reviews yet.