In the fast-evolving world of digital finance, monitoring blockchain activity and cryptocurrency performance can be overwhelming without the right tools. The Blockchain & Cryptocurrency Dashboard in Excel offers a simple, yet powerful way to track your crypto data — all within a single, dynamic Excel file.
Whether you’re a trader, investor, analyst, or blockchain enthusiast, this ready-to-use dashboard helps you visualize transactions, analyze performance, and monitor wallet balances effortlessly. No coding, no complex tools — just clean visuals, smart automation, and Excel-powered insights.
With its five analytical pages and two support sheets, this dashboard transforms raw crypto data into actionable intelligence, helping you make smarter, faster, and more confident financial decisions.
⚙️ Key Features of the Blockchain & Cryptocurrency Dashboard in Excel
🔹 Page Navigator – One-Click Access
A sleek navigation panel on the left lets you switch between pages like Overview, Department Analysis, Blockchain Network, Transaction Type, and Monthly Trends — ensuring a seamless user experience.
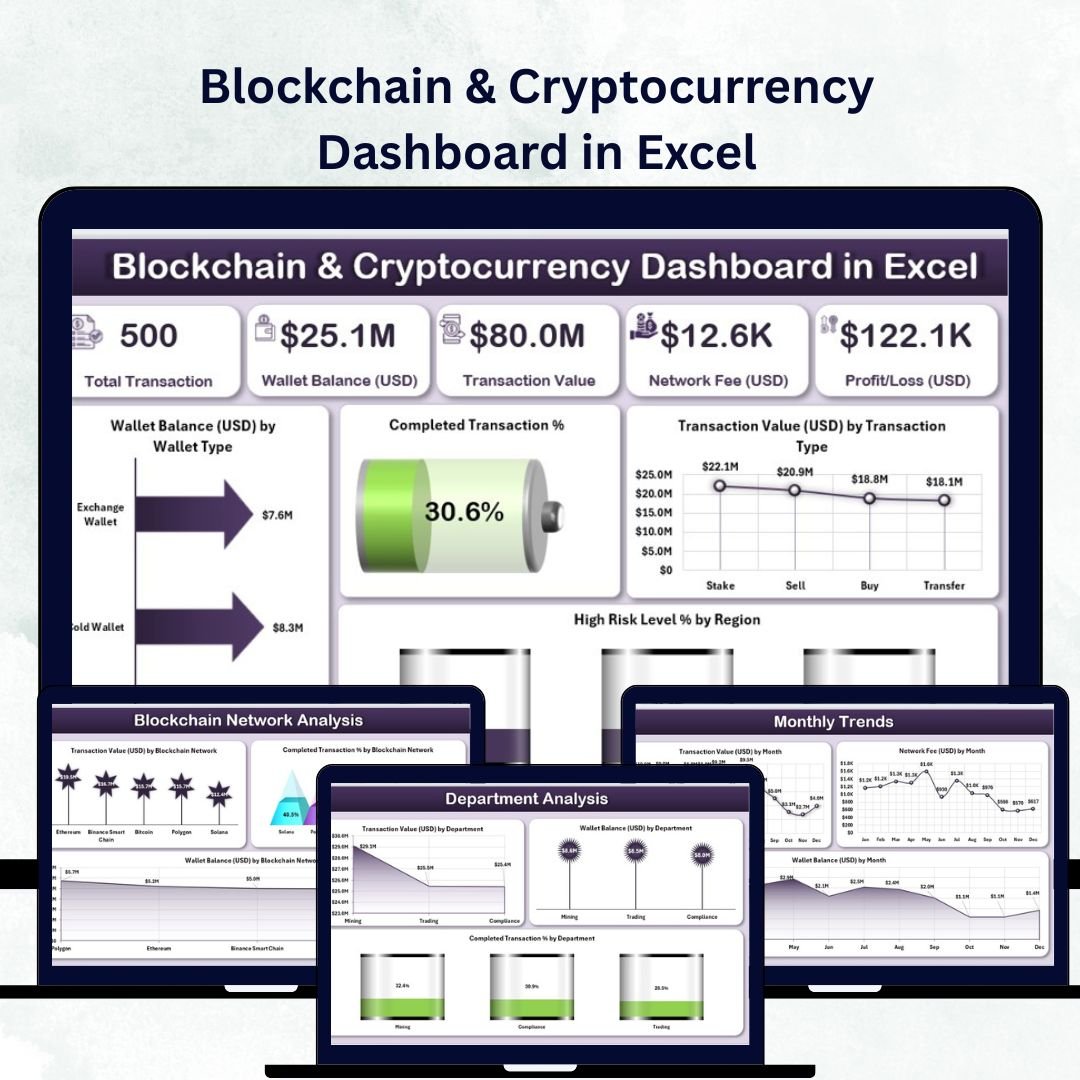
🪙 1️⃣ Overview Page – The Command Center
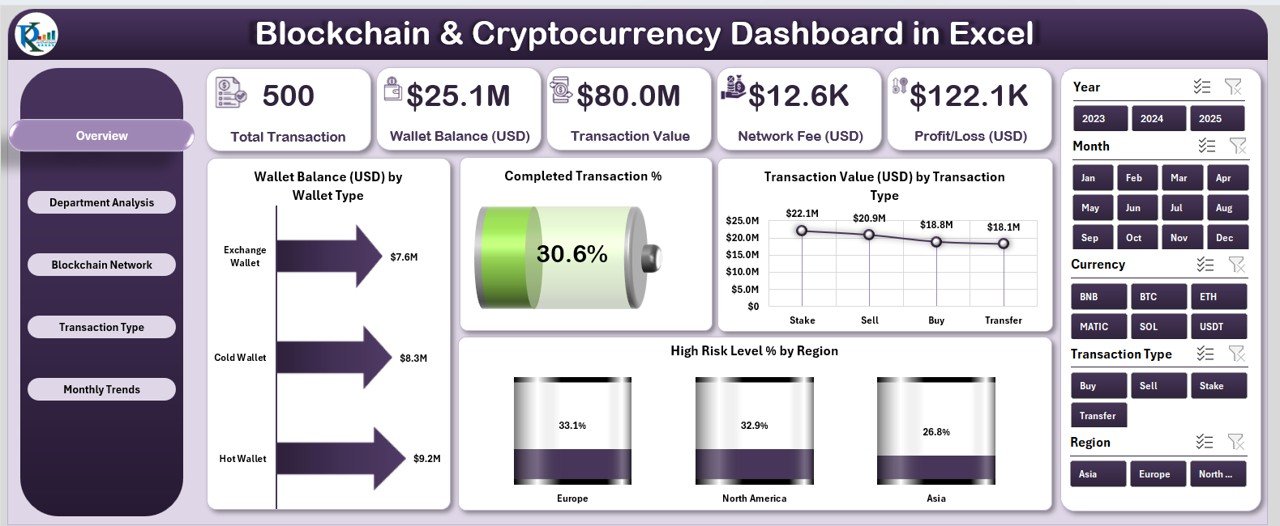
This page delivers a complete picture of your blockchain and crypto ecosystem.
Highlights:
-
5 Analytical Cards: Total Wallet Balance, Completed Transaction %, Average Transaction Value, Network Fees, Profit/Loss.
-
Slicers: Filter data by wallet type, time period, or region.
-
Dynamic Charts:
-
💰 Wallet Balance (USD) by Wallet Type
-
✅ Completed Transaction %
-
📊 Transaction Value (USD) by Transaction Type
-
🌍 High-Risk Level % by Region
-
It’s your go-to space for instant insights on overall blockchain performance.
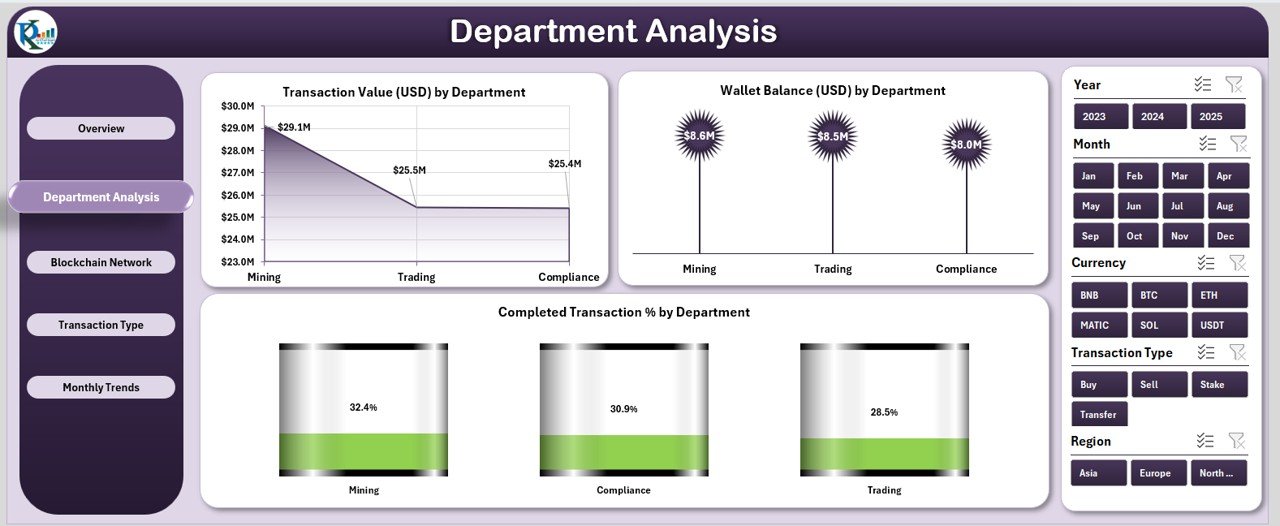
🏢 2️⃣ Department Analysis – Performance by Team
Perfect for organizations managing crypto operations across departments.
Charts Included:
-
Transaction Value (USD) by Department
-
Wallet Balance (USD) by Department
-
Completed Transaction % by Department
Filter insights with a department-level slicer to assess which teams are performing efficiently and which need improvement.
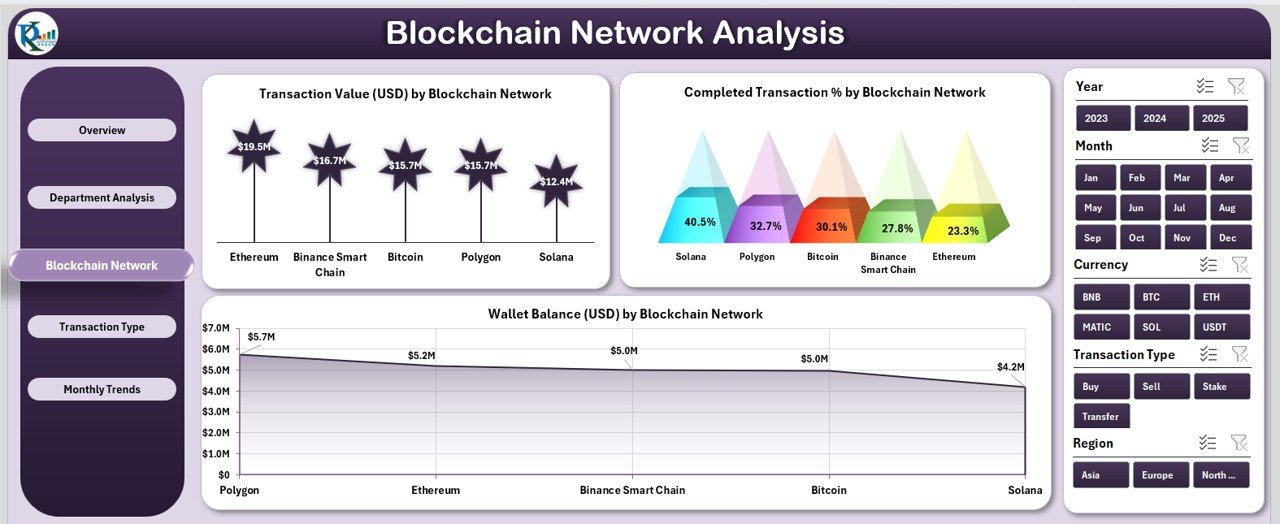
🔗 3️⃣ Blockchain Network Analysis – Comparing Network Efficiency
Analyze how different blockchain networks perform over time.
Key Visuals:
-
Days to Transaction Value (USD) by Blockchain Network
-
Wallet Balance (USD) by Blockchain Network
-
Completed Transaction % by Network
Compare performance across Bitcoin, Ethereum, Solana, Binance Smart Chain, and more — identifying the most reliable and cost-effective options.
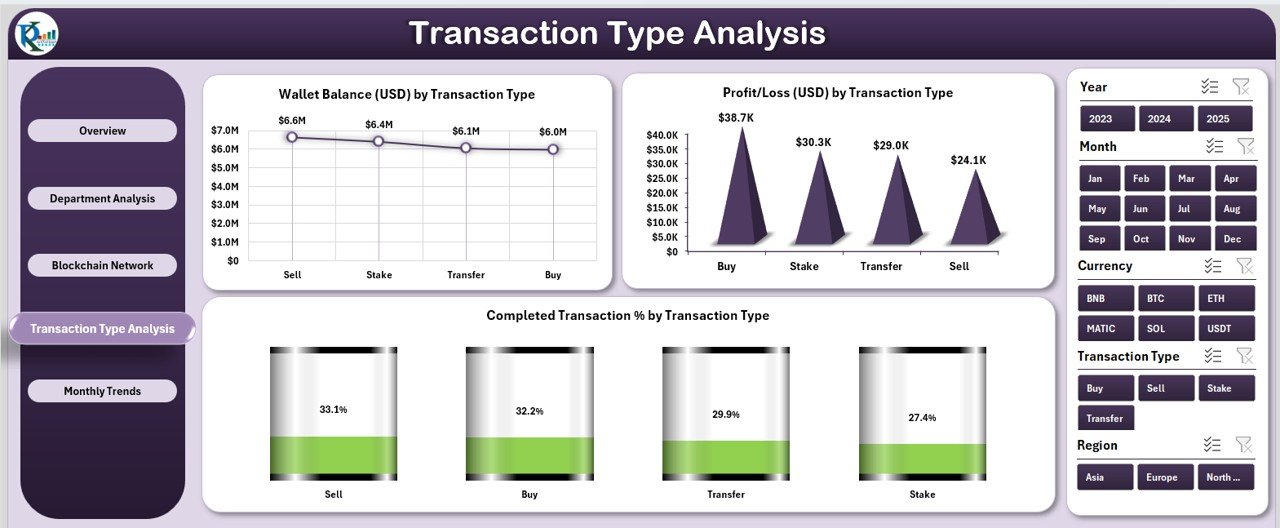
💹 4️⃣ Transaction Type Analysis – Understanding Profitability
Break down profitability and performance by transaction type.
Charts Displayed:
-
Wallet Balance (USD) by Transaction Type
-
Completed Transaction % by Type
-
Profit/Loss (USD) by Type
Find out which activities — buying, selling, staking, or transferring — deliver the best financial outcomes.
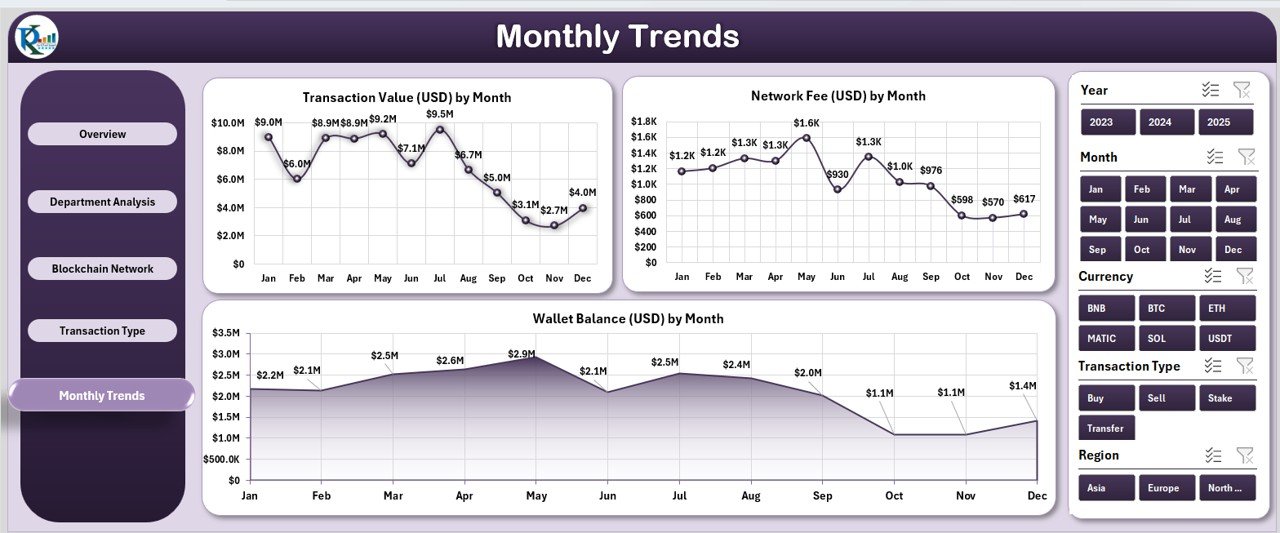
📆 5️⃣ Monthly Trends – Tracking Over Time
Visualize blockchain growth and trends throughout the year.
Charts Included:
-
Transaction Value (USD) by Month
-
Network Fee (USD) by Month
-
Wallet Balance (USD) by Month
Easily identify seasonal fluctuations and long-term performance patterns.
🧾 Supporting Sheets – The Data Engine
1️⃣ Data Sheet: Holds all transaction, wallet, and performance records.
2️⃣ Support Sheet: Contains lists and formulas for dropdowns and slicers.
Update your data once — and the entire dashboard refreshes automatically.
🧭 How to Use the Dashboard
✅ Open the Excel file.
✅ Input or import crypto data into the Data Sheet.
✅ Use the Page Navigator to switch between views.
✅ Apply slicers to filter by wallet type, network, or time.
✅ Instantly review visuals and KPIs.
In just minutes, you’ll have a powerful crypto analytics dashboard that updates as your data evolves.
🌟 Advantages of the Blockchain & Cryptocurrency Dashboard in Excel
🔹 Real-Time Decision Support: Monitor wallet balances, transaction trends, and risk metrics instantly.
🔹 Centralized Data Management: Consolidate blockchain data from multiple sources in one dashboard.
🔹 Simple Yet Smart: Pivot charts and slicers make complex analysis accessible to everyone.
🔹 Offline & Secure: Work privately without relying on third-party apps or the internet.
🔹 Fully Customizable: Adjust charts, KPIs, and visuals to fit your portfolio.
🔹 Strategic Insights: Compare blockchain networks and transaction types for smarter investment decisions.
💡 Best Practices for Maximum Insights
🔸 Update your Data Sheet regularly for accuracy.
🔸 Maintain consistent wallet and network names.
🔸 Protect sensitive data with Excel password features.
🔸 Use conditional formatting to highlight key metrics.
🔸 Integrate with APIs or Power Query for automated data updates.
🔸 Backup your file frequently for added security.
With these practices, your Excel dashboard becomes a professional-grade crypto intelligence system.
👥 Who Can Benefit from This Dashboard
💼 Investors & Traders: Track profits, network fees, and portfolio balance.
🏢 Businesses: Manage blockchain transactions across departments.
💻 Developers: Monitor network reliability and processing efficiency.
📊 Auditors & Analysts: Ensure data integrity and compliance monitoring.
This dashboard adapts to all user levels — from individual crypto investors to enterprise blockchain teams.
🔗 Click here to read the Detailed Blog Post
🎥 Visit our YouTube channel for step-by-step tutorials
🔗 YouTube.com/@PKAnExcelExpert


Reviews
There are no reviews yet.