


Employee advocacy is no longer just a buzzword—it’s a proven strategy that drives brand growth, boosts engagement, and builds trust in today’s digital-first world. But success cannot be left to chance. To truly understand the power of employee advocacy, businesses must measure and track results with precision. That’s where the Employee Advocacy KPI Dashboard in Excel comes in! 📊✨
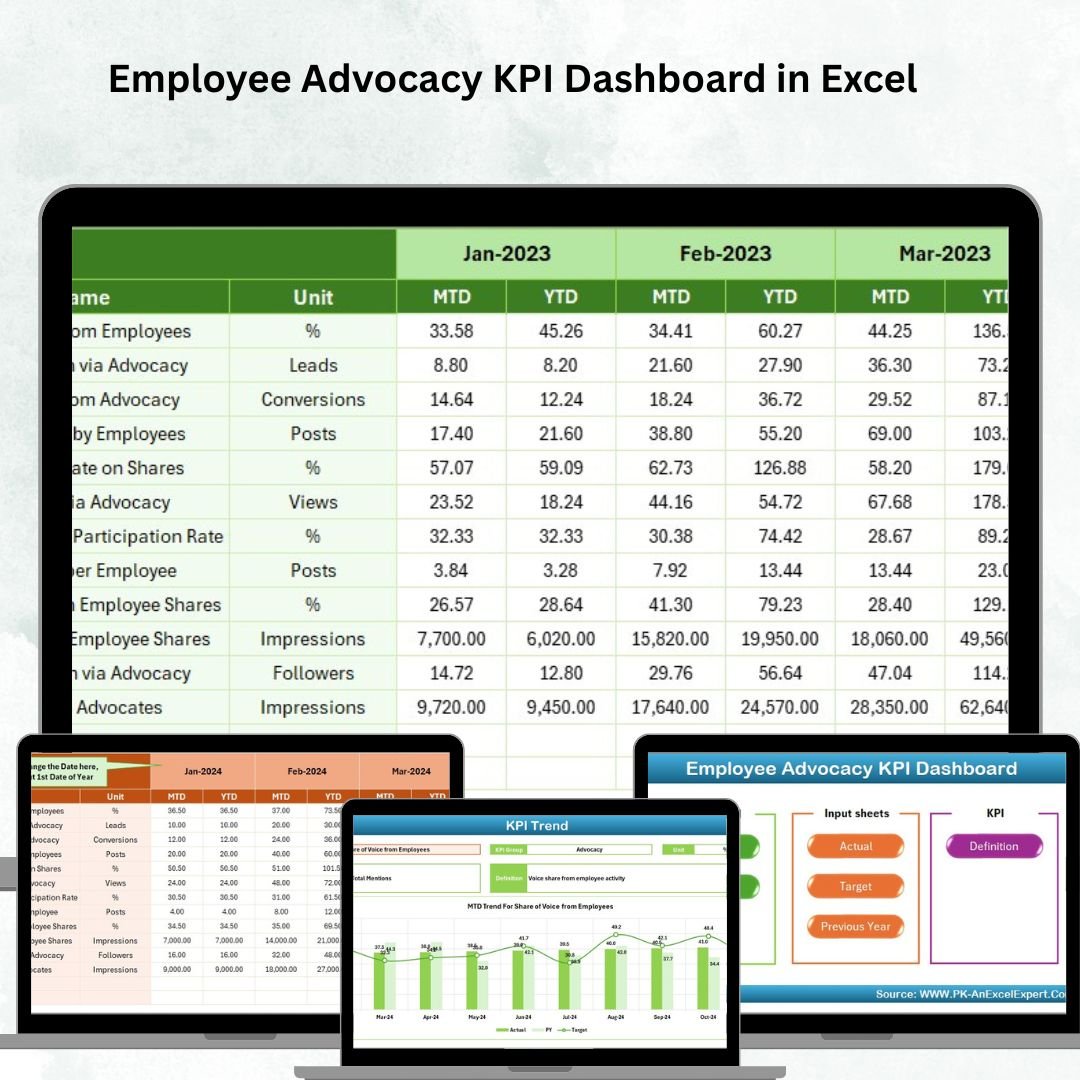
This ready-to-use Excel dashboard empowers managers, HR teams, and marketers to monitor advocacy efforts across the organization. With its structured sheets, interactive charts, and real-time tracking, it ensures that your employee-driven brand initiatives deliver measurable outcomes. Whether you’re a small business or a global enterprise, this tool makes employee advocacy easy, effective, and impactful.Employee Advocacy KPI Dashboard in Excel
🔑 Key Features of the Employee Advocacy KPI Dashboard in Excel
✅ Interactive Controls – Effortlessly switch between months or KPIs using built-in drop-downs.
✅ MTD & YTD Tracking – Instantly view performance on a monthly and yearly basis.
✅ Target vs Actual Comparison – Quickly identify areas where targets are met or missed.
✅ Previous Year Analysis – Gain valuable context by comparing against last year’s data.
✅ Conditional Formatting – Visual arrows and colors highlight performance trends.
✅ Trend Charts – Track KPIs visually for faster decision-making.
✅ Structured Data Input – Dedicated sheets for actuals, targets, and previous year data.
✅ Centralized KPI Definitions – Keep all KPI formulas and definitions in one reference sheet.

📦 What’s Inside the Employee Advocacy KPI Dashboard in Excel
When you download this product, you’ll receive a complete Excel workbook with seven structured sheets, each designed to simplify your tracking:
1️⃣ Home Sheet – Acts as a quick navigation hub with one-click buttons.
2️⃣ Dashboard Sheet – The main visual board with KPI cards, charts, and performance arrows.
3️⃣ KPI Trend Sheet – Dive deeper into any KPI with trend charts and detailed metrics.
4️⃣ Actual Numbers Input Sheet – Enter monthly and yearly actuals easily.
5️⃣ Target Sheet – Store your MTD and YTD goals for each KPI.
6️⃣ Previous Year Numbers Sheet – Compare your current performance with the previous year.
7️⃣ KPI Definition Sheet – A master list of KPI names, units, and formulas for consistency.
🛠 How to Use the Employee Advocacy KPI Dashboard in Excel
✨ Step 1: Open the Home sheet and use the buttons to navigate.
✨ Step 2: On the Actual Numbers Input sheet, enter your latest MTD and YTD data.
✨ Step 3: Update your Target and Previous Year sheets for accurate benchmarking.
✨ Step 4: Explore the Dashboard sheet to view overall performance.
✨ Step 5: Use the KPI Trend sheet for detailed analysis of specific advocacy metrics.
✨ Step 6: Share results with your team to boost engagement and transparency.
No advanced Excel knowledge is required. The dashboard is prebuilt with formulas, conditional formatting, and automation, making it user-friendly for everyone.
👥 Who Can Benefit from This Dashboard?
💼 HR Managers – Track employee participation in advocacy campaigns.
📢 Marketing Teams – Measure reach, impressions, and engagement generated by employees.
📊 Business Leaders – Evaluate cost savings compared to traditional advertising.
🎯 Recruitment Teams – Showcase authentic employee voices to attract new talent.
💡 Sales Teams – Identify leads and opportunities generated from advocacy activities.
This tool is designed for organizations of all sizes—startups, SMEs, and large enterprises—looking to transform advocacy into measurable success.
Click here to read the Detailed Blog Post
Watch the step-by-step video tutorial:
Visit our YouTube channel to learn step-by-step video tutorials. 🎥


Reviews
There are no reviews yet.