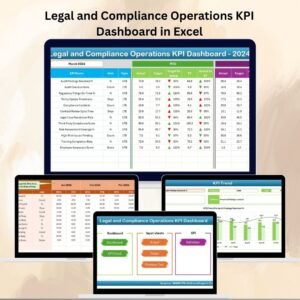
⚖️ Legal and Compliance Operations KPI Dashboard in Excel
In today’s regulatory environment, compliance is non-negotiable. Businesses must ensure that they consistently meet legal and compliance standards to avoid penalties, audits, and reputational damage. However, tracking multiple KPIs manually across spreadsheets often leads to errors, inefficiencies, and missed deadlines.
The Legal and Compliance Operations KPI Dashboard in Excel solves this problem by consolidating all compliance-related data into a single, interactive, and easy-to-use dashboard. This ready-to-use Excel template is designed to help compliance officers, legal teams, auditors, and senior management monitor performance with real-time insights and transparent reporting.
🔑 Key Features of the Dashboard
-
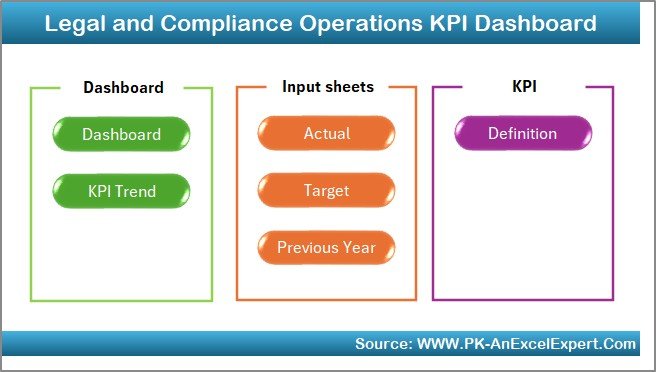
7 Structured Worksheet Tabs – A complete reporting system designed for accuracy and transparency.
-
Home Sheet – Acts as the navigation panel with quick buttons to other sheets.
-
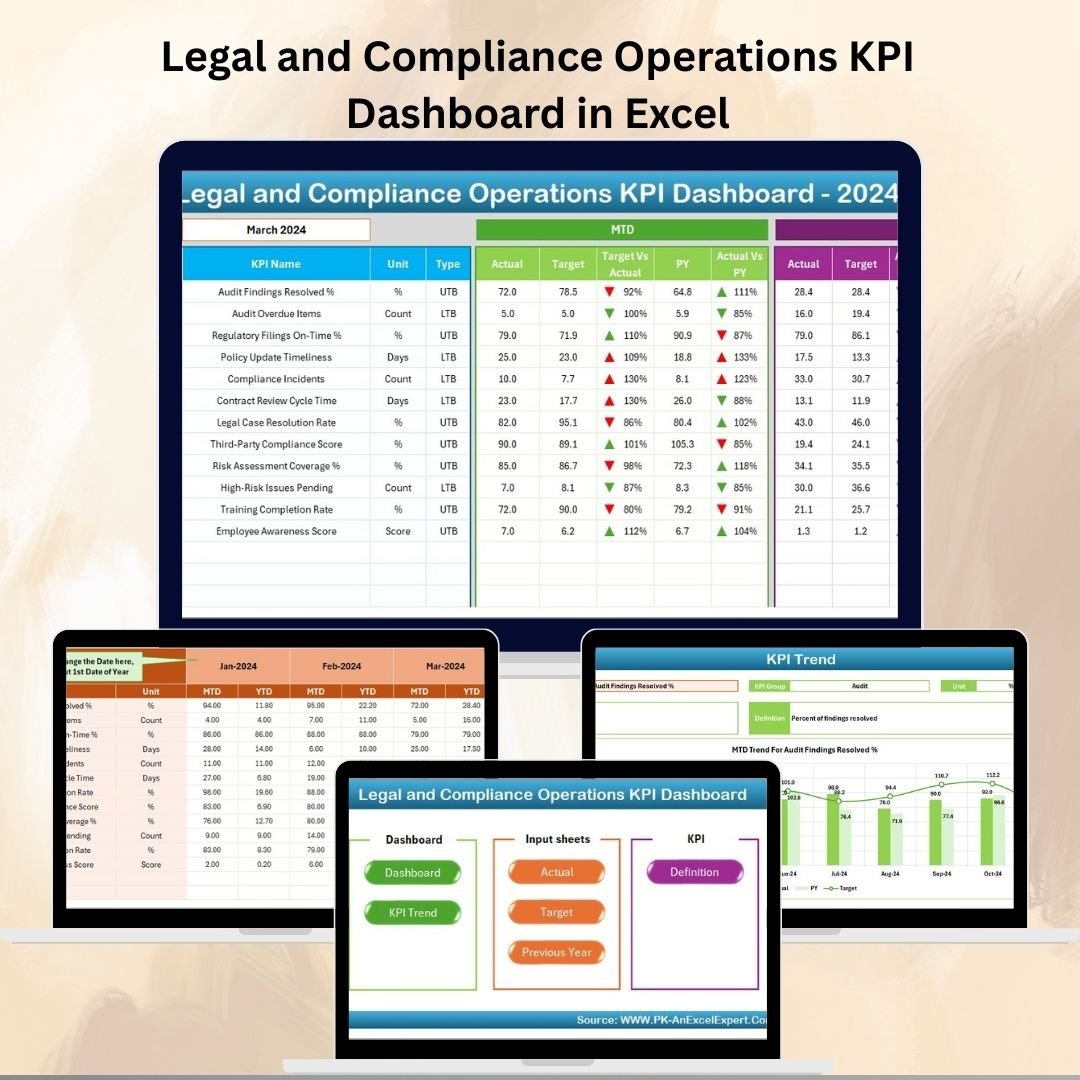
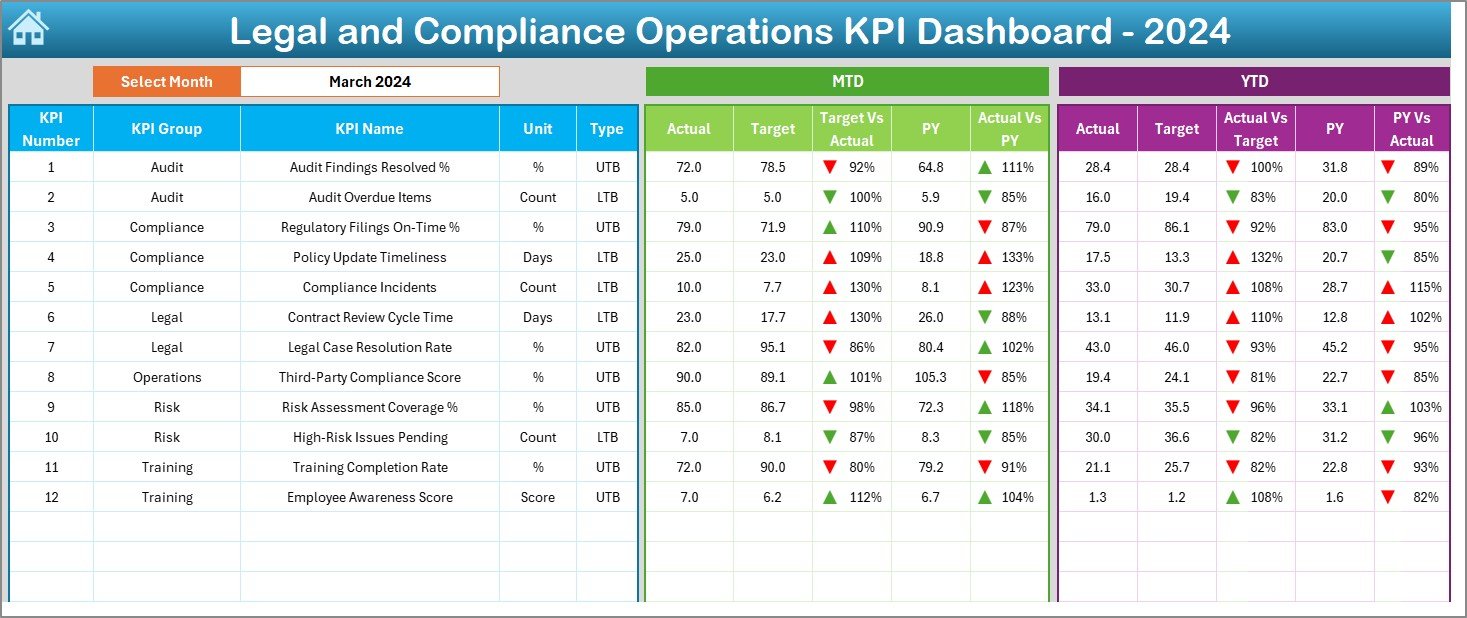
Dashboard Sheet – Provides a visual compliance summary with drop-down month selection, MTD & YTD data, and conditional formatting (up/down arrows).
-
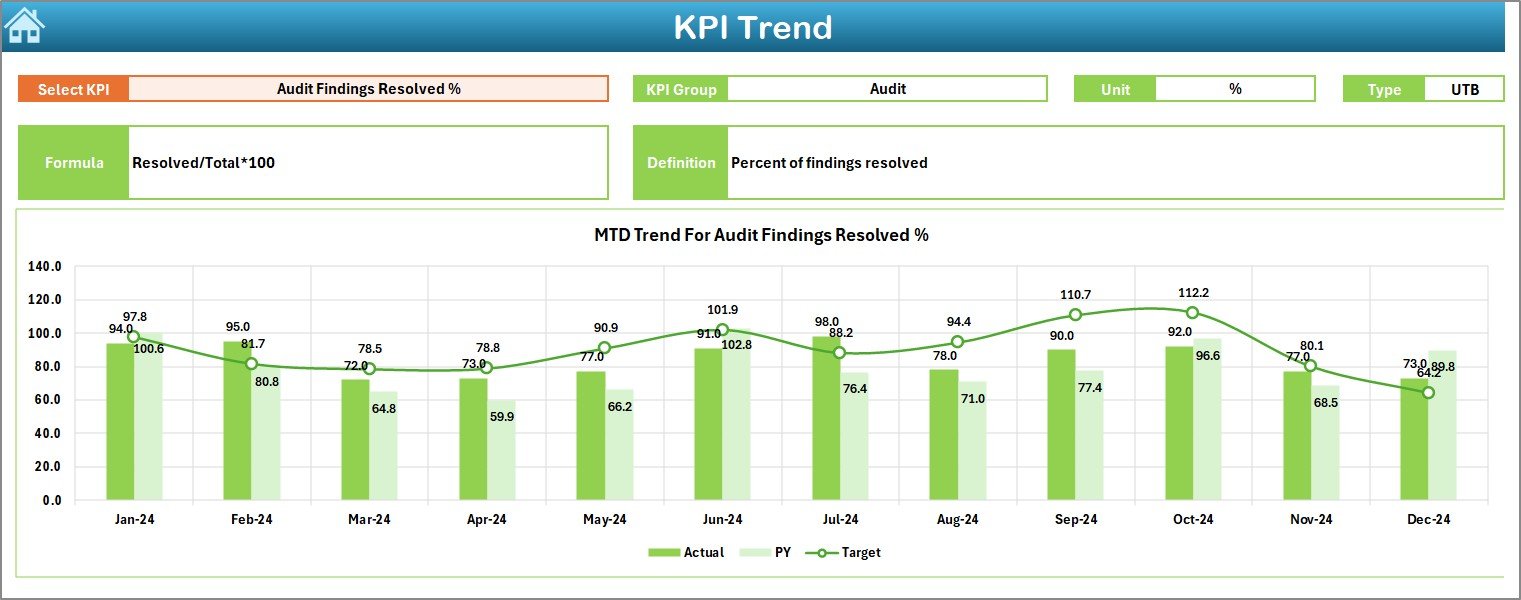
KPI Trend Sheet – Track trends with charts for MTD & YTD comparisons, filtered by KPI.
-
Actual Numbers Input Sheet – Simple, structured data entry for monthly compliance results.
-
Target Sheet – Define compliance benchmarks for MTD & YTD analysis.
-
Previous Year Numbers Sheet – Store historical data for year-over-year performance comparisons.
-
KPI Definition Sheet – Provides a clear dictionary of all KPIs with Group, Unit, Formula, and Definition.
Together, these features make compliance monitoring efficient, reliable, and audit-ready.
📦 What’s Inside the Product
When you download this Excel dashboard, you’ll get:
1️⃣ A fully interactive dashboard with MTD & YTD analysis.
2️⃣ Data entry sheets for actuals, targets, and previous year data.
3️⃣ Trend analysis visuals to detect compliance gaps early.
4️⃣ Predefined KPI dictionary for clarity and standardization.
5️⃣ Built-in conditional formatting (red/green arrows) to highlight risks.
This structured approach ensures data integrity, transparency, and accuracy in reporting.
🛠️ How to Use the Dashboard
✔️ Step 1 – Enter Data: Input monthly actuals into the “Actual Numbers Input” sheet.
✔️ Step 2 – Set Benchmarks: Add targets in the “Target Sheet” to track against.
✔️ Step 3 – Load Historical Data: Enter previous year values for benchmarking.
✔️ Step 4 – Review the Dashboard: Select the reporting month in the Dashboard sheet to see automatic updates.
✔️ Step 5 – Analyze Trends: Use the KPI Trend sheet for performance insights.
✔️ Step 6 – Share Reports: Export visuals for audit preparation or board meetings.
No advanced Excel skills required—everything is automated with formulas, charts, and slicers.
👥 Who Can Benefit from This Dashboard?
⚖️ Compliance Officers – Ensure all KPIs meet legal standards.
📊 Auditors – Access year-over-year comparisons for audit trails.
🏢 Legal Teams – Monitor risk exposure and regulatory adherence.
📈 Senior Management – Gain a high-level compliance performance overview.
💼 SMEs & Corporates – From small businesses to enterprises, the dashboard is scalable.
✅ Advantages of the Dashboard
-
Centralized Reporting – All compliance KPIs in one place.
-
Time-Saving – Automated updates reduce manual reporting efforts.
-
Accuracy – Structured data entry reduces human errors.
-
Visual Insights – Charts and arrows instantly highlight compliance gaps.
-
Audit-Ready – Historical data makes audits stress-free.
-
Customizable – Add or remove KPIs as per your organization’s needs.
-
Cost-Effective – Avoid expensive compliance software with this Excel solution.
🚀 Opportunities for Improvement
🔹 Integrate with Power BI for advanced analytics.
🔹 Add role-based access for sensitive compliance data.
🔹 Automate alerts when KPIs fall below thresholds.
🔹 Link the dashboard with ERP/CRM tools for real-time updates.
🔹 Expand KPI coverage to include emerging regulations.
📌 Best Practices for Using the Dashboard
-
Keep KPIs Relevant – Only track compliance-critical metrics.
-
Update Regularly – Input monthly data consistently.
-
Use Conditional Formatting Wisely – Highlight only critical variances.
-
Maintain Historical Records – Keep last year’s data for better comparisons.
-
Train Staff – Ensure all stakeholders can use the dashboard confidently.
-
Review Annually – Update KPIs as compliance regulations evolve.
🏆 Conclusion
The Legal and Compliance Operations KPI Dashboard in Excel is more than a spreadsheet — it is a compliance management system. By consolidating all KPIs into one structured template, it simplifies monitoring, enhances accuracy, and reduces risks.
Whether you’re preparing for audits, managing legal risks, or ensuring smooth regulatory operations, this Excel tool provides everything you need for data-driven decision-making and compliance success.
📖 Click here to read the Detailed blog post
🎥 Visit our YouTube channel to learn step-by-step video tutorials
👉 Youtube.com/@PKAnExcelExpert












Reviews
There are no reviews yet.