In today’s competitive business environment, quality is more than a metric — it’s a promise to your customers and a reflection of your operational excellence. But managing quality isn’t easy. Without the right tools, you’re left sifting through spreadsheets, juggling reports, and guessing at insights.
What if you could bring clarity, consistency, and real-time insights to your quality assurance process — without building everything from scratch?
This guide introduces seven powerful ways quality teams can transform their QA tracking and decision-making using ready-to-use dashboards and reports. We’ll focus on three standout solutions — one each for Power BI, Excel, and Google Sheets — so you can choose the format that fits your workflow best.
📊 1. Overview: Why You Need Smart QA Tools
Traditional QA tracking usually means:
-
Manual data entry across multiple files
-
Time-consuming report creation
-
Inconsistent metrics & definitions
-
Slow decision cycles when defects spike
The good news? You don’t need to build reports from scratch anymore. Each of the following solutions is pre-built, customizable, and designed to make quality insights actionable across teams — from frontline inspectors to senior operations managers.
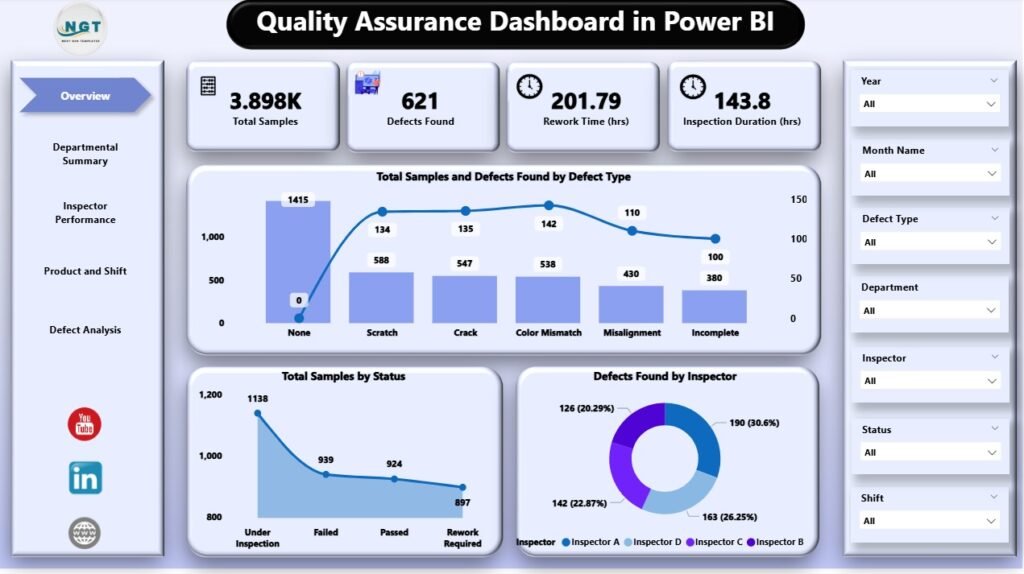
📈 2. Deep Dive: Quality Assurance Dashboard in Power BI
Experience what real-time quality visibility looks like with Quality Assurance Dashboard in Power BI.

⭐ Key Benefits
-
Interactive visuals: Explore defects, rework hours, and inspection metrics with interactive filters.
-
Real-time reporting: Instantly refresh dashboards as new data flows in.
-
Power BI interactivity: Drill down into trends, performance by shift, and department-level quality stats.
🚀 Why This Matters
Power BI is a game changer for teams that require deep analytics and interactive dashboards across multiple quality dimensions. Instead of static charts, you get a dynamic reporting environment where users can explore trends, spot bottlenecks, and uncover hidden patterns — whether at the plant floor or the executive suite.
✔ Ideal For: Quality managers, analysts, senior leaders
✔ Best Use: Long-term trend analysis, cross-department performance tracking
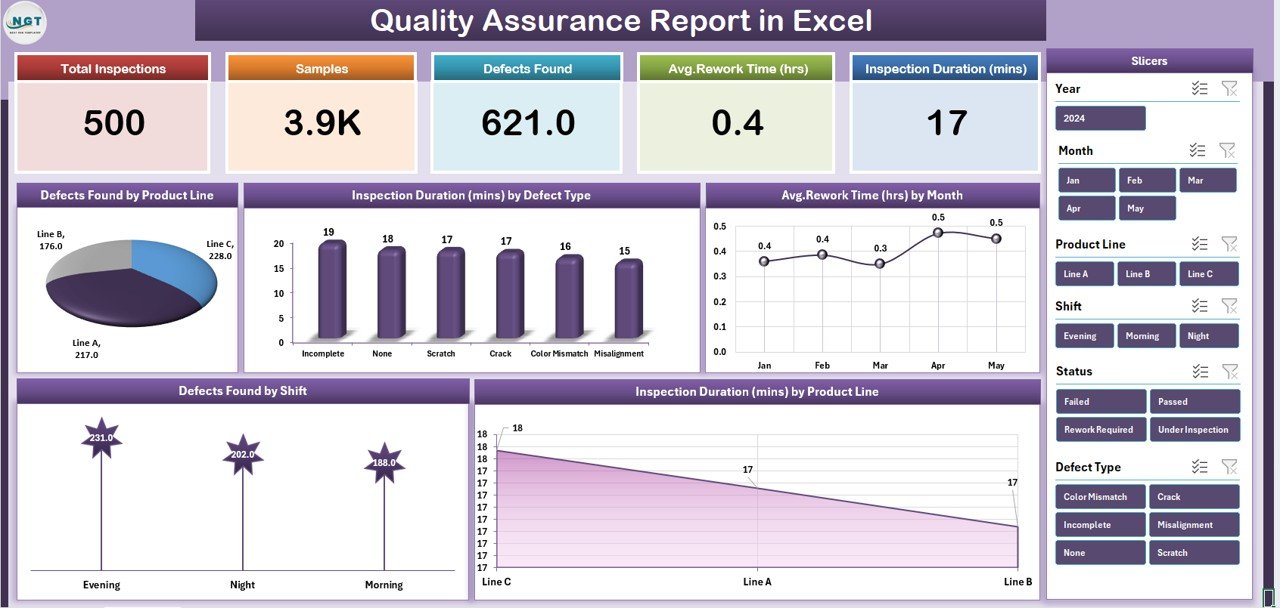
📊 3. Simplest All-in-One: Quality Assurance Report in Excel
If you prefer Excel’s flexibility and universal familiarity, then Quality Assurance Report in Excel is the perfect choice.
🌟 Excel Report Highlights
-
Interactive dashboards & KPI cards that update with fresh data.
-
Charts & tables for defects, inspection times, and rework hours.
-
Zero setup required: Open the file, input your data, and start reviewing.
🧠 Why Excel Works
Excel remains the backbone of business reporting — especially for teams that want full control over formulas, layouts, and annotations. This quality assurance report elevates Excel beyond static tables, turning it into a powerful performance reporting tool that’s:
-
Easy to customize
-
Universally compatible
-
Shareable via email or cloud folders
✔ Ideal For: Operations teams, QA analysts, Excel-savvy users
✔ Best Use: Weekly quality reviews, internal presentations
📊 4. Collaborative and Cloud-Ready: Quality Assurance Dashboard in Google Sheets
For teams that thrive on collaboration, there’s Quality Assurance Dashboard in Google Sheets.
🔍 What You Get
-
Dashboard overview: Monitor total samples, defects, rework time, and inspection durations.
-
Search & filter tools: Instantly find specific data without endless scrolling.
-
Trend charts: See monthly and shift-wise trends at a glance.
-
Real-time updating: Collaboration with teammates in real time, tracked across devices.

🤝 Why Google Sheets Is Great
There’s a reason Google Sheets is a widespread favorite: collaboration without barriers. Quality teams can:
-
Work on inspection data together
-
View updates instantly on mobile or desktop
-
Share reports with external partners without versioning conflicts
✔ Ideal For: Distributed teams, cross-functional QA groups
✔ Best Use: Live tracking, remote collaborations
🔥 5. Head-to-Head: Choosing the Right Format
Here’s a quick comparison to help you pick the best fit:
| Feature | Power BI | Excel | Google Sheets |
|---|---|---|---|
| Real-time interactivity | ⭐⭐⭐⭐ | ⭐⭐ | ⭐⭐⭐⭐ |
| Ease of setup | ⭐⭐⭐ | ⭐⭐⭐⭐ | ⭐⭐⭐⭐ |
| Collaboration | ⭐⭐ | ⭐⭐ | ⭐⭐⭐⭐ |
| Deep analytics | ⭐⭐⭐⭐ | ⭐⭐⭐ | ⭐⭐⭐ |
| Best for trend analysis | ⭐⭐⭐⭐ | ⭐⭐ | ⭐⭐⭐ |
| Best for operational teams | ⭐⭐⭐ | ⭐⭐⭐⭐ | ⭐⭐⭐⭐ |
👉 Power BI wins when you need data exploration and executive-level dashboards.
👉 Excel shines for structured weekly reporting with maximum flexibility.
👉 Google Sheets excels where real-time teamwork and cloud access are priorities.
🧩 6. Real-World Use Cases
Think about your QA challenges:
✔ Manufacturing floor: Track defects per shift and root-cause anomalies.
✔ Service quality teams: Monitor customer service inspection ratings.
✔ Cross-plant analysis: Compare quality performance across facilities.
All three templates support these scenarios — but the choice of platform determines how you share insights and collaborate.
🚀 Final Thoughts: Quality You Can Act On
Quality assurance isn’t just about metrics — it’s about making decisions that reduce defects, streamline processes, and boost customer satisfaction.
Whether you prefer powerful analytics with Power BI, the adaptability of Excel, or collaborative simplicity with Google Sheets, NextGen Templates gives you practical tools that work right out of the box.
💡 Ready to revolutionize your QA tracking?
Start with the tools that match your team’s workflow and expand as your data maturity grows.
Visit our YouTube channel to watch the demo.