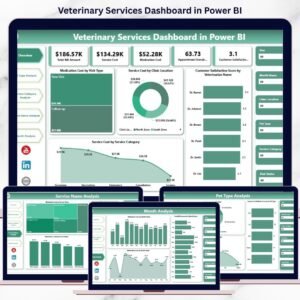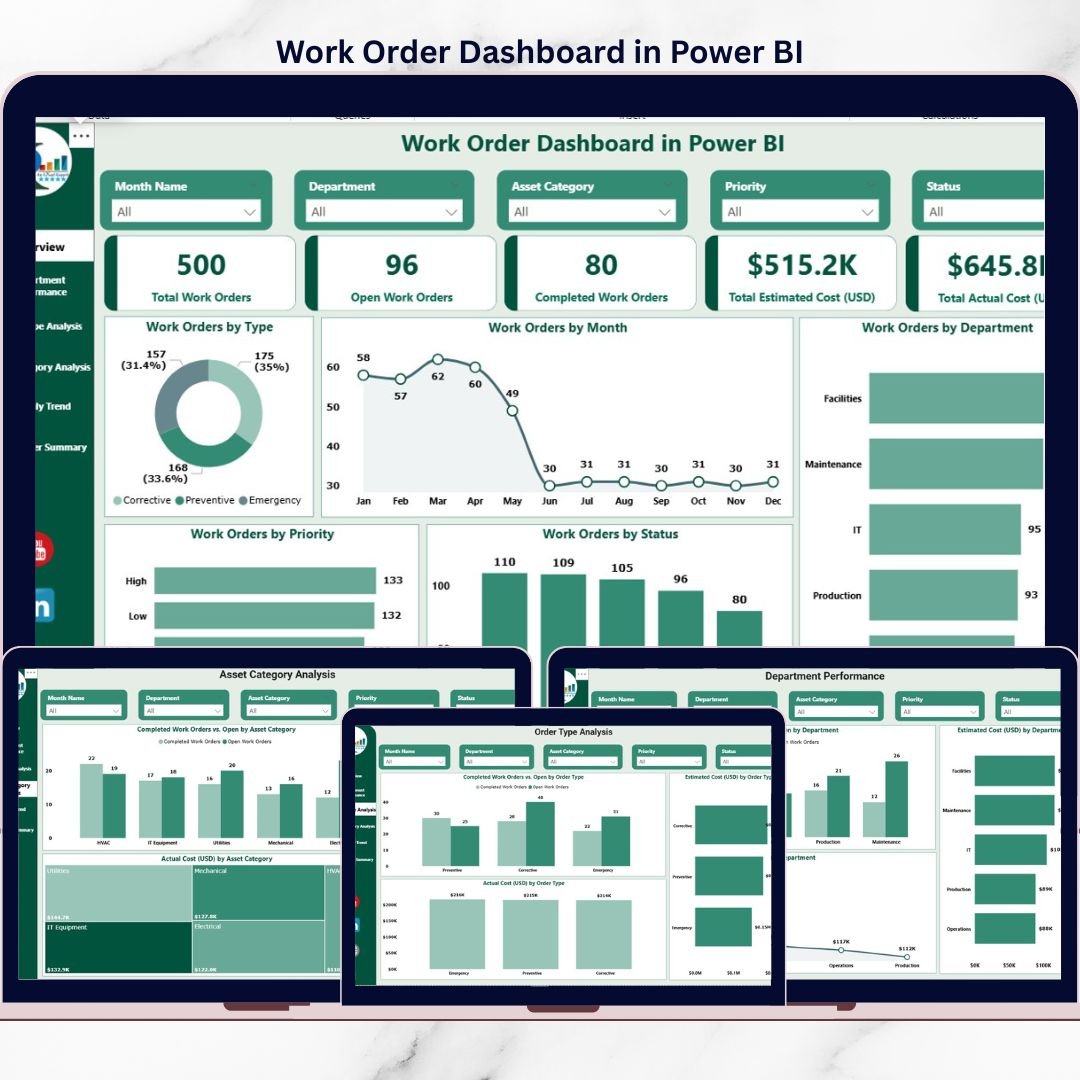
Managing work orders using emails, paper logs, or multiple Excel sheets quickly leads to delays, confusion, and uncontrolled maintenance costs. As operations scale, tracking open jobs, monitoring expenses, and evaluating performance becomes extremely difficult. That is exactly where the Work Order Dashboard in Power BI becomes a powerful game-changer 🚀.
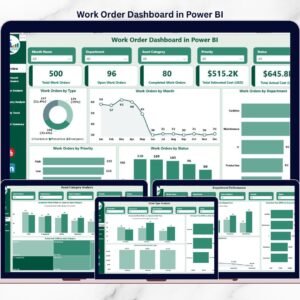
This professionally designed Work Order Dashboard in Power BI converts raw maintenance data into clear, interactive, and decision-ready insights. Instead of guessing what is happening on the shop floor or across facilities, you gain real-time visibility into work orders, costs, departments, assets, priorities, and trends—all in one centralized dashboard.
Built for speed, clarity, and control, this dashboard helps organizations move from reactive maintenance to proactive operational management.
🔹 Key Features of Work Order Dashboard in Power BI
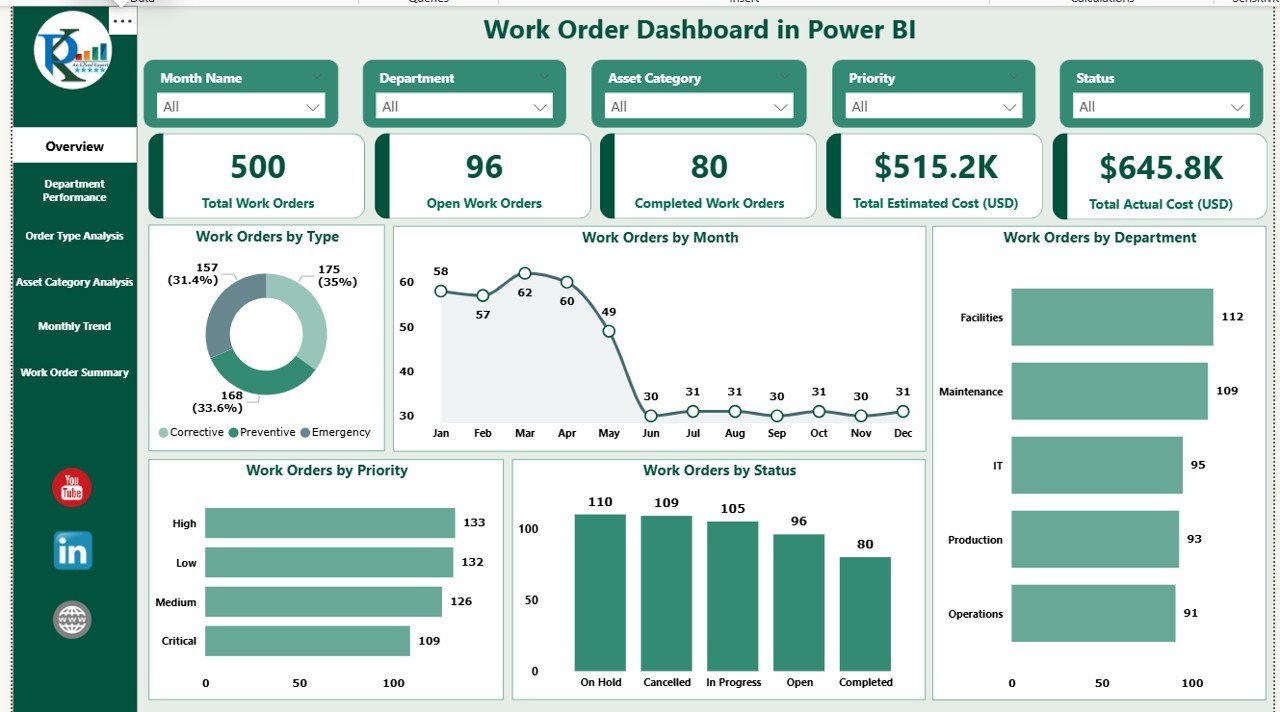
📊 Real-Time Work Order Tracking
Monitor total, open, and completed work orders instantly without manual follow-ups.
💰 Estimated vs Actual Cost Comparison
Identify cost overruns early and control maintenance budgets effectively.
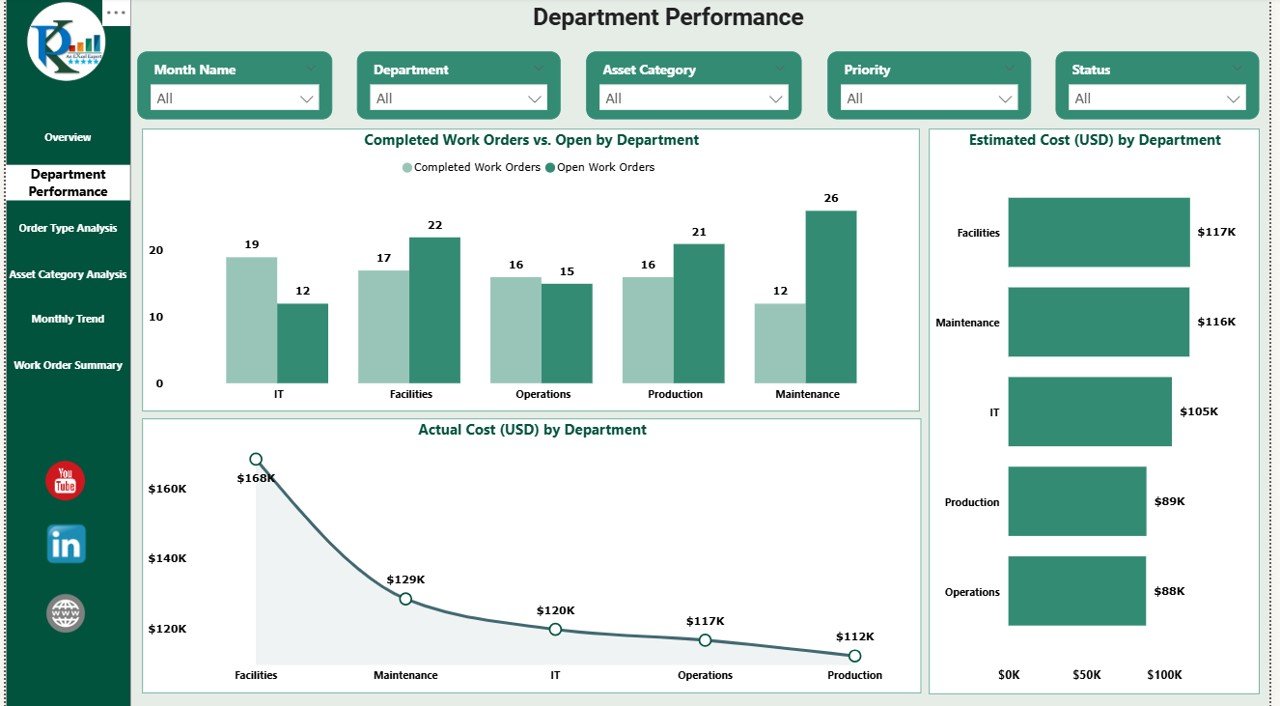
🏢 Department-Wise Performance Analysis
Compare how different departments handle workload, completion rates, and expenses.
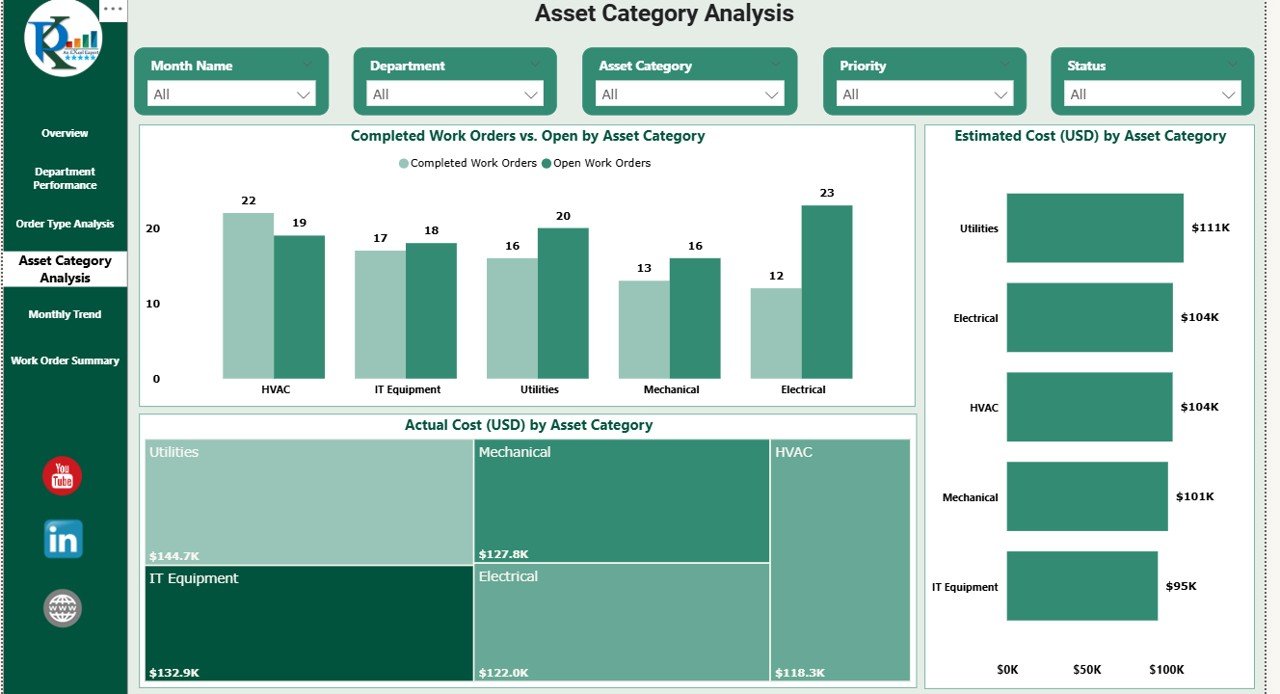
⚙️ Asset Category Insights
Detect high-maintenance assets and plan preventive actions before failures occur.
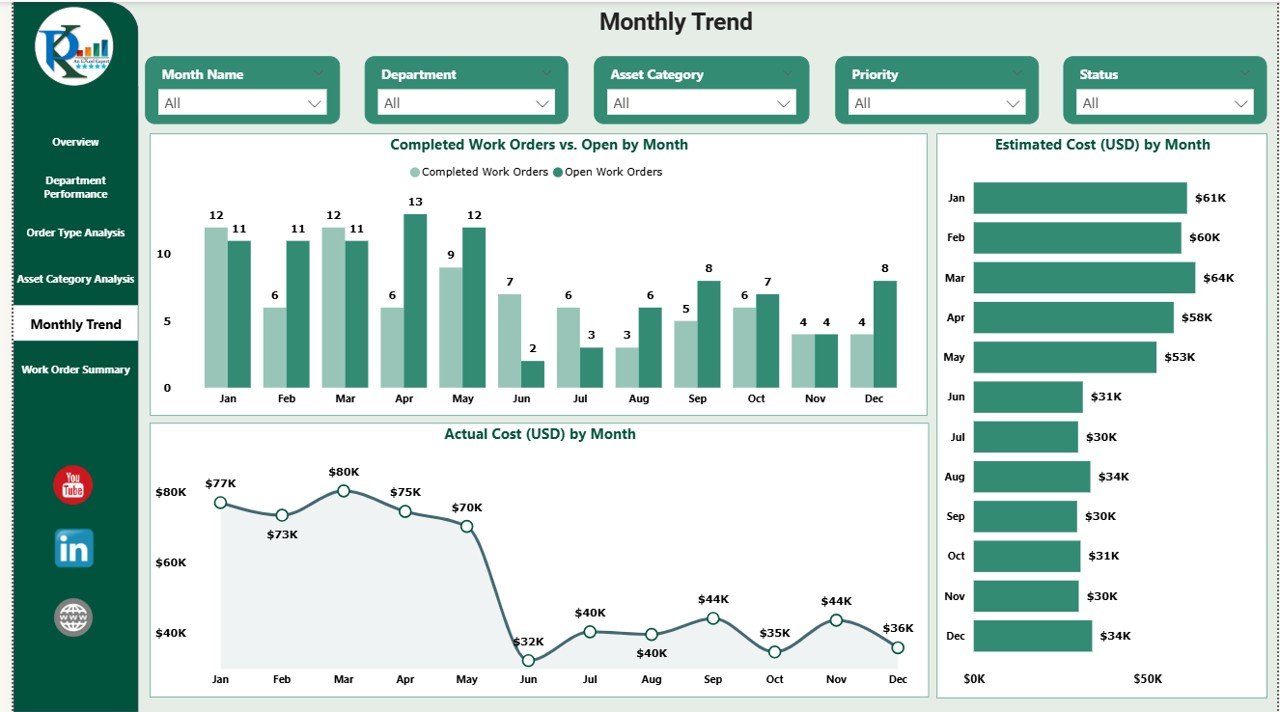
📈 Monthly Trend Analysis
Track work order volume and cost behavior over time to identify seasonal spikes.
🎯 Priority & Status Monitoring
Focus immediately on critical and high-priority work orders.
🧭 Interactive Filters & Slicers
Analyze data by date, department, priority, asset category, and work order type.
🔹 What’s Inside the Work Order Dashboard in Power BI
This dashboard includes 6 fully structured and interactive pages, each designed to answer critical operational questions:
📌 Overview Page – Get a complete snapshot of maintenance performance with KPIs and distribution charts.
📌 Department Performance – Compare completed vs open work orders and costs by department.
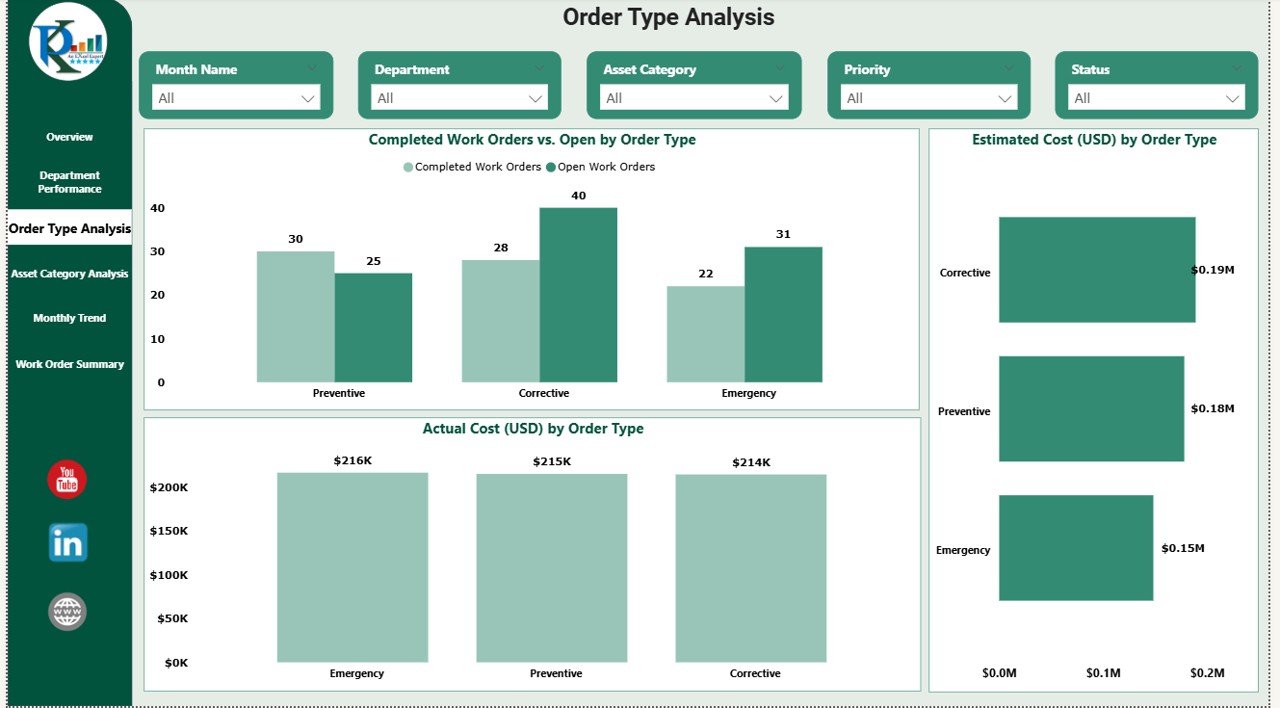
📌 Order Type Analysis – Understand which work order types drive the highest workload and expenses.
📌 Asset Category Analysis – Identify asset groups requiring frequent maintenance.
📌 Monthly Trends – Track how work orders and costs evolve month by month.
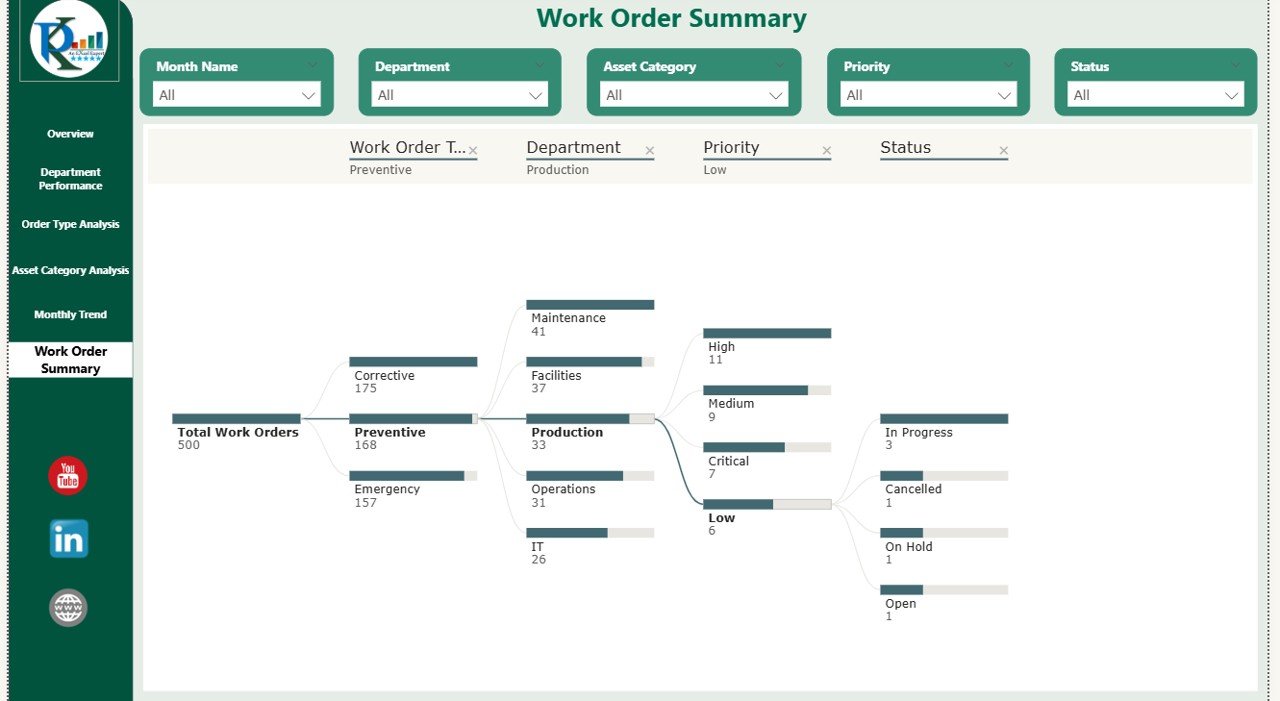
📌 Work Order Summary – A consolidated view for fast management reviews and decision-making.
Every page is designed to reduce analysis time and increase actionability.
🔹 How to Use the Work Order Dashboard in Power BI
Using this dashboard is simple and efficient:
1️⃣ Load your work order data from Excel, ERP, CMMS, or databases
2️⃣ Refresh the Power BI file
3️⃣ Use slicers to filter by department, date, priority, or status
4️⃣ Review KPIs, charts, and trends
5️⃣ Take faster and smarter maintenance decisions
Once refresh is set, the dashboard updates automatically—ensuring you always work with the latest data.
🔹 Who Can Benefit from This Work Order Dashboard in Power BI
👷 Maintenance Managers – Track workloads, delays, and costs effortlessly
🏭 Operations Heads – Improve operational efficiency and planning
🏢 Facility Managers – Monitor asset performance and maintenance trends
💼 Finance Teams – Control estimated vs actual maintenance expenses
📊 Senior Leadership – Get high-level insights without digging into raw data
Industries That Benefit:
Manufacturing, Facilities Management, Healthcare, Utilities, Real Estate, Transportation, and more.
Click here to read the Detailed blog post
Watch the step-by-step video tutorial:
Visit our YouTube channel to learn step-by-step video tutorials