In today’s competitive financial landscape, wealth management firms must operate with precision, transparency, and speed. Tracking performance manually through scattered Excel files, static PDFs, or delayed reports often leads to missed opportunities and unclear decision-making. That is exactly why a Wealth Management KPI Dashboard in Power BI becomes a mission-critical digital product.
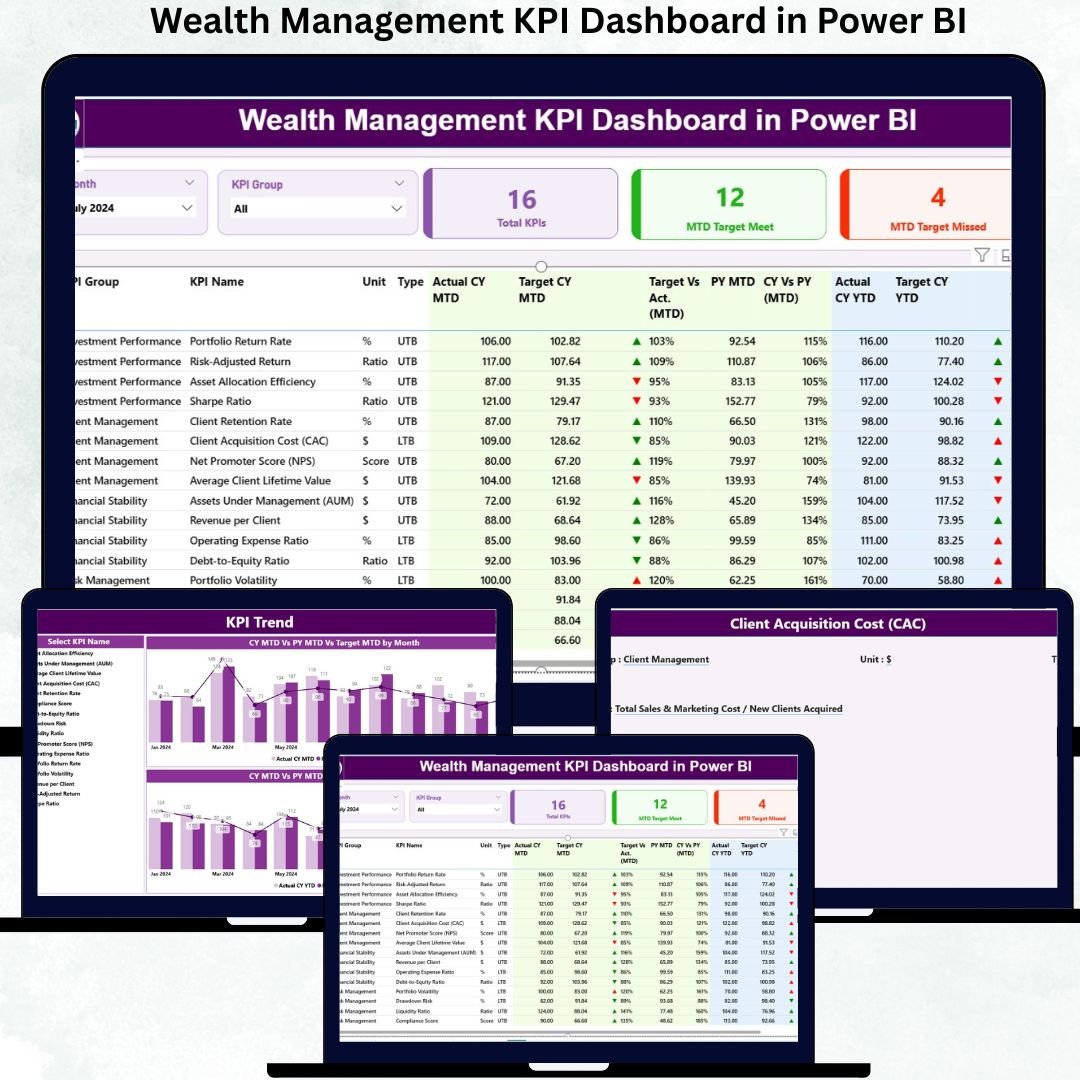
The Wealth Management KPI Dashboard in Power BI is a ready-to-use, interactive performance management solution designed specifically for wealth managers, private banks, investment firms, and financial advisory teams. It converts structured Excel data into powerful Power BI visuals that clearly show MTD, YTD, target vs actual, and previous-year comparisons—all in one centralized dashboard.
Instead of spending hours preparing reports, leadership teams can instantly understand performance, identify weak KPIs, and communicate results confidently with stakeholders and investors.
✨ Key Features of the Wealth Management KPI Dashboard in Power BI
This dashboard is professionally designed with three high-impact analytical pages, each serving a unique purpose.
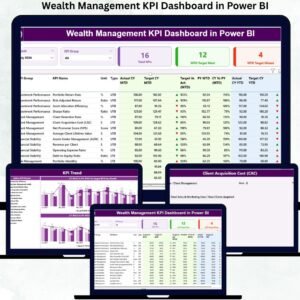
⭐ Summary Page – Executive KPI Control Center
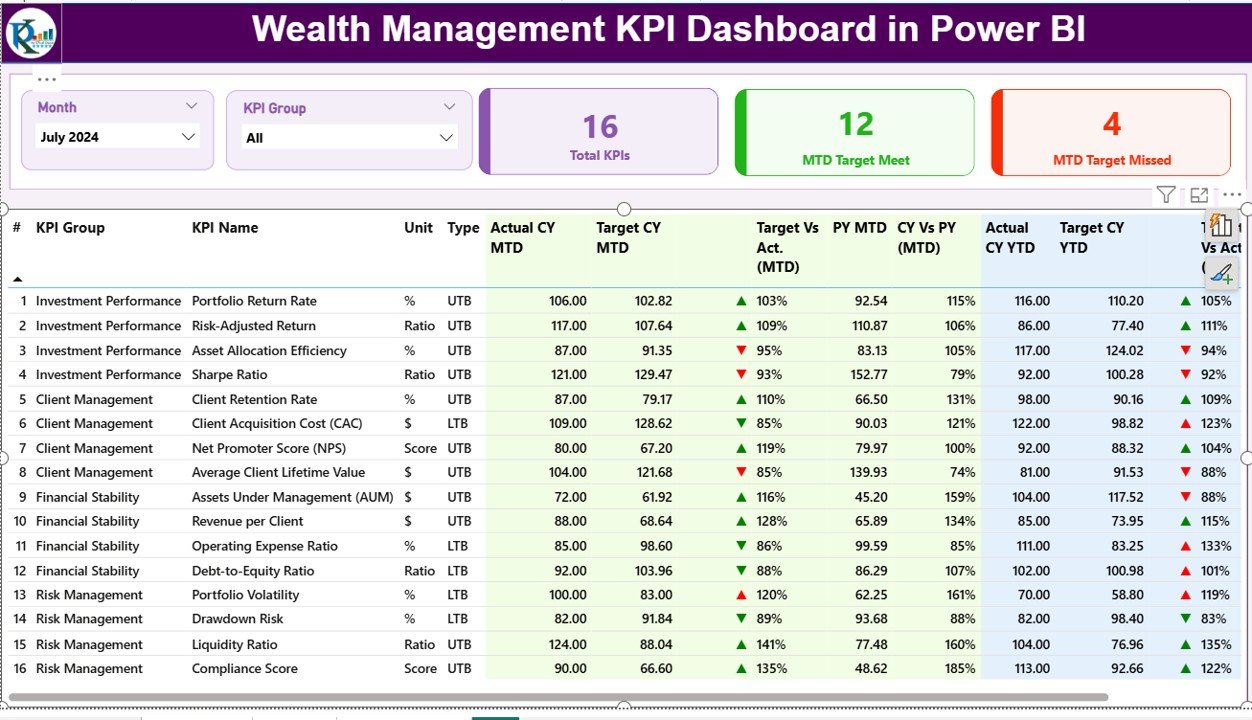
The Summary Page acts as the heart of the dashboard.
✔ Dynamic slicers:
-
Month slicer
-
KPI Group slicer
✔ Three KPI cards:
-
Total KPIs Count
-
MTD Target Met Count
-
MTD Target Missed Count
✔ Detailed KPI performance table showing:
-
KPI group, unit, type (UTB / LTB)
-
Actual vs Target (MTD & YTD)
-
CY vs PY comparison
-
Green ▲ and Red ▼ performance icons
This page allows instant identification of over-performing and under-performing KPIs, making it ideal for leadership reviews and investor discussions.
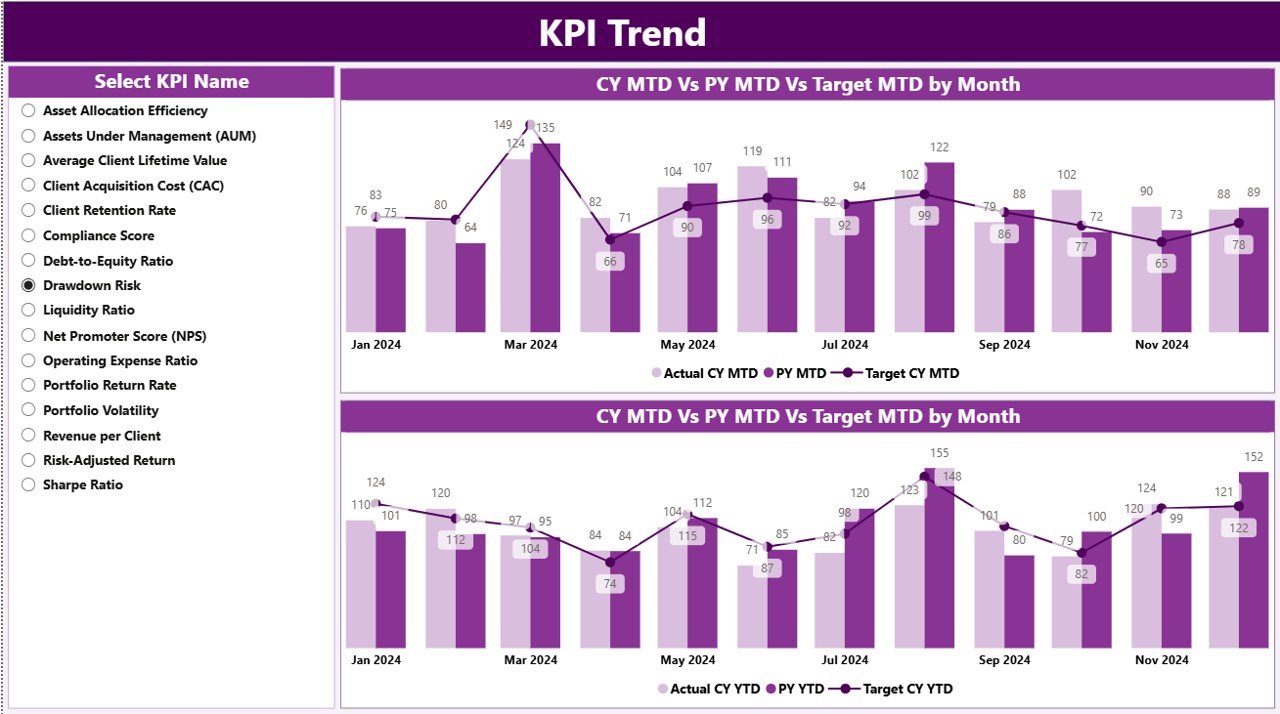
⭐ KPI Trend Page – Performance Movement Over Time
Numbers alone do not tell the full story. Trends provide context.
✔ Two powerful combo charts:
-
MTD Trend (Actual vs Target vs PY)
-
YTD Trend (Actual vs Target vs PY)
✔ KPI Name slicer:
-
Select any KPI
-
Instantly visualize its performance trend
This page is extremely useful for root-cause analysis, performance storytelling, and future planning.
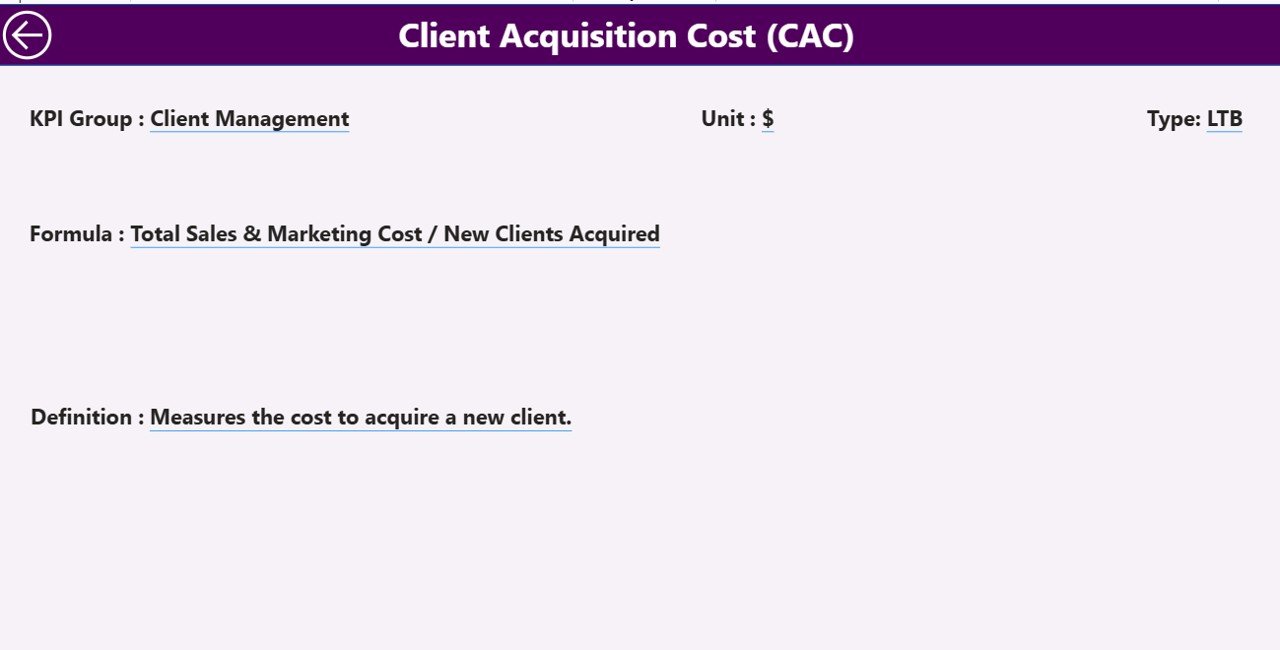
⭐ KPI Definition Page – Transparency & Governance
This hidden drill-through page ensures absolute KPI clarity.
✔ Displays:
-
KPI Formula
-
KPI Definition
-
Unit
-
Type (UTB or LTB)
From the Summary Page, users can drill through to understand KPI logic without cluttering the main dashboard. This improves governance, audit readiness, and stakeholder trust.
📦 What’s Inside the Wealth Management KPI Dashboard
When you download this product, you receive:
✅ Ready-to-use Power BI dashboard file
✅ Structured Excel data input template
✅ Automated MTD & YTD KPI calculations
✅ Current Year vs Previous Year comparison
✅ Target vs Actual tracking with icons
✅ Drill-through KPI documentation page
✅ Professional, investor-ready visuals
Simply update Excel and refresh Power BI—no redesign required.
🛠️ How to Use the Wealth Management KPI Dashboard
1️⃣ Update KPI actual data in the Input_Actual Excel sheet
2️⃣ Update KPI targets in the Input_Target sheet
3️⃣ Maintain KPI details in the KPI Definition sheet
4️⃣ Refresh Power BI
5️⃣ Use slicers to analyze performance
6️⃣ Present insights to leadership and investors
No advanced Power BI knowledge is required.
👥 Who Can Benefit from This Dashboard
This dashboard is ideal for:
✔ Wealth Managers
✔ Portfolio & Investment Managers
✔ Financial Analysts
✔ Relationship Managers
✔ CFOs & Finance Leaders
✔ Senior Management Teams
✔ Strategy & Planning Teams
Both technical and non-technical users can use it with ease.
### 📘 Click here to read the Detailed blog post
🎥 Visit our YouTube channel to learn step-by-step video tutorials
👉 Youtube.com/@PKAnExcelExpert


Reviews
There are no reviews yet.