Water scarcity has become one of the most pressing global challenges. Many countries now depend heavily on water desalination plants to convert seawater into safe drinking water. However, operating a desalination facility requires continuous monitoring of operational performance, energy efficiency, production capacity, and plant reliability.
Managing all these metrics manually can be extremely difficult. Water Desalination KPI Dashboard in Power BI When data is scattered across spreadsheets and reports, managers often struggle to track KPI performance, compare targets with actual results, and identify operational issues quickly.
This is exactly where the Water Desalination KPI Dashboard in Power BI becomes a powerful solution.
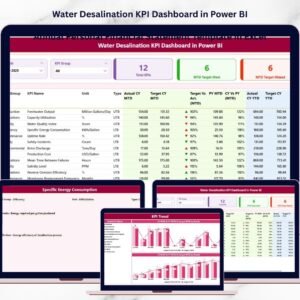
The Water Desalination KPI Dashboard in Power BI is a ready-to-use analytics solution designed to help water utilities and infrastructure organizations monitor plant performance through interactive KPI visualizations, trend charts, and target comparisons.
Water Desalination KPI Dashboard in Power BI Using Power BI’s advanced visualization and filtering capabilities, this dashboard transforms raw desalination plant data into clear and actionable insights. Managers can instantly track operational KPIs, monitor monthly and yearly performance trends, and evaluate whether plant operations meet performance targets.
Instead of manually reviewing operational reports, decision-makers can explore performance data through dynamic dashboards, KPI indicators, and drill-through analytics.
The dashboard integrates seamlessly with Excel data sources, making it easy for organizations to update KPI data and automatically refresh the Power BI reports.
Whether you manage water desalination plants, utility infrastructure, or environmental operations, this dashboard provides a structured and efficient way to monitor plant performance and support data-driven decision-making.
💧 Key Feature of Water Desalination KPI Dashboard in Power BI
📊 Centralized KPI Monitoring
Track all desalination plant KPIs in one centralized dashboard for better operational visibility.
📈 Target Achievement Tracking
Instantly see which KPIs meet or miss performance targets using visual indicators.
📉 Previous Year Performance Comparison
Evaluate plant performance improvements using year-over-year KPI comparisons.
📅 Month-to-Date and Year-to-Date Analytics
Analyze both short-term and long-term operational performance.
📊 Interactive KPI Performance Table
View detailed KPI metrics including targets, actual values, and historical comparisons.
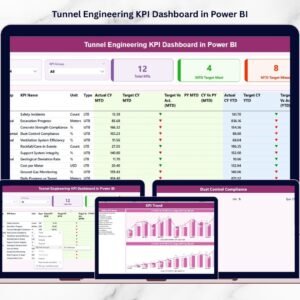
📉 Trend Analysis Charts
Analyze KPI performance trends using interactive MTD and YTD charts.
🔍 Power BI Interactive Filters
Use slicers to analyze data by month and KPI group.
⚡ Excel Data Integration
Update KPI values in Excel and automatically refresh Power BI reports.
📦 What’s Inside the Water Desalination KPI Dashboard in Power BI
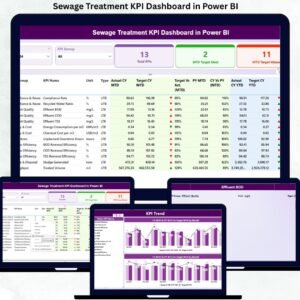
This ready-to-use Power BI dashboard contains three powerful analytical pages designed to provide complete KPI insights.
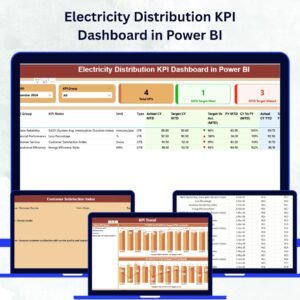
Summary Page
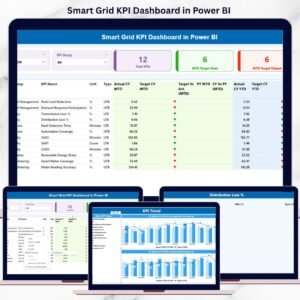
The Summary Page serves as the main performance monitoring screen. It displays KPI cards, performance indicators, and a detailed KPI table.

The page includes important KPI indicators such as:
Total KPIs Count
MTD Target Meet Count
MTD Target Missed Count
The detailed KPI table also shows:
Actual MTD performance
Target MTD values
Previous year comparisons
Target vs Actual percentage differences
Year-to-date KPI performance
This allows managers to quickly identify underperforming KPIs.
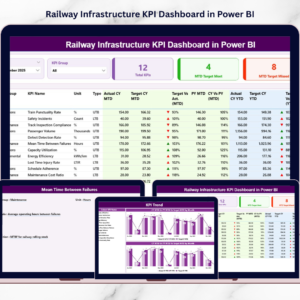
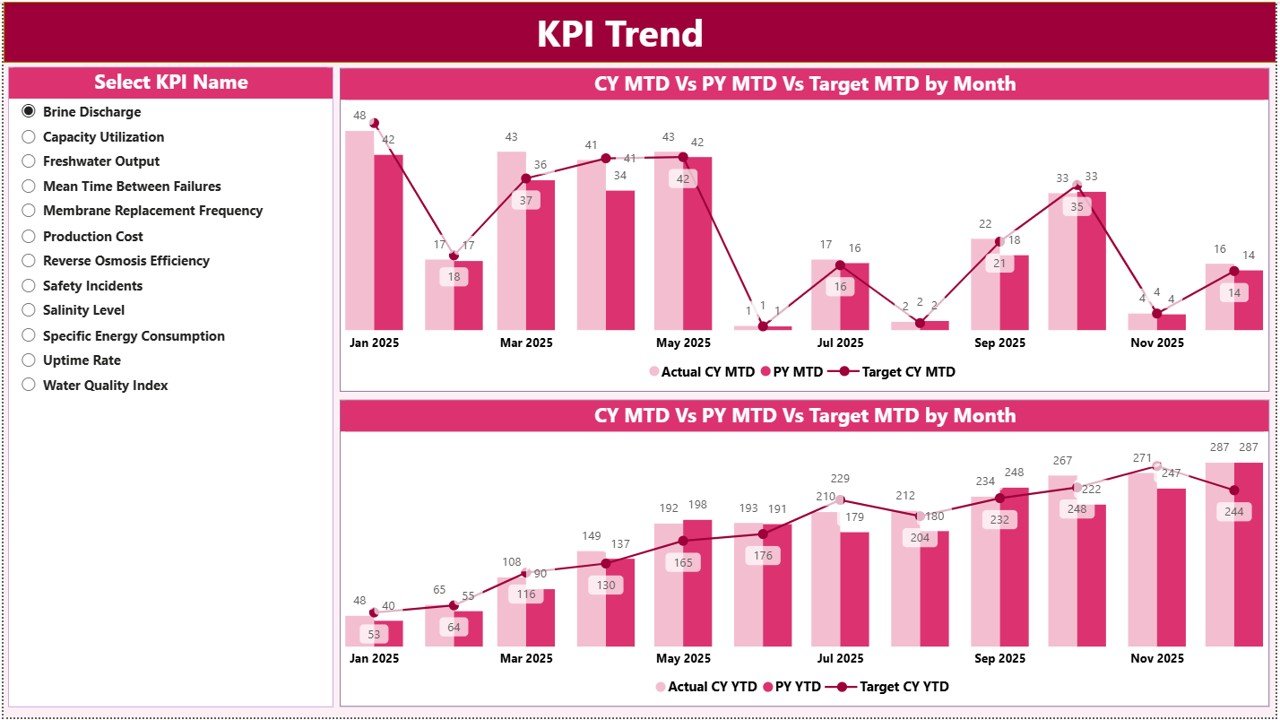
KPI Trend Page
The KPI Trend Page provides time-based analysis of individual KPIs.
Users can select a KPI from the slicer and view trend charts including:
MTD performance trends
YTD performance trends
Target vs actual comparisons
Previous year comparisons
These trend charts help managers analyze KPI performance patterns over time.
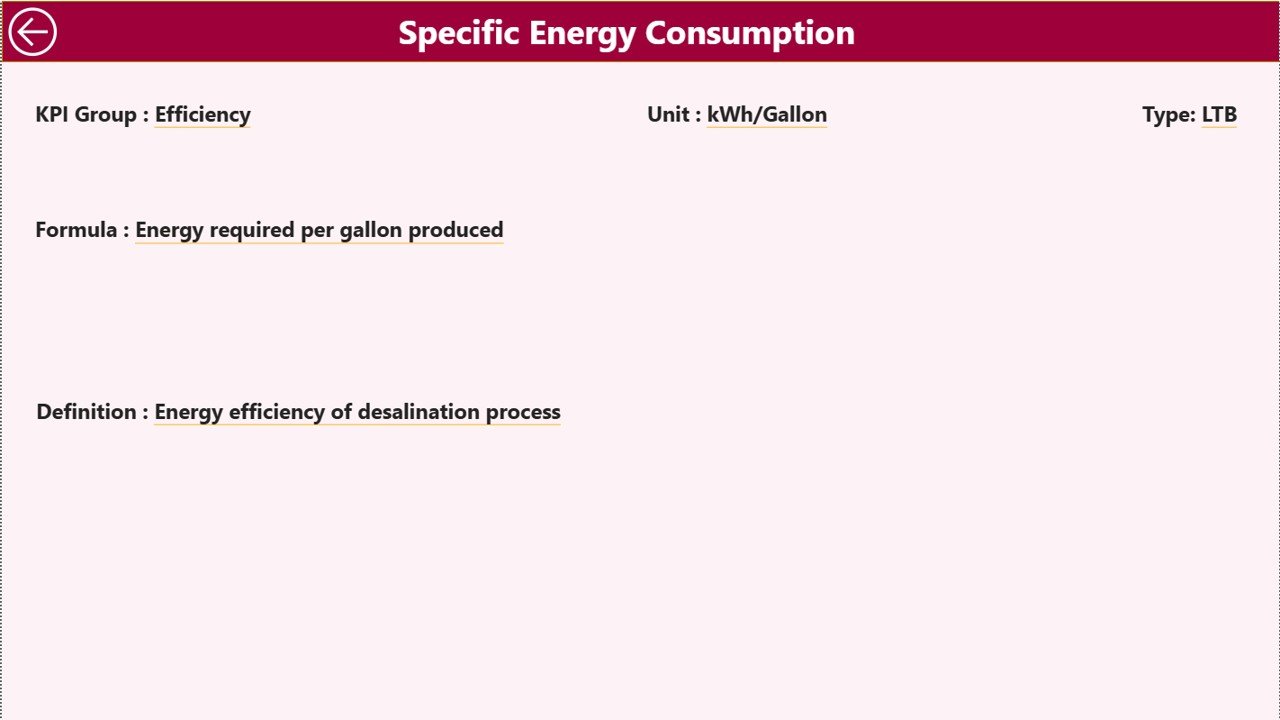
KPI Definition Page
The KPI Definition Page acts as a reference library containing detailed KPI information.
It includes:
KPI definitions
KPI formulas
Measurement units
KPI groups
KPI type (Lower the Better or Upper the Better)
This page works as a drill-through page, allowing users to access KPI explanations directly from the Summary Page.
🧭 How to Use the Water Desalination KPI Dashboard in Power BI
Using this dashboard is simple and requires only basic Power BI knowledge.
Step 1 – Update Excel Data Source
Enter KPI actual values, target values, and KPI definitions in the Excel input sheets.
Step 2 – Refresh the Power BI Dashboard
Once the Excel data is updated, refresh the Power BI dataset to update all visuals.
Step 3 – Use Filters and Slicers
Select specific months or KPI groups to analyze plant performance.
Step 4 – Review KPI Indicators
Check visual indicators to identify which KPIs meet or miss performance targets.
Step 5 – Analyze KPI Trends
Use trend charts to evaluate operational performance over time.
This structured workflow enables organizations to quickly identify operational issues and optimize desalination plant performance.
👥 Who Can Benefit from This Water Desalination KPI Dashboard
This dashboard is ideal for organizations responsible for water infrastructure and desalination plant operations.
💧 Desalination plant operators
🏭 Water utility companies
🌍 Government water authorities
⚙️ Infrastructure management teams
👷 Environmental engineers
📊 Operations managers
📈 Utility performance analysts
Any organization managing desalination operations can use this dashboard to improve operational efficiency and performance monitoring.
Click hare to read the Detailed blog post
Visit our YouTube channel to learn step-by-step video tutorials
👉 https://youtube.com/@PKAnExcelExpert