Waste operations never stop. Cities expand. Waste volume increases. Fuel prices fluctuate. Vehicles break down. Labor costs rise. Meanwhile, service ratings must stay high every single day.
If you are still tracking vehicles, costs, and teams in scattered spreadsheets, you are reacting too late.
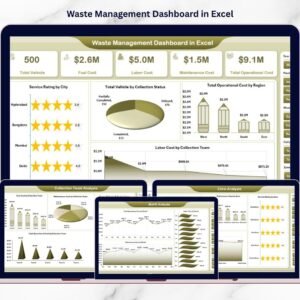
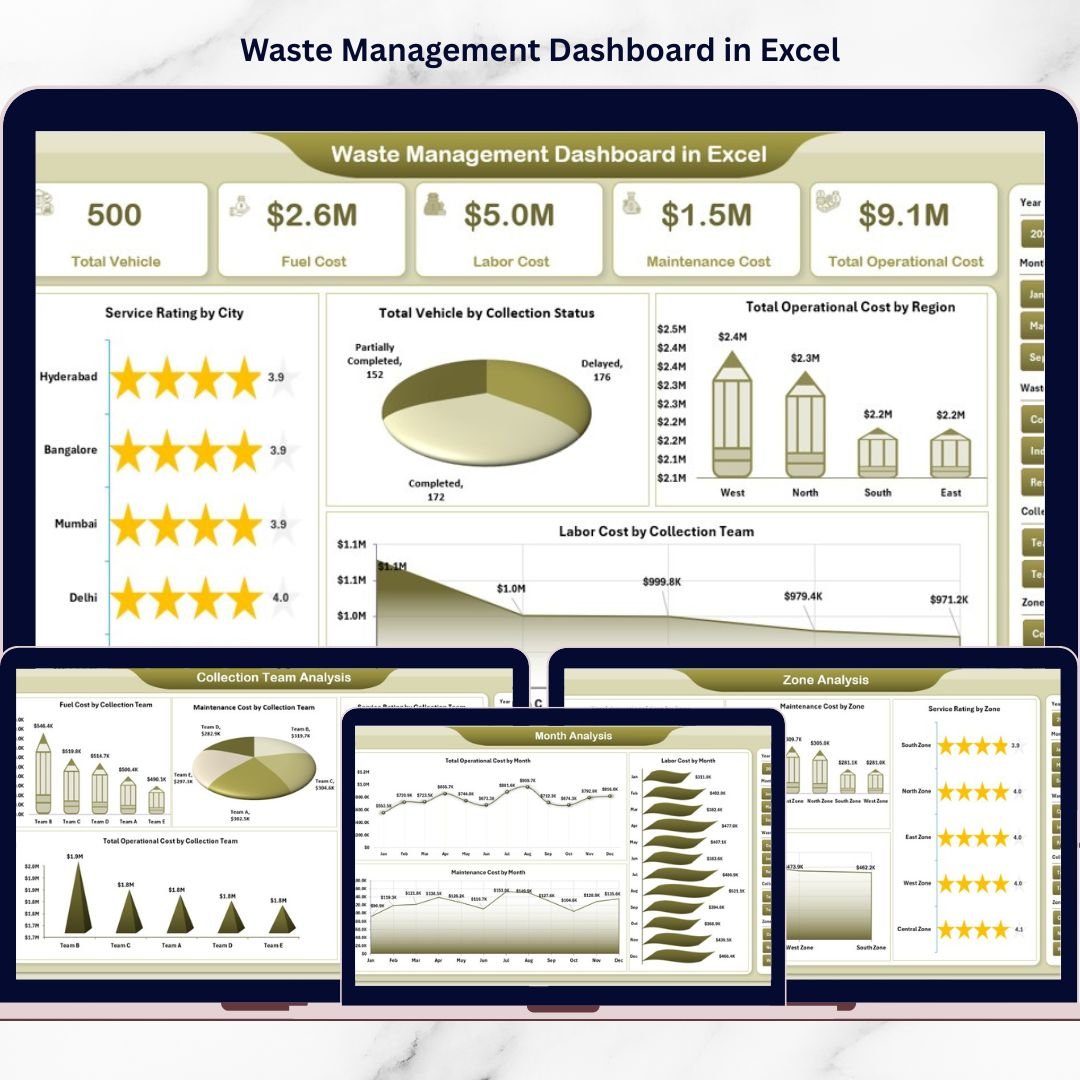
Introducing the Waste Management Dashboard in Excel — a ready-to-use, interactive performance tracking system built for municipalities, private waste contractors, and environmental service providers.
This powerful Excel dashboard centralizes vehicles, operating cost, maintenance expenses, labor cost, service ratings, and monthly trends — all in one structured file.
No complicated software. No reporting chaos. Just clarity, control, and operational efficiency.
🚀 Key Feature of Waste Management Dashboard in Excel
📊 5 Fully Interactive Dashboard Pages – Overview, Waste Type, Zone, Collection Team, and Month Analysis.
🚛 Vehicle Monitoring System – Track total vehicles, active status, and breakdown trends.
💰 Operating & Maintenance Cost Tracking – Identify cost spikes instantly.
⭐ Service Rating Analysis – Monitor quality performance by city, zone, and team.
🧩 Dynamic Right-Side Slicers – Filter by Waste Type, Zone, Region, Team, and Month instantly.
🧭 Left-Side Page Navigator – Smooth movement across analytical pages.
📈 Pivot-Based Analytics – Automated calculations with visual insights.
📦 What’s Inside the Waste Management Dashboard in Excel
This structured Excel file includes:
1️⃣ Overview Page – Operational Control Center
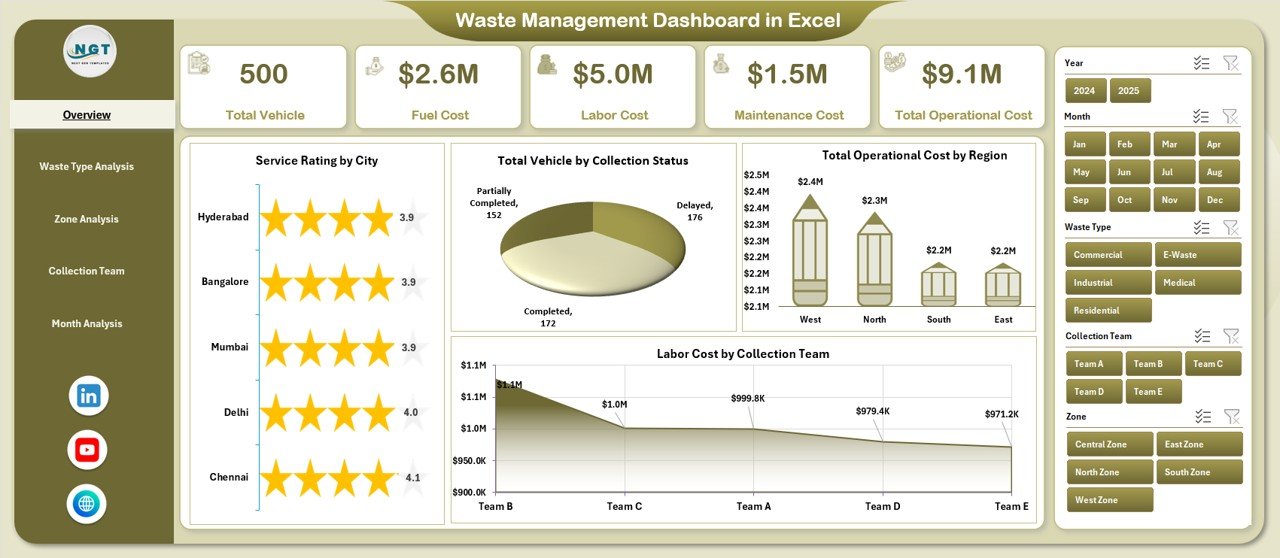
4 KPI Cards:
-
Total Vehicles
-
Total Operating Cost
-
Total Maintenance Cost
-
Average Service Rating
4 Interactive Charts:
-
Service Rating by City
-
Total Vehicles by Collection Status
-
Operating Cost by Region
-
Labor Cost by Collection Team
Instantly see overall operational health and identify problem areas.
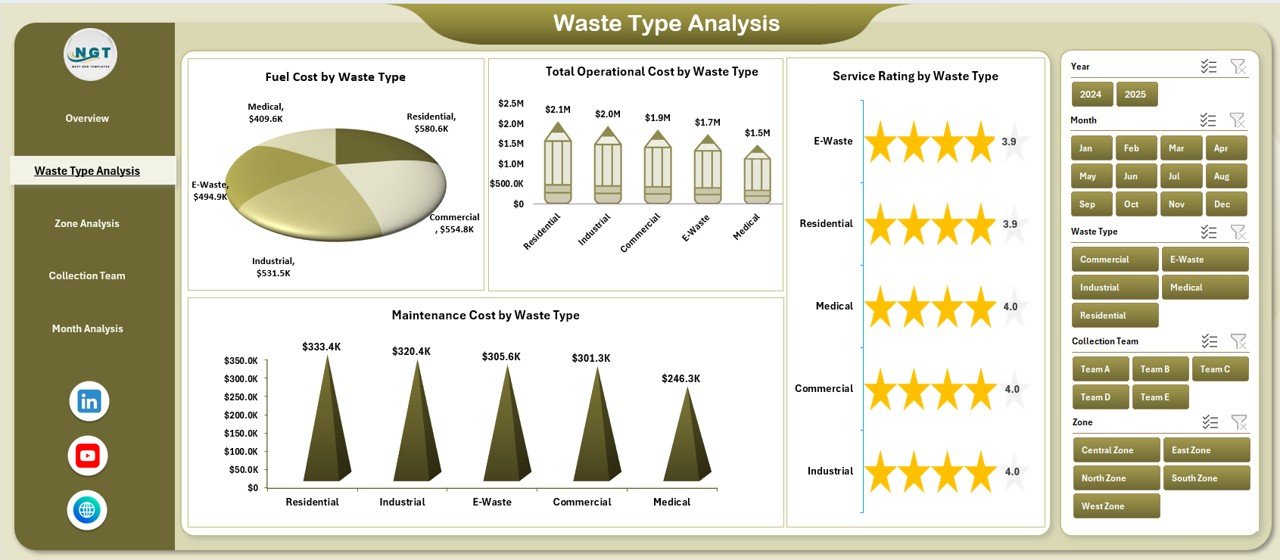
2️⃣ Waste Type Analysis
-
Service Rating by Waste Type
-
Total Vehicles by Waste Type
-
Operating Cost by Waste Type
-
Maintenance Cost by Waste Type
Optimize resource allocation across municipal, industrial, recyclable, and hazardous waste categories.
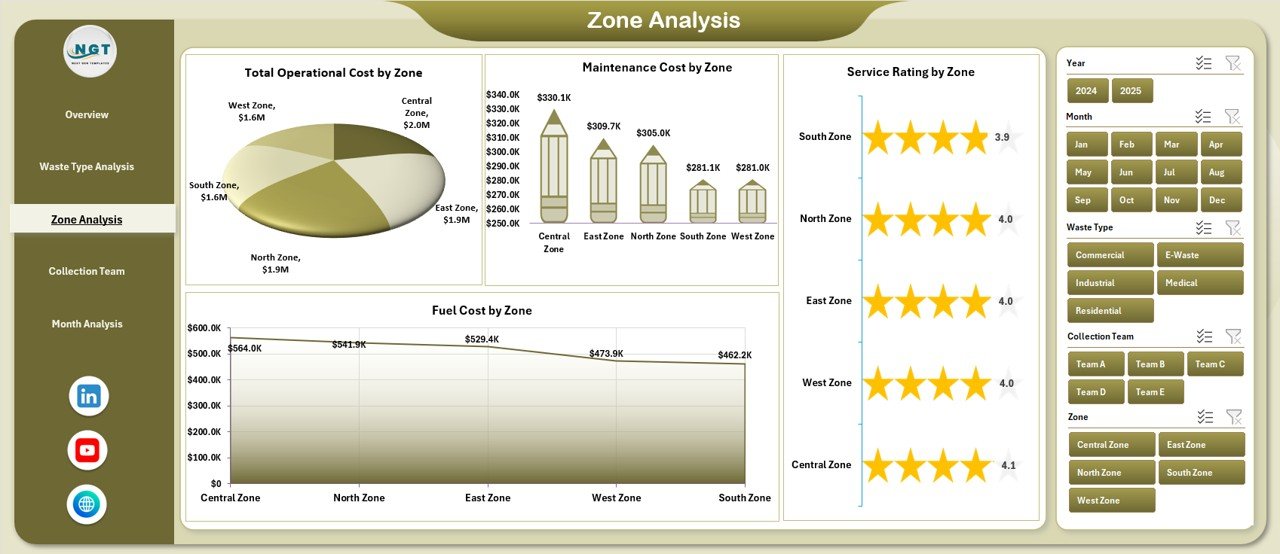
3️⃣ Zone Analysis
-
Service Rating by Zone
-
Total Vehicles by Zone
-
Operating Cost by Zone
-
Maintenance Cost by Zone
Benchmark geographic performance and control region-wise expenses.
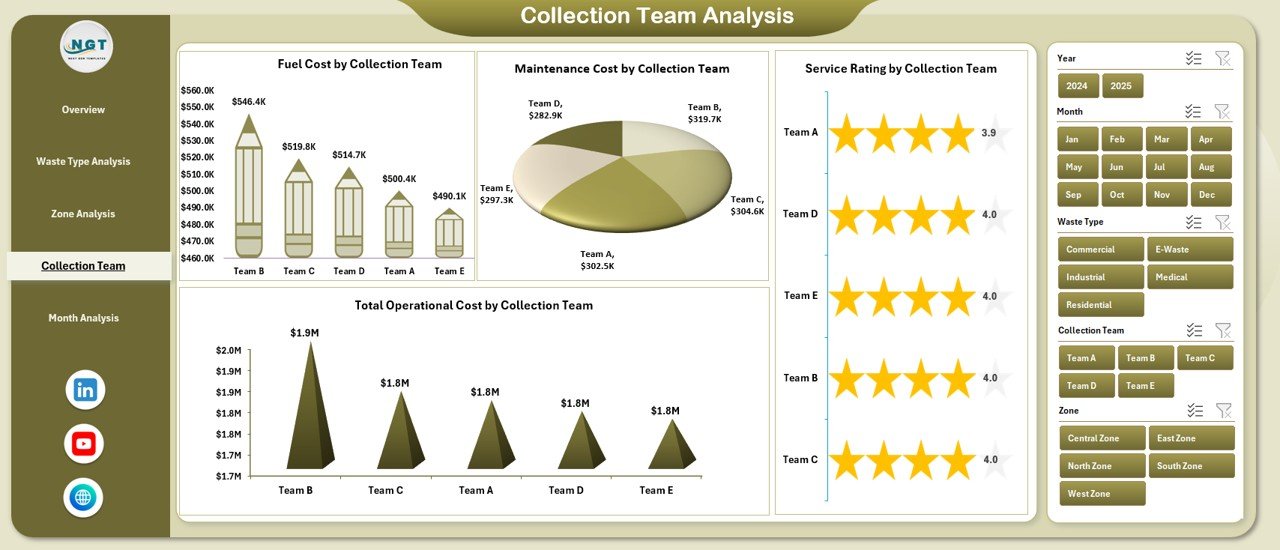
4️⃣ Collection Team Analysis
-
Service Rating by Team
-
Total Vehicles by Team
-
Operating Cost by Team
-
Maintenance Cost by Team
Improve accountability and encourage better team-level performance.
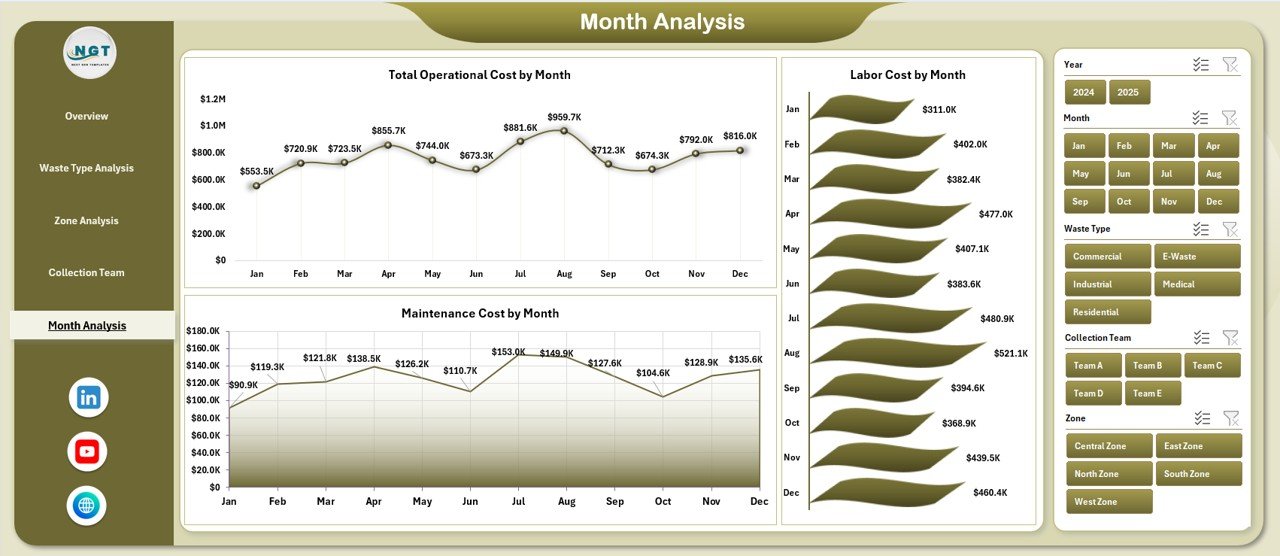
5️⃣ Month Analysis
-
Total Vehicles by Month
-
Operating Cost by Month
-
Maintenance Cost by Month
Detect seasonal cost spikes and improve budget forecasting.
🛠 How to Use the Waste Management Dashboard in Excel
Using the dashboard is simple:
1️⃣ Enter structured data in the Data Sheet (Date, Zone, Waste Type, Vehicle ID, Costs, Service Rating).
2️⃣ Maintain consistent naming conventions.
3️⃣ Click Refresh All to update Pivot Tables.
4️⃣ Use slicers to filter insights instantly.
5️⃣ Review KPI cards and charts for decision-making.
Because the backend support sheet handles calculations automatically, reporting remains clean and efficient.
👥 Who Can Benefit from This Waste Management Dashboard in Excel
✔ Municipal Corporations
✔ Private Waste Contractors
✔ Environmental Service Providers
✔ Facility Management Companies
✔ Industrial Waste Handlers
✔ Operations Managers
✔ Finance & Budget Teams
Whether you manage a small city zone or a large metropolitan waste system, this dashboard provides structured control.
Why This Dashboard Improves Operational Efficiency
Instead of guessing which zone costs more, you see operating expenses clearly.
Instead of reacting to vehicle breakdowns late, you monitor maintenance trends proactively.
Instead of struggling with service complaints, you track rating performance consistently.
From vehicle deployment to labor cost and regional efficiency — every operational metric becomes measurable.
If you want better cost control, improved accountability, and smarter planning, this dashboard becomes your operational advantage.
Click here to read the Detailed blog post
Visit our YouTube channel to learn step-by-step video tutorials
👉 YouTube Channel – PKAnExcelExpert