
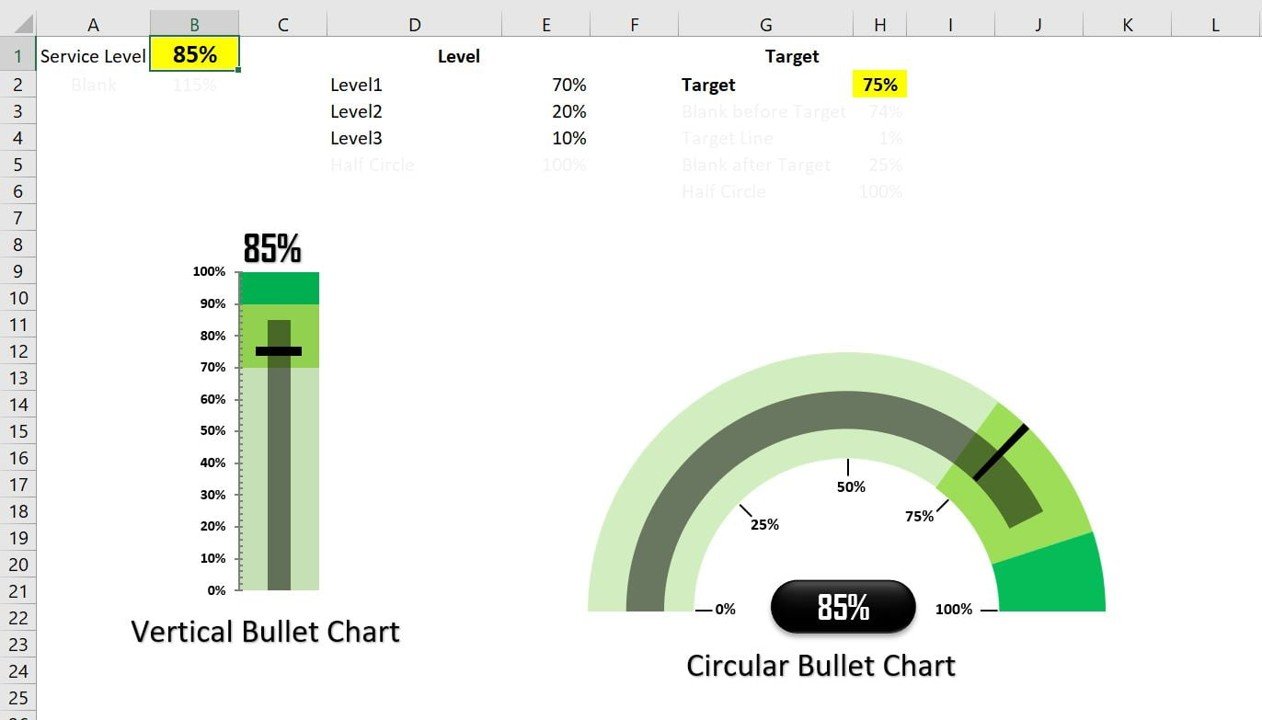
The Vertical and Circular Bullet Chart in Excel is a visually appealing and easy-to-understand tool designed to help you track and analyze key performance indicators (KPIs) in a concise and impactful way. This chart format makes it easy to represent performance metrics, compare them against targets, and clearly visualize progress toward goals. Whether you’re tracking sales performance, project progress, or any other critical KPI, this chart provides a clear, visual way to communicate data.
The Vertical Bullet Chart allows for a linear, straightforward comparison of actual values against target values, making it ideal for situations where a simple, clean comparison is needed. Meanwhile, the Circular Bullet Chart takes it up a notch with a circular design that offers a more dynamic and engaging representation of data. The combination of both chart types gives you the flexibility to choose the style that best suits your presentation needs.
Key Features of the Vertical and Circular Bullet Chart in Excel
📌 Two Visual Formats
Choose between the vertical and circular bullet chart formats to suit your data and presentation style. The vertical bullet chart is great for clear and simple linear comparisons, while the circular chart offers a more engaging, dynamic visual presentation.
🛠 Customizable Data Points
Both chart types allow you to customize data points, target values, and performance markers. Modify the colors, labels, and scale to match your unique data and presentation requirements.
💡 Simple, Intuitive Design
The bullet chart uses a minimalist design, making it easy to interpret data at a glance. Whether you’re presenting to executives, clients, or team members, the charts provide clear insights into performance.
🔢 Real-Time Updates
As you update your data, the bullet charts adjust automatically to reflect the changes in real-time, ensuring your charts are always up-to-date with the latest information.
🚀 Multiple Use Cases
Use the vertical and circular bullet charts for a wide variety of applications, including tracking sales targets, monitoring project milestones, evaluating employee performance, or displaying any other metric that requires a performance comparison.
📊 Visual Comparison
The charts display actual data against target goals, with a visually distinct comparison that makes it easy to see how performance stacks up. This helps you quickly assess performance gaps and identify areas of improvement.
⚙ Easy Setup and Customization
The charts are designed for ease of use. With straightforward setup instructions and customizable data points, you can quickly create professional-looking charts without requiring advanced Excel skills.
🚀 Why You’ll Love the Vertical and Circular Bullet Chart in Excel
✅ Clear Performance Tracking – Compare actual values against targets in an easy-to-read format. ✅ Dual Chart Formats – Choose between a vertical or circular design based on your data and presentation needs. ✅ Real-Time Updates – Automatically adjust the chart as new data is entered. ✅ Customizable and Flexible – Tailor the charts to your specific goals and presentation style. ✅ Easy to Use – Simple setup with no advanced Excel skills required.
📂 What’s Inside the Vertical and Circular Bullet Chart in Excel?
- Vertical Bullet Chart: A clean, linear design that compares actual values against target values.
- Circular Bullet Chart: A more dynamic and visually engaging design for performance tracking.
- Customizable Labels and Data Points: Modify the data, labels, and colors to suit your needs.
- Real-Time Data Updates: The chart updates automatically as data is entered.
- Easy-to-Follow Setup Instructions: Clear steps to customize and implement the charts quickly.
🔍 How to Use the Vertical and Circular Bullet Chart in Excel
1️⃣ Download the Template – Get instant access to the Excel file upon purchase. 2️⃣ Enter Your Data – Input actual values, target values, and performance metrics. 3️⃣ Choose Your Chart Format – Select the vertical or circular bullet chart based on your preference. 4️⃣ Customize the Chart – Modify the labels, colors, and scale to match your presentation style. 5️⃣ Present and Share – Use the charts in meetings, reports, or dashboards to communicate performance visually.
🎯 Who Can Benefit from the Vertical and Circular Bullet Chart in Excel? 🔹 Business Analysts 🔹 Project Managers 🔹 Sales Teams 🔹 Marketing Teams 🔹 HR Managers 🔹 Anyone needing to track and compare performance metrics visually
Track and visualize your KPIs with the Vertical and Circular Bullet Chart in Excel. This versatile and easy-to-use tool helps you present performance data in a clear, impactful, and professional way.
Click here to read the Detailed blog post
https://www.pk-anexcelexpert.com/vertical-and-circular-bullet-chart-in-excel/


Reviews
There are no reviews yet.