Managing vendor performance is no longer optional—it is a strategic necessity. Vendors directly influence cost control, quality standards, delivery timelines, compliance, and overall customer satisfaction. Vendor Management KPI Dashboard in Power BI However, many organizations still rely on scattered spreadsheets, manual tracking, and delayed reports. As a result, vendor issues stay hidden until they become costly problems.
The Vendor Management KPI Dashboard in Power BI solves this challenge by transforming raw vendor data into clear, interactive, and actionable insights. Vendor Management KPI Dashboard in Power BI This ready-to-use dashboard gives procurement teams, supply-chain leaders, and finance managers a centralized view of vendor performance—updated in real time and backed by structured Excel inputs.
With this dashboard, you no longer chase reports. Instead, you monitor vendor KPIs confidently, detect risks early, compare targets vs actuals, and make data-driven vendor decisions that strengthen long-term partnerships and business performance.
🚀 Key Features of the Vendor Management KPI Dashboard in Power BI
📊 Centralized Vendor KPI Monitoring – Track all vendor performance metrics in one interactive dashboard
✅ MTD & YTD Performance Tracking – Measure monthly and year-to-date vendor performance easily
🎯 Target Achievement Indicators – Instantly identify KPIs meeting or missing targets with visual icons
📅 Dynamic Slicers – Analyze vendor KPIs by month and KPI group
📈 Trend Analysis Charts – Compare current year, previous year, and targets visually
🔍 Drill-Through KPI Definitions – View definitions, formulas, and logic with one click
📁 Excel-Driven Data Model – Simple Excel sheets for actuals, targets, and KPI setup
🧭 User-Friendly Navigation – Smooth dashboard experience with back-button navigation
📦 What’s Inside the Vendor Management KPI Dashboard
This Power BI dashboard is built using three powerful analytical pages, each designed to answer important vendor management questions:
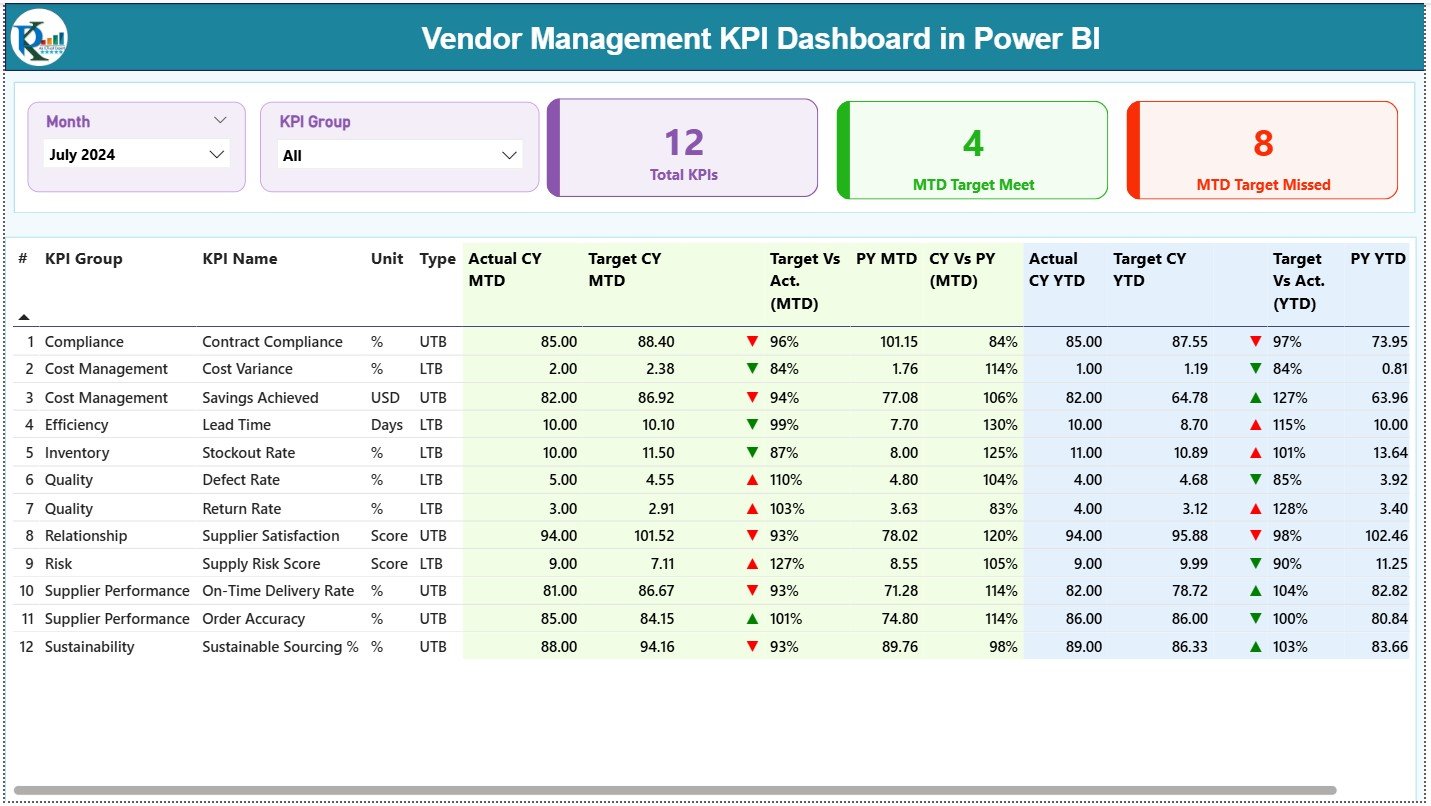
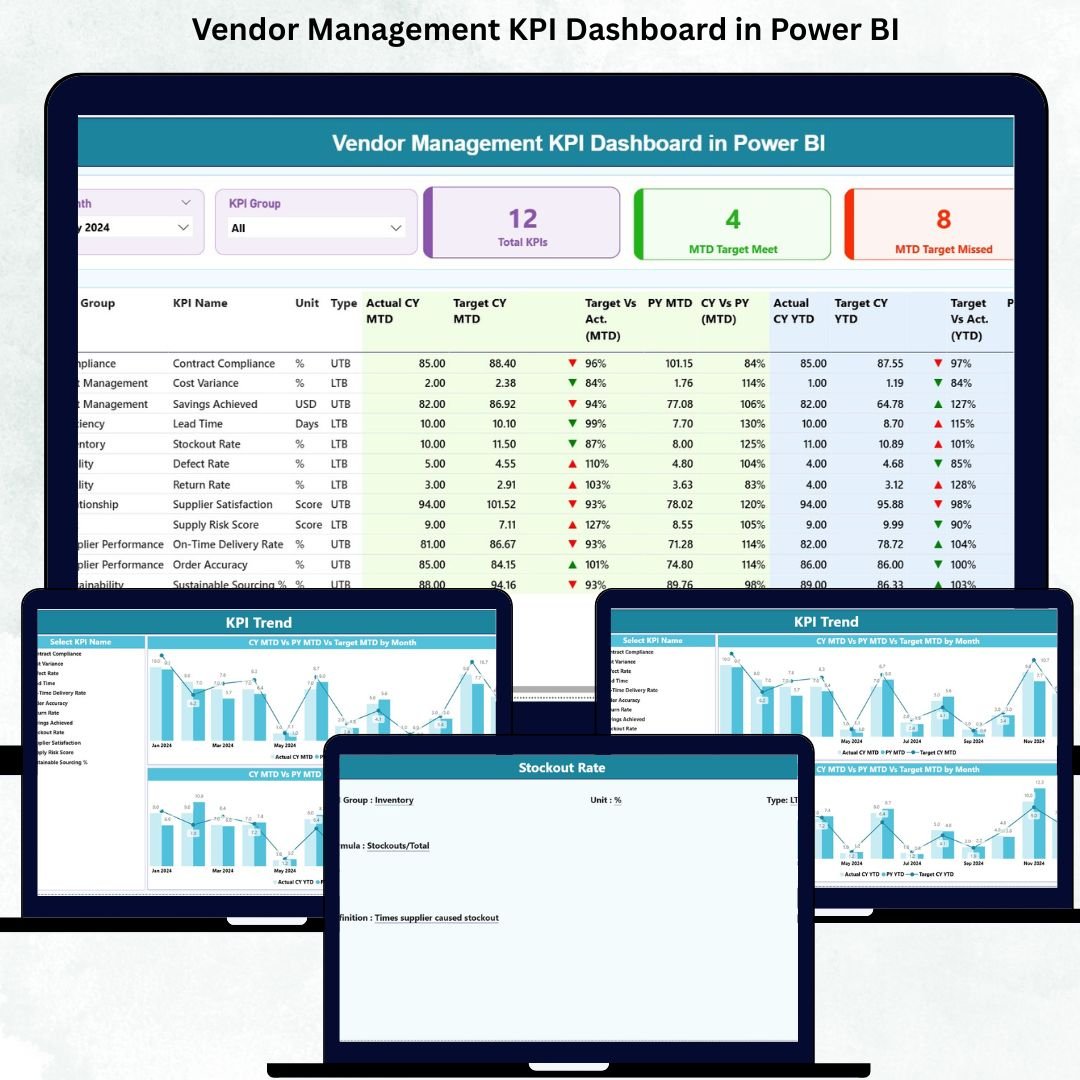
🟢 Summary Page
Acts as the command center for vendor performance. It displays KPI cards for Total KPIs, MTD Targets Met, and MTD Targets Missed. A detailed KPI table shows MTD and YTD actuals, targets, previous-year values, and performance ratios—giving instant visibility into vendor health.
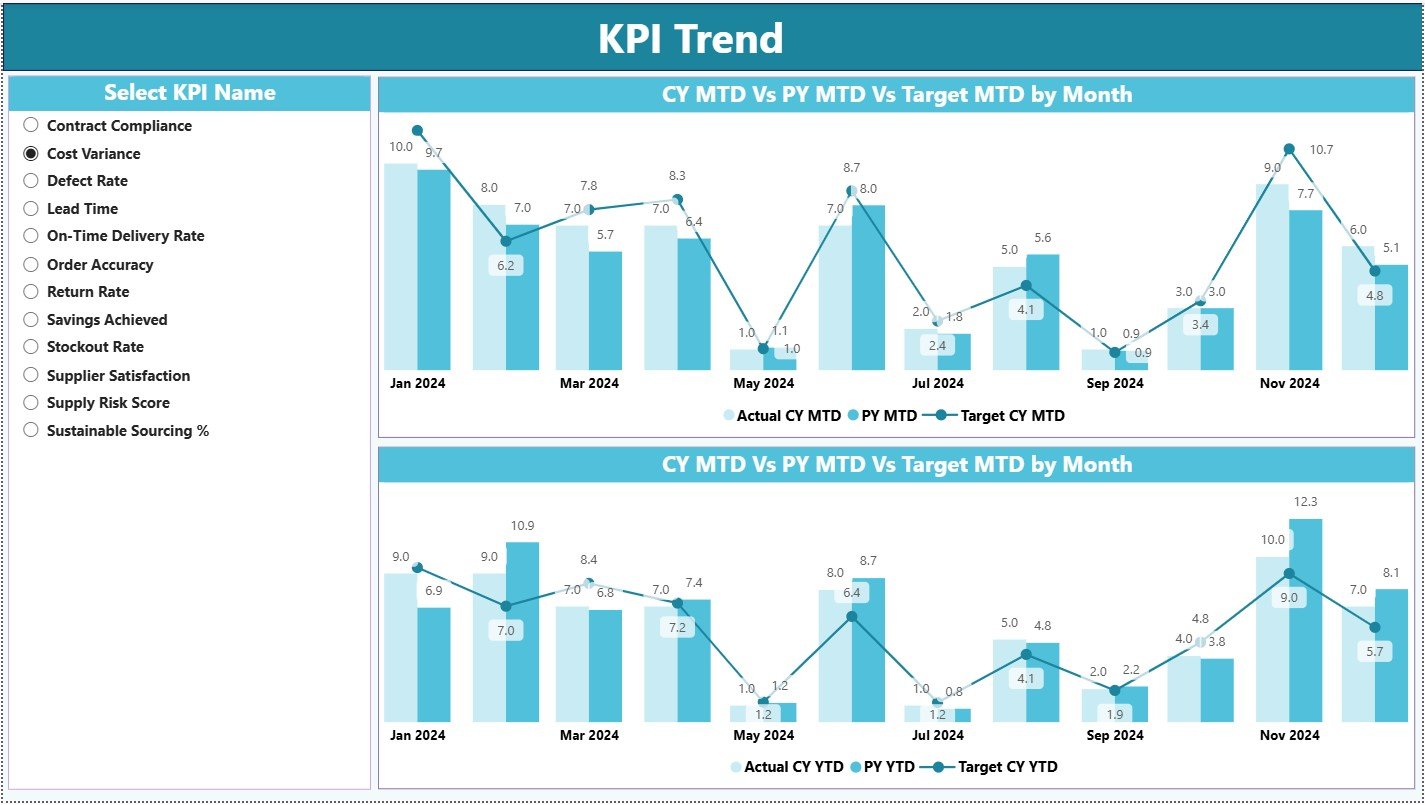
📉 KPI Trend Page
Designed for time-based analysis. Select any vendor KPI and instantly view MTD and YTD trend charts comparing targets, current year, and previous year results. This helps detect patterns, monitor improvements, and identify early risk signals.
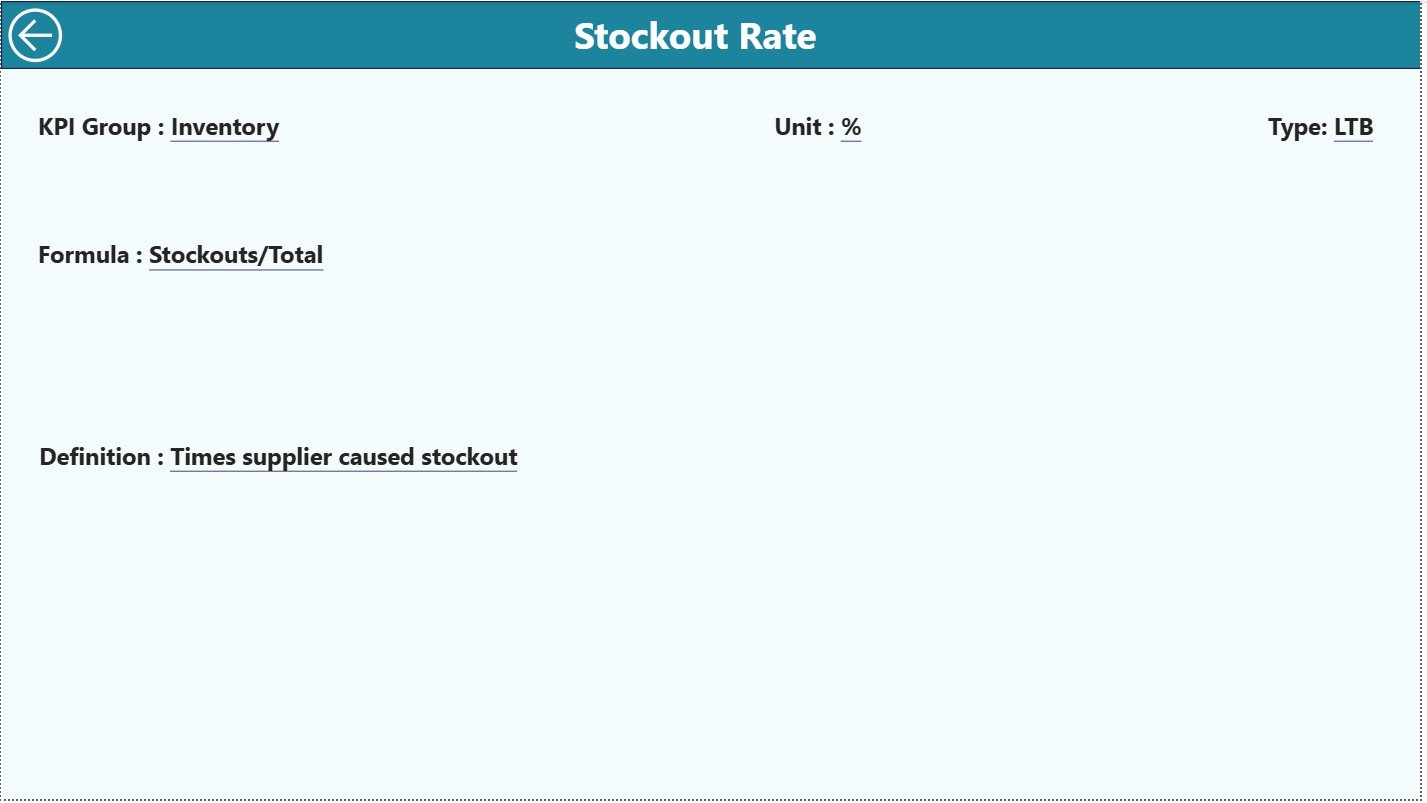
📘 KPI Definition Page
A drill-through page that ensures transparency and consistency. It displays KPI formulas, definitions, units, and performance logic so every stakeholder understands the metrics clearly.
The dashboard is powered by three structured Excel sheets:
-
Input Actual – Vendor MTD and YTD actual performance
-
Input Target – Defined vendor performance targets
-
KPI Definition – KPI metadata, grouping, and logic
🛠️ How to Use the Vendor Management KPI Dashboard
✅ Step 1: Enter vendor actual values into the Input Actual Excel sheet
✅ Step 2: Update vendor targets in the Input Target sheet
✅ Step 3: Define or modify KPIs using the KPI Definition sheet
✅ Step 4: Refresh the Power BI dashboard
✅ Step 5: Analyze KPIs using slicers, cards, tables, and trend charts
No advanced Power BI expertise is required. The dashboard is fully plug-and-play.
👥 Who Can Benefit from This Vendor Management Dashboard?
🎯 Vendor Managers
📊 Procurement Teams
🚚 Supply Chain Professionals
💰 Finance & Cost Controllers
🏭 Operations Leaders
📉 Business & Performance Analysts
Any organization aiming for proactive, data-driven vendor management will benefit from this solution.
🔗 Click here to read the Detailed blog post
🎥 Visit our YouTube channel to learn step-by-step video tutorials


Reviews
There are no reviews yet.