Managing metro infrastructure projects is not easy. Urban transportation systems are expanding rapidly, and millions of passengers depend on efficient metro services every day. Because metro development involves construction progress, operational efficiency, passenger management, safety monitoring, and budget control, transportation authorities must monitor multiple performance indicators at the same time.
However, many metro authorities still depend on manual spreadsheets and disconnected reports. As a result, managers struggle to monitor performance trends, track project progress, and identify operational issues quickly.
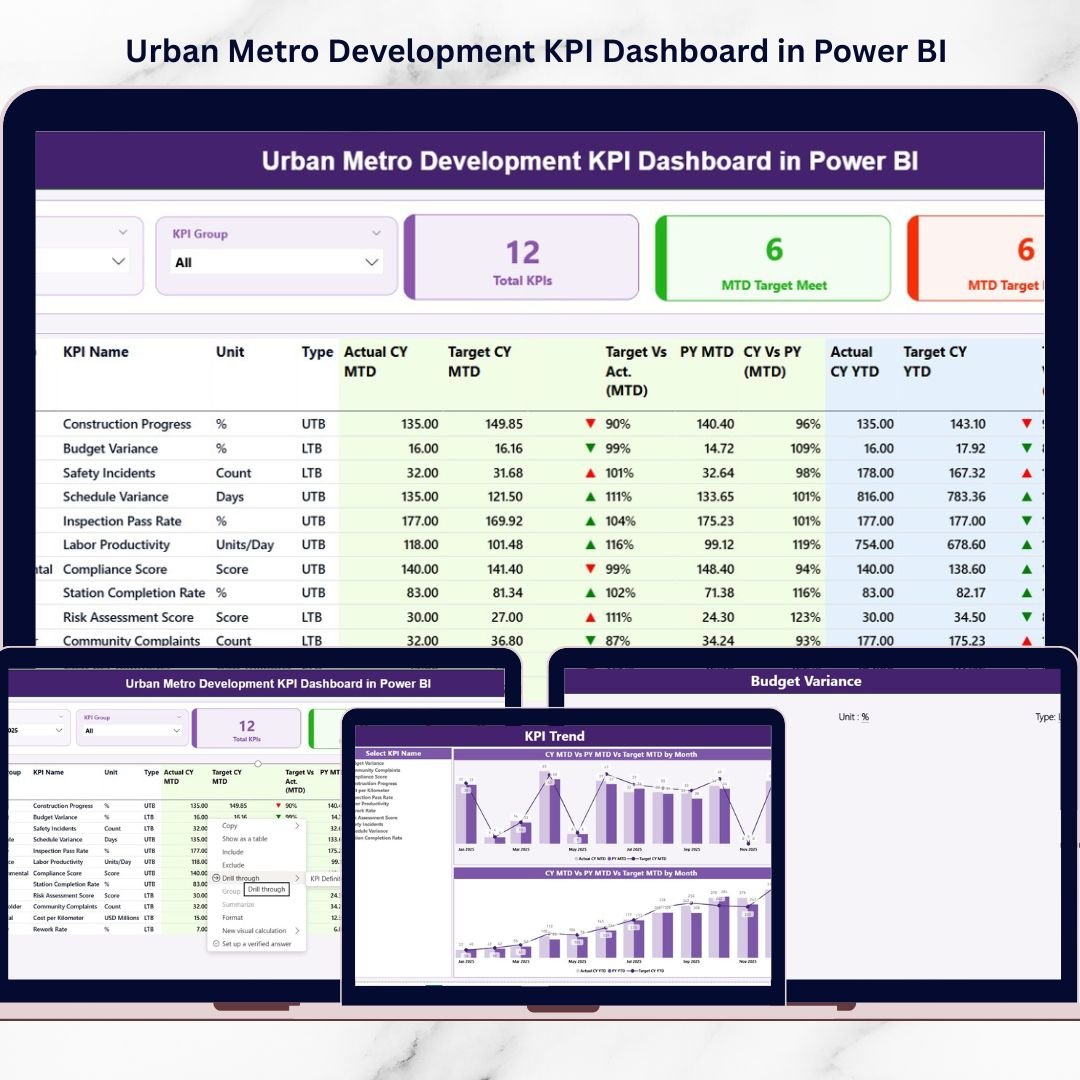
This is where the Urban Metro Development KPI Dashboard in Power BI becomes extremely valuable.
The Urban Metro Development KPI Dashboard in Power BI is a powerful analytics tool designed to help metro authorities monitor key performance indicators related to metro infrastructure development and operations. Because the dashboard uses interactive Power BI visuals connected with Excel data sources, it transforms raw data into clear and actionable insights.
With this dashboard, metro authorities can easily track KPI performance, analyze project trends, evaluate operational efficiency, and make faster strategic decisions.
🚇 Key Feature of Urban Metro Development KPI Dashboard in Power BI
The dashboard is designed to provide a centralized analytics system for metro development performance monitoring.
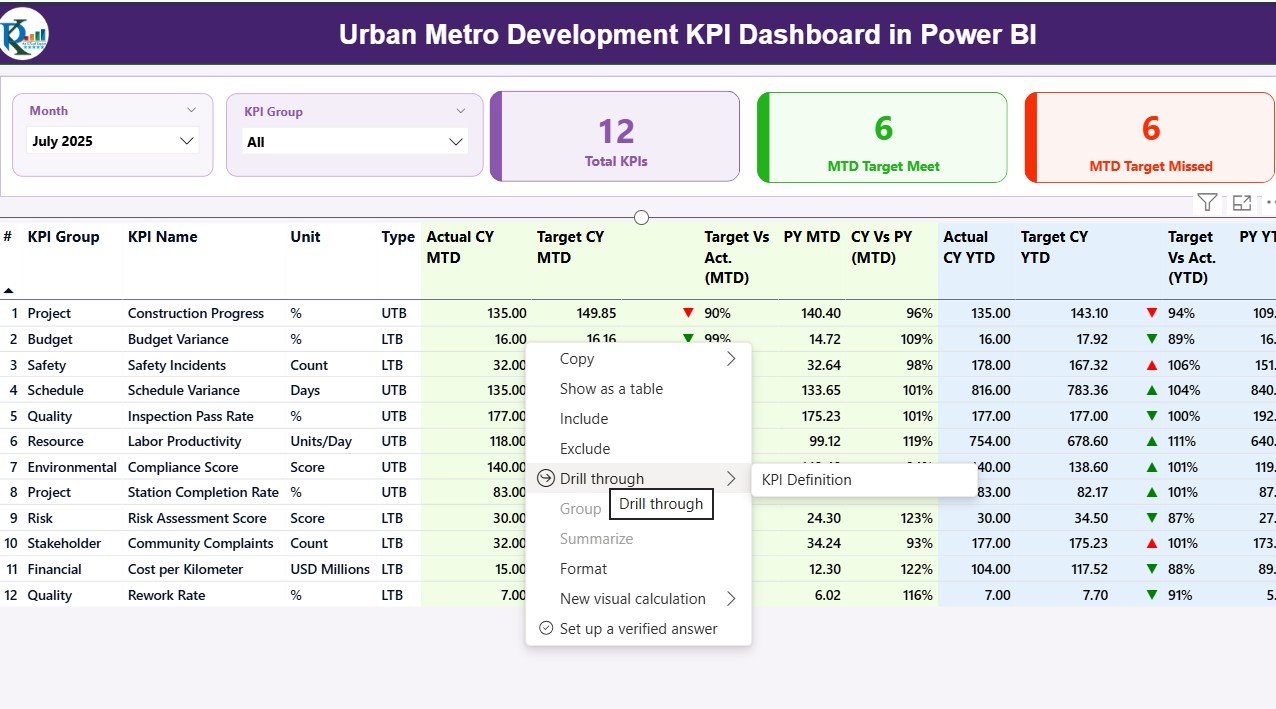
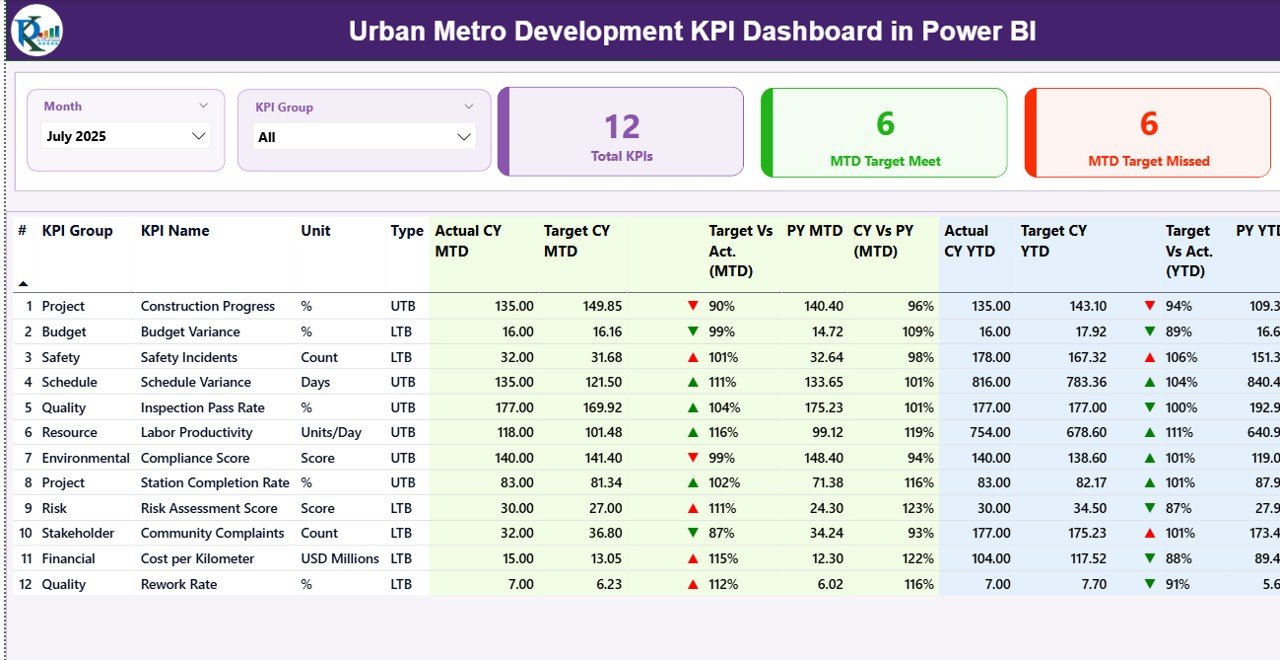
✨ Interactive KPI Summary Dashboard
View all metro KPIs in one place with dynamic filters and performance indicators.
📊 Month and KPI Group Slicers
Analyze performance by selecting specific months or KPI groups instantly.
📈 KPI Performance Cards
Quickly track the total number of KPIs, target achievements, and missed targets.
📉 MTD and YTD Performance Tracking
Monitor both Month-to-Date and Year-to-Date performance metrics.
🎯 Target vs Actual Performance Indicators
Instantly compare KPI performance with targets using automated calculations.
🔺 Visual Performance Indicators
Green ▲ and Red ▼ icons highlight whether KPIs achieved or missed targets.
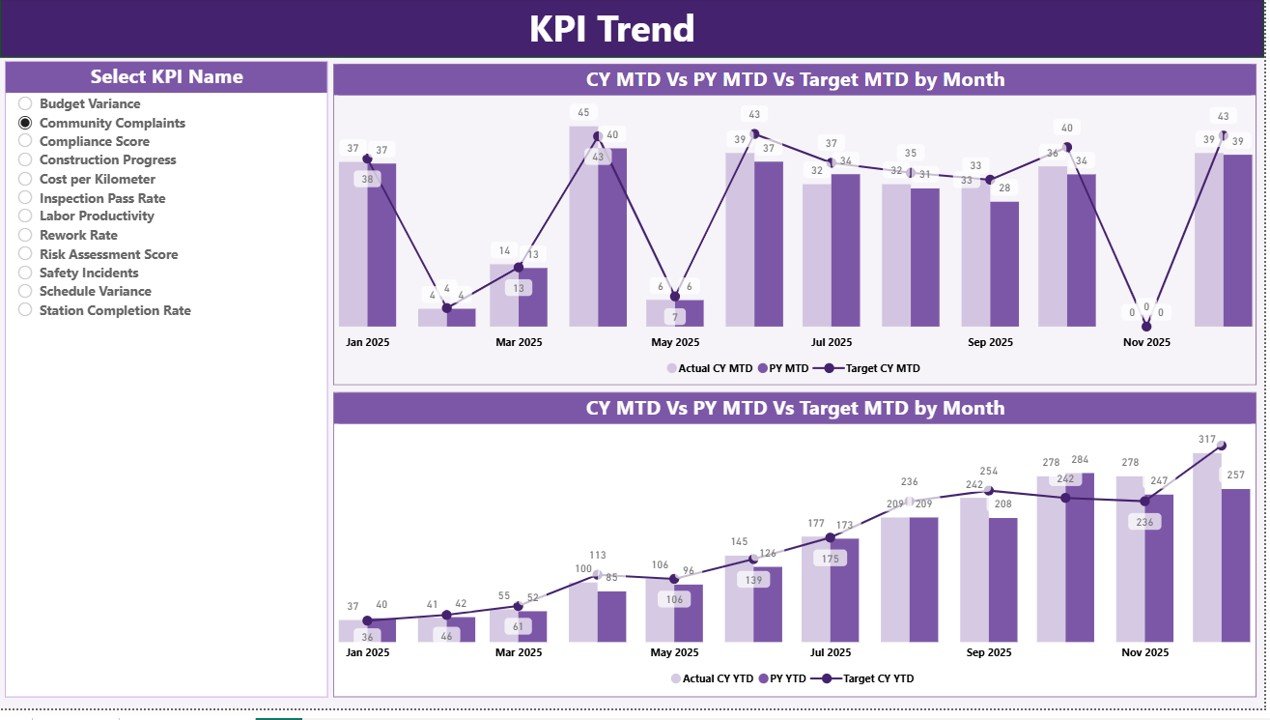
📊 Trend Analysis Page
Analyze KPI trends across months with combo charts showing Actual, Target, and Previous Year values.
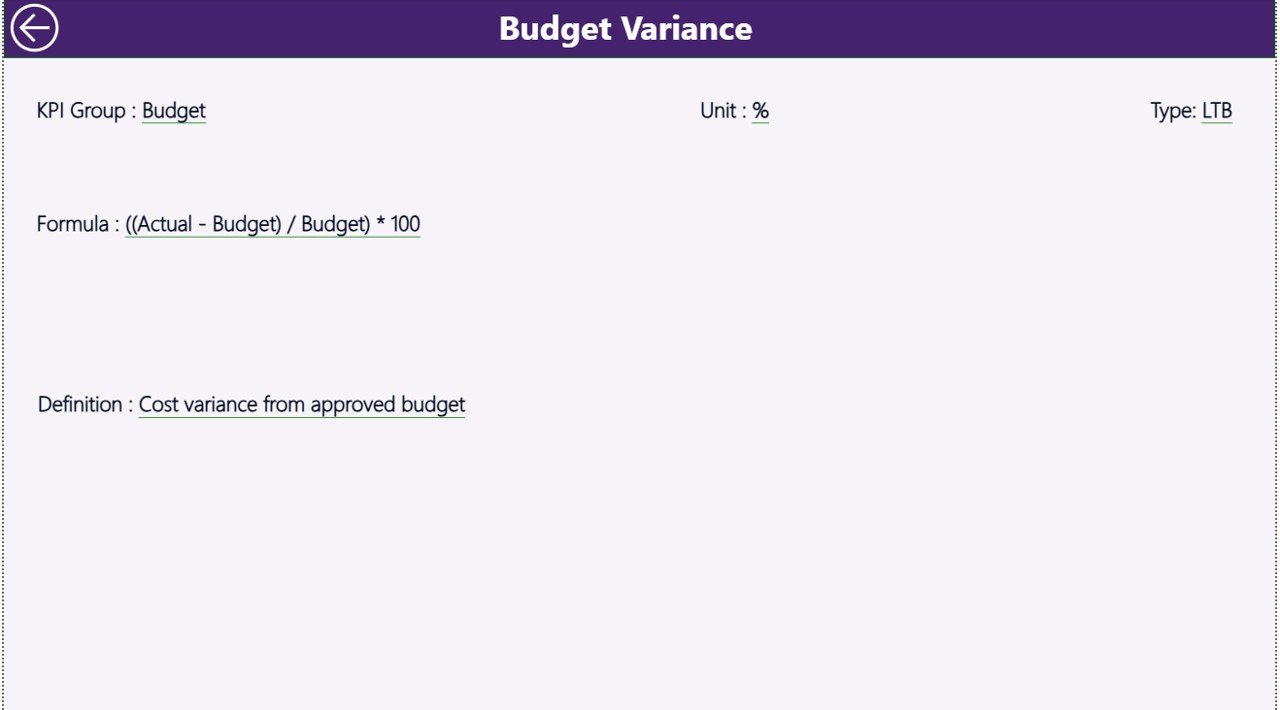
📄 Drill-Through KPI Definition Page
Access detailed KPI definitions, formulas, and categories using drill-through functionality.
⚡ Excel Data Integration
The dashboard connects directly with Excel data files for easy updates and management.
📦 What’s Inside the Urban Metro Development KPI Dashboard in Power BI
This ready-to-use Power BI solution includes multiple analytical components designed for metro infrastructure monitoring.
✔ Power BI Dashboard File (.PBIX)
Fully designed interactive dashboard ready for analysis.
✔ Summary Performance Page
Displays KPI cards, KPI table, and performance indicators.
✔ KPI Trend Analysis Page
Shows MTD and YTD performance trends using combo charts.
✔ KPI Definition Page
Provides detailed information about KPI formulas and categories.
✔ Excel Data Source File
The dashboard connects to Excel sheets for easy data management.
The Excel file contains three worksheets:
📊 Input_Actual Sheet – Stores actual KPI performance values.
🎯 Input_Target Sheet – Contains target KPI values for comparison.
📄 KPI Definition Sheet – Stores KPI descriptions, units, formulas, and types.
Because the dashboard uses structured data input, users can update data easily and refresh Power BI reports instantly.
⚙️ How to Use the Urban Metro Development KPI Dashboard in Power BI
Using the dashboard is very simple and requires minimal technical knowledge.
Step 1 – Enter KPI Data in Excel
Input actual KPI values, target values, and KPI definitions in the Excel data sheets.
Step 2 – Connect Excel with Power BI
The Power BI dashboard reads the Excel file as its data source.
Step 3 – Refresh the Dashboard
After updating the Excel file, simply refresh Power BI to update all reports.
Step 4 – Use Filters and Slicers
Select months or KPI groups to analyze performance dynamically.
Step 5 – Analyze KPI Trends and Performance
Review KPI performance cards, tables, and trend charts to identify progress or issues.
Because the dashboard uses automated calculations and visual analytics, it simplifies metro performance monitoring significantly.
👥 Who Can Benefit from This Urban Metro Development KPI Dashboard in Power BI
This dashboard is ideal for organizations responsible for metro infrastructure development and transportation management.
🚇 Metro Rail Corporations
🏙 Urban Transportation Authorities
🏗 Infrastructure Development Agencies
🏛 Government Transport Departments
🌆 Smart City Development Authorities
📊 Infrastructure Consultants and Project Managers
These organizations can use the dashboard to monitor project progress, analyze operational performance, and improve decision-making.
Because the dashboard centralizes all KPI information in one place, it improves transparency, efficiency, and strategic planning.
Click here to read the Detailed blog post
Watch the step-by-step video tutorial: