
Urban development is the cornerstone of sustainable city growth. From housing projects to transportation, sanitation, and infrastructure, every aspect of urban management needs precise tracking and timely evaluation. The Urban Development KPI Dashboard in Google Sheets provides a powerful, ready-to-use solution that simplifies this process — transforming complex datasets into meaningful, actionable visuals.
Built entirely in Google Sheets, this dashboard is ideal for city planners, government officials, and urban infrastructure teams who want to measure progress across various urban projects — all in one place. It tracks Month-to-Date (MTD) and Year-to-Date (YTD) KPIs, compares them with targets and previous year data, and provides automatic visual indicators for instant decision-making.
📘 What Is an Urban Development KPI Dashboard in Google Sheets?
An Urban Development KPI Dashboard is a data visualization tool that tracks multiple city-level metrics — from construction progress to energy efficiency and environmental performance.
It helps users:
✅ Monitor performance of ongoing and completed urban projects.
✅ Compare Actual vs Target vs Previous Year performance.
✅ Identify underperforming sectors using traffic light indicators.
✅ Track development trends through KPI-based trend charts.
Since it’s Google Sheets-based, it’s fully shareable, cloud-based, and customizable without needing any specialized BI tools.
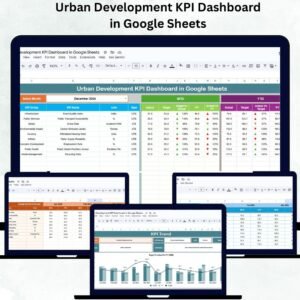
🧭 Dashboard Structure Overview
This dashboard contains six main worksheets, each designed for a specific purpose:
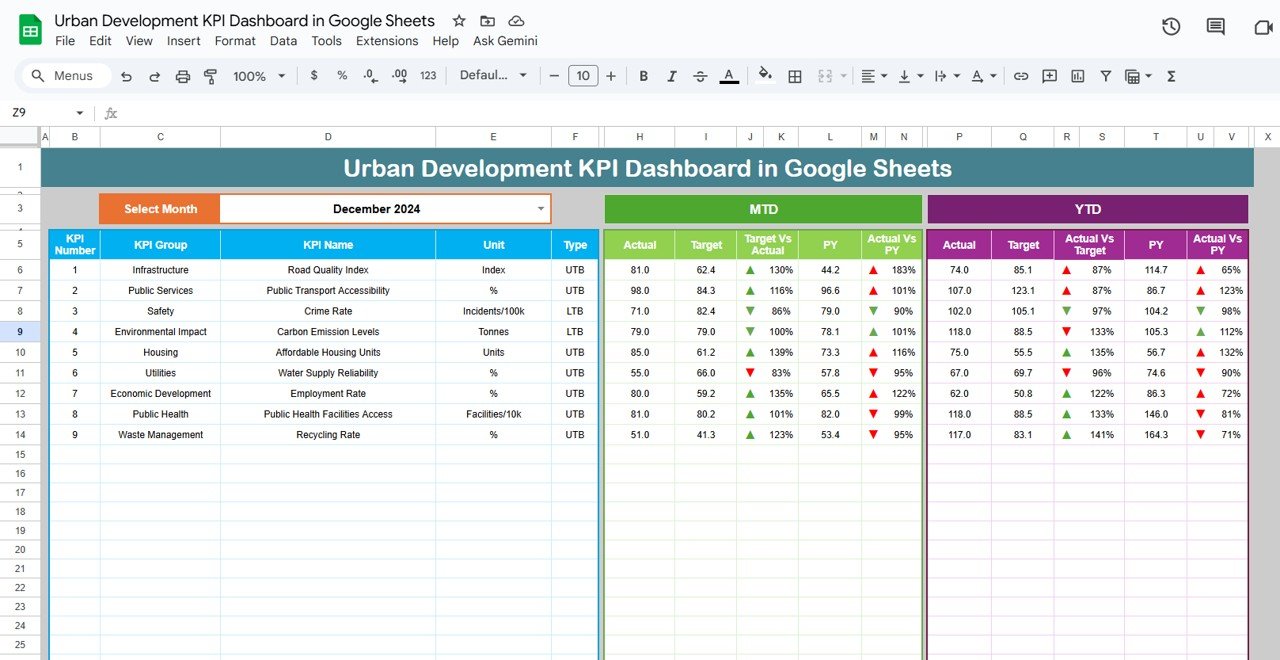
1️⃣ Dashboard Sheet Tab (Main Page)
The Dashboard Sheet is the central hub that visualizes all KPIs.
Key Features:
-
Month Selector (Cell D3): Choose any month to view performance instantly.
-
Displays both MTD and YTD data side by side.
-
Auto-calculates Target vs Actual and PY vs Actual performance.
-
Uses color-coded arrows and lights to show trends and status.
This page serves as a real-time monitoring panel for urban performance across all departments.
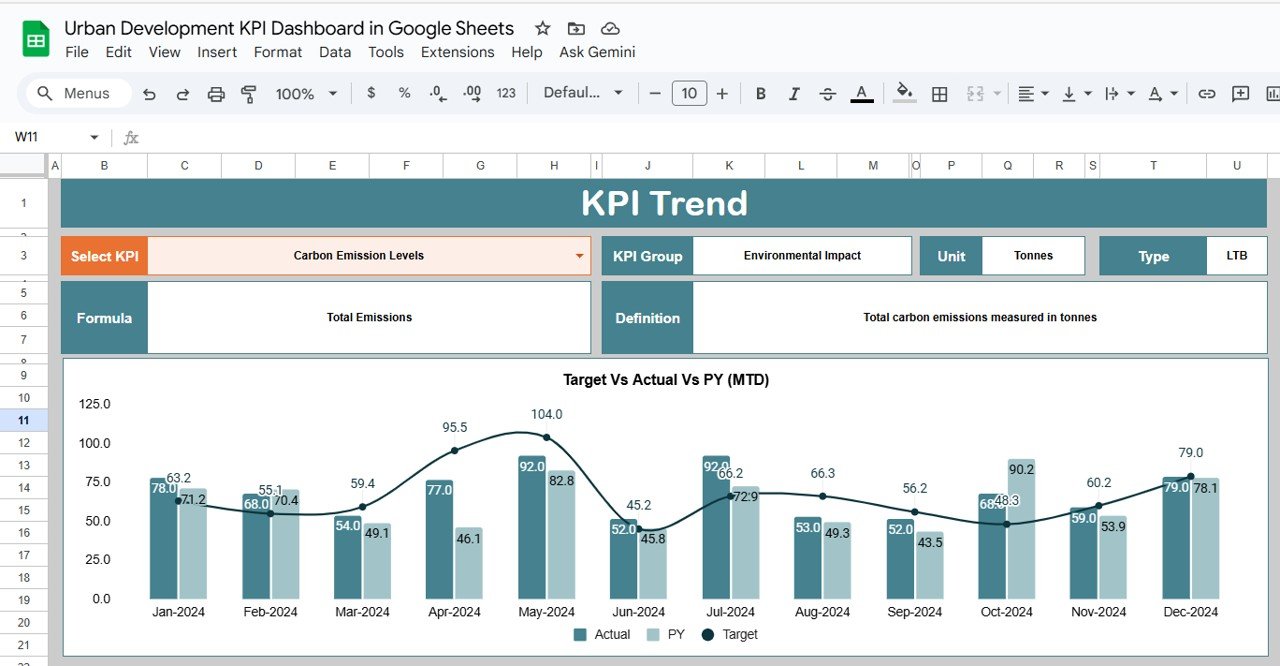
2️⃣ KPI Trend Sheet Tab
The KPI Trend Sheet helps analyze long-term progress for any individual KPI.
Features:
-
Dropdown (Cell C3): Select the KPI name to view its trend.
-
Displays KPI details such as:
-
KPI Group
-
Unit
-
Type (UTB – Upper The Better / LTB – Lower The Better)
-
Formula & Definition
-
-
Includes a monthly trend chart for visual analysis.
This sheet enables urban development teams to forecast growth and assess the effectiveness of policies.
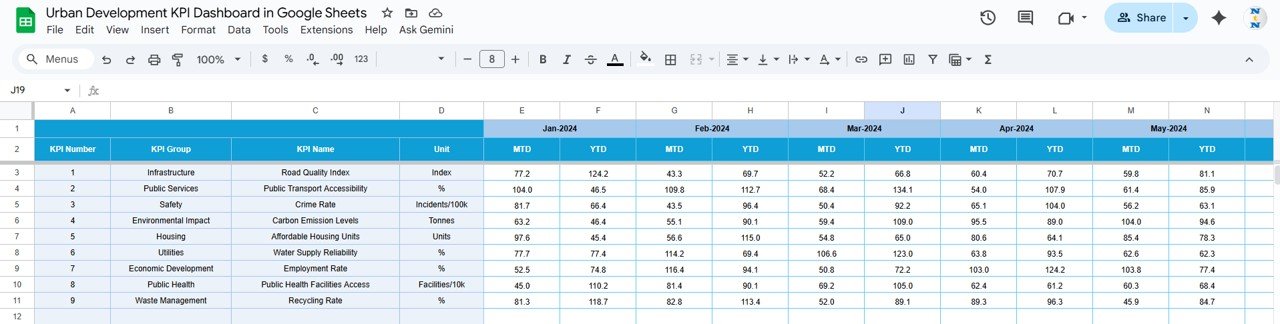
3️⃣ Actual Numbers Sheet Tab
The Actual Sheet contains real monthly data for every KPI.
-
Enter both MTD and YTD Actual values.
-
Month Selector (E1) controls calculations dynamically.
-
Automatically updates charts and dashboards when data is changed.
Perfect for continuous, automated city performance reporting.
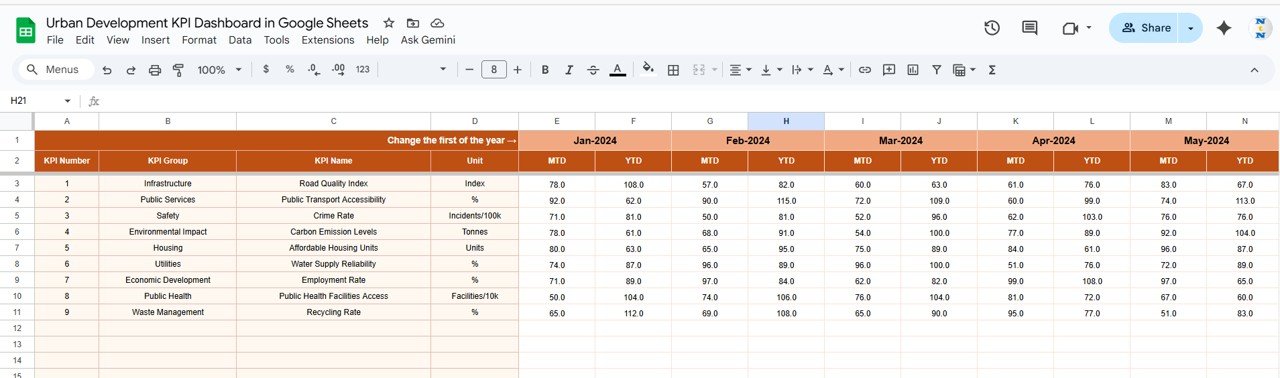
4️⃣ Target Sheet Tab
The Target Sheet defines monthly and yearly performance benchmarks.
-
Input MTD Target and YTD Target for each KPI.
-
The dashboard auto-calculates performance variances for comparison.
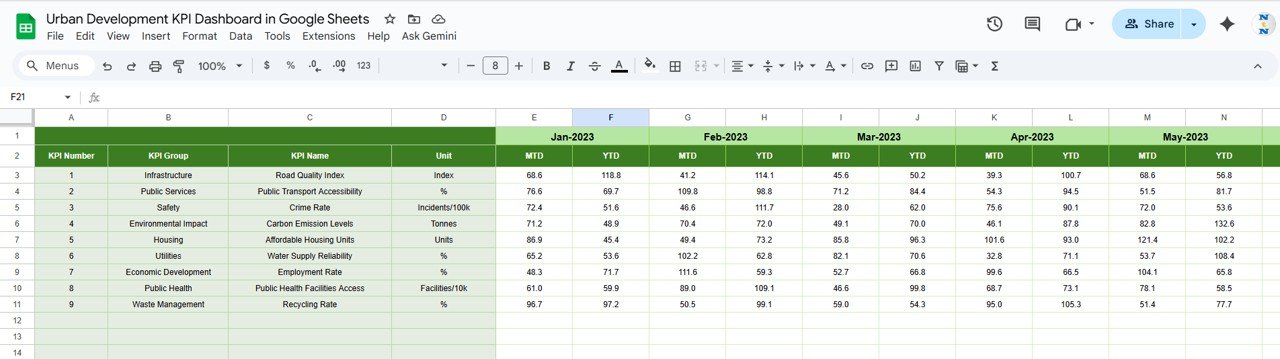
5️⃣ Previous Year Numbers Sheet Tab
This sheet stores last year’s KPI performance data for direct comparison.
-
Enter PY values for both MTD and YTD.
-
Allows YoY growth and trend analysis, helping teams measure long-term improvement.
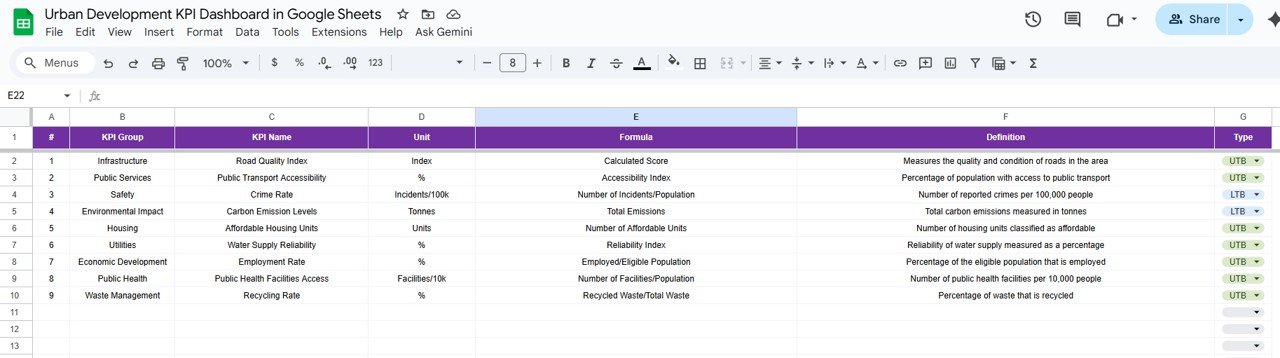
6️⃣ KPI Definition Sheet Tab
This foundational sheet lists all KPIs, ensuring clear understanding across departments.
Columns Include:
S.No. | KPI Group | KPI Name | Unit | Formula | Definition | Type (UTB/LTB)
Sample KPIs may include:
-
Infrastructure Completion Rate (%)
-
Public Transportation Coverage (km)
-
Waste Collection Efficiency (%)
-
Renewable Energy Utilization (%)
-
Affordable Housing Units Delivered (#)
-
Citizen Complaint Resolution Time (days)
🌟 Advantages of the Urban Development KPI Dashboard
-
🏙️ Comprehensive Monitoring: Covers all key urban sectors — infrastructure, energy, housing, waste, and safety.
-
⚡ Real-Time Insights: Dashboard updates automatically when new data is entered.
-
📈 Comparative Analytics: Tracks MTD, YTD, and YoY progress in one view.
-
🌍 Collaborative Environment: Shareable with multiple users in real time.
-
🎯 Goal-Oriented: Helps decision-makers track and meet municipal targets.
-
🧩 Flexible Framework: Add or modify KPIs as new city projects launch.
🚀 Opportunities for Improvement
Enhance the dashboard’s value with the following upgrades:
-
🔄 Automated Data Imports: Connect Google Forms or municipal databases.
-
🗺️ Geospatial Visualization: Integrate Google Maps to show zone-wise performance.
-
📧 Email Alerts: Auto-notify stakeholders when KPIs fall below thresholds.
-
📱 Mobile-Optimized Reporting: Use Google Looker Studio for smartphone dashboards.
-
💬 Citizen Feedback Integration: Combine survey data for public satisfaction insights.
💡 Best Practices for Using the Dashboard
✅ Update Monthly: Keep all tabs synchronized with the latest city data.
✅ Standardize Units: Maintain consistency across departments.
✅ Review KPIs Quarterly: Ensure relevance to ongoing projects.
✅ Train Users: Familiarize team members with definitions and trends.
✅ Audit Data Accuracy: Validate source data before dashboard refresh.
👥 Who Can Use This Dashboard
-
Urban Development Departments – Track infrastructure and municipal KPIs.
-
Government Administrators – Evaluate progress and performance.
-
Smart City Teams – Integrate data across multiple agencies.
-
Private Infrastructure Firms – Manage project deliverables efficiently.
-
Consultants & Analysts – Generate data-backed urban insights.
✅ Conclusion
The Urban Development KPI Dashboard in Google Sheets transforms city data into strategic insight. With automated visuals, month-to-date analysis, and KPI definitions built-in, it’s the ideal solution for efficient, transparent, and sustainable urban governance.
Whether you’re managing smart city projects or public infrastructure, this dashboard ensures that every decision is backed by accurate data — helping cities grow smarter and more sustainable.


Reviews
There are no reviews yet.