Tunnel engineering projects are among the most complex infrastructure developments. They require precise planning, continuous monitoring, strict safety compliance, and accurate performance tracking. Engineers, construction managers, and infrastructure authorities must monitor several key performance indicators to ensure projects remain on schedule, within budget, and aligned with safety standards.
However, managing tunnel engineering data using scattered spreadsheets and disconnected reports often creates confusion. Teams struggle to monitor progress, identify delays, and evaluate performance trends efficiently. As a result, decision-making becomes slow and project risks increase.
To solve this problem, organizations need a centralized system that converts raw operational data into meaningful insights.
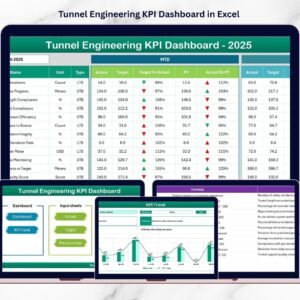
The Tunnel Engineering KPI Dashboard in Excel provides a powerful and structured solution for monitoring tunnel construction performance. This ready-to-use Excel template helps project teams track KPIs, compare targets with actual results, analyze trends, and evaluate project efficiency from a single interactive dashboard.
Instead of reviewing multiple reports, managers can monitor all important indicators in one place, enabling faster and more informed decision-making.
Key Feature of Tunnel Engineering KPI Dashboard in Excel
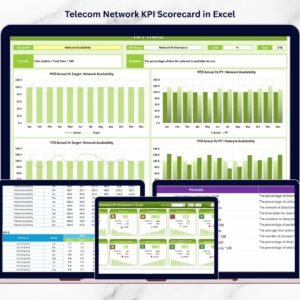
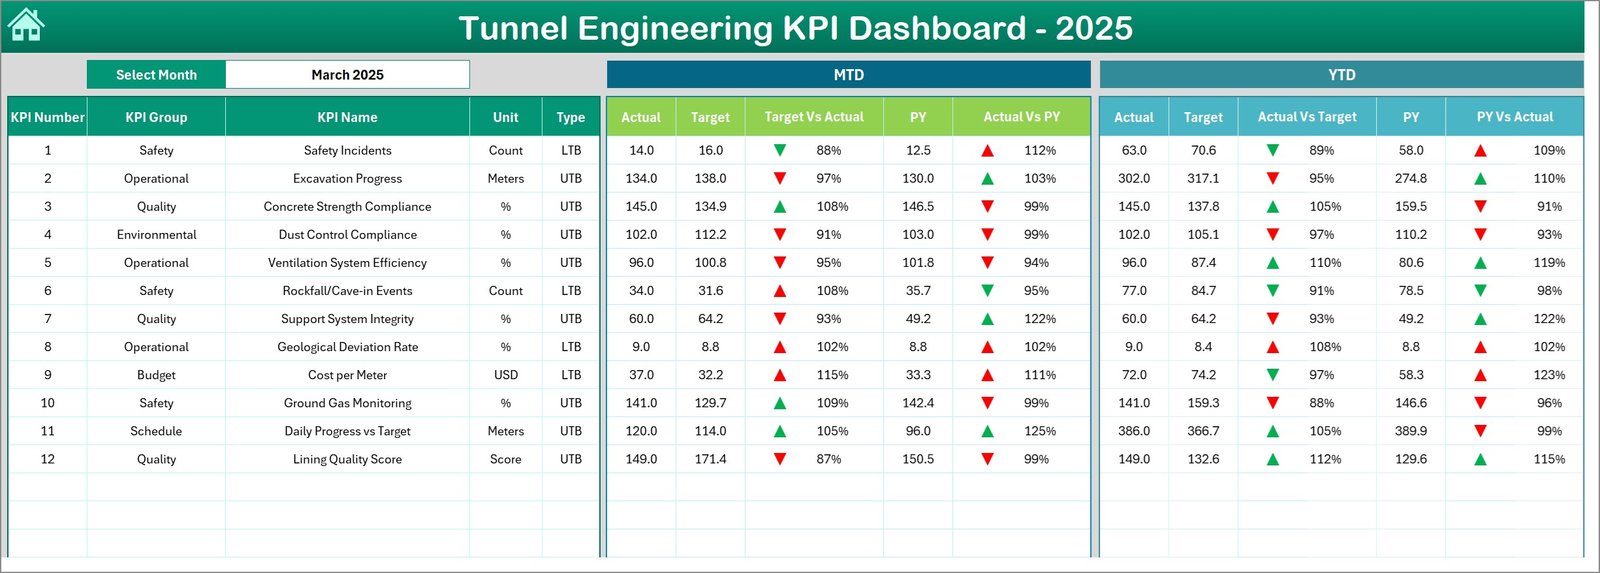
🚧 Interactive KPI Dashboard
Monitor all important tunnel engineering KPIs in a centralized Excel dashboard that updates automatically based on the selected month.
📅 Dynamic Month Selection
Choose the reporting month from a dropdown menu, and the entire dashboard updates instantly with the selected data.
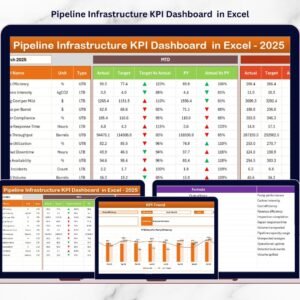
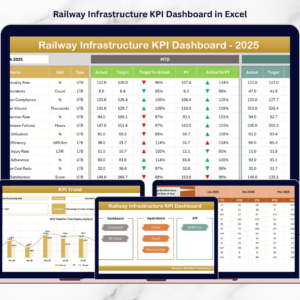
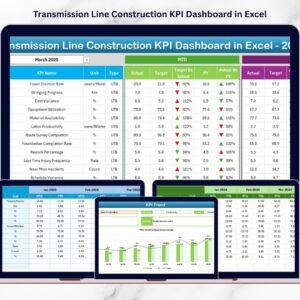
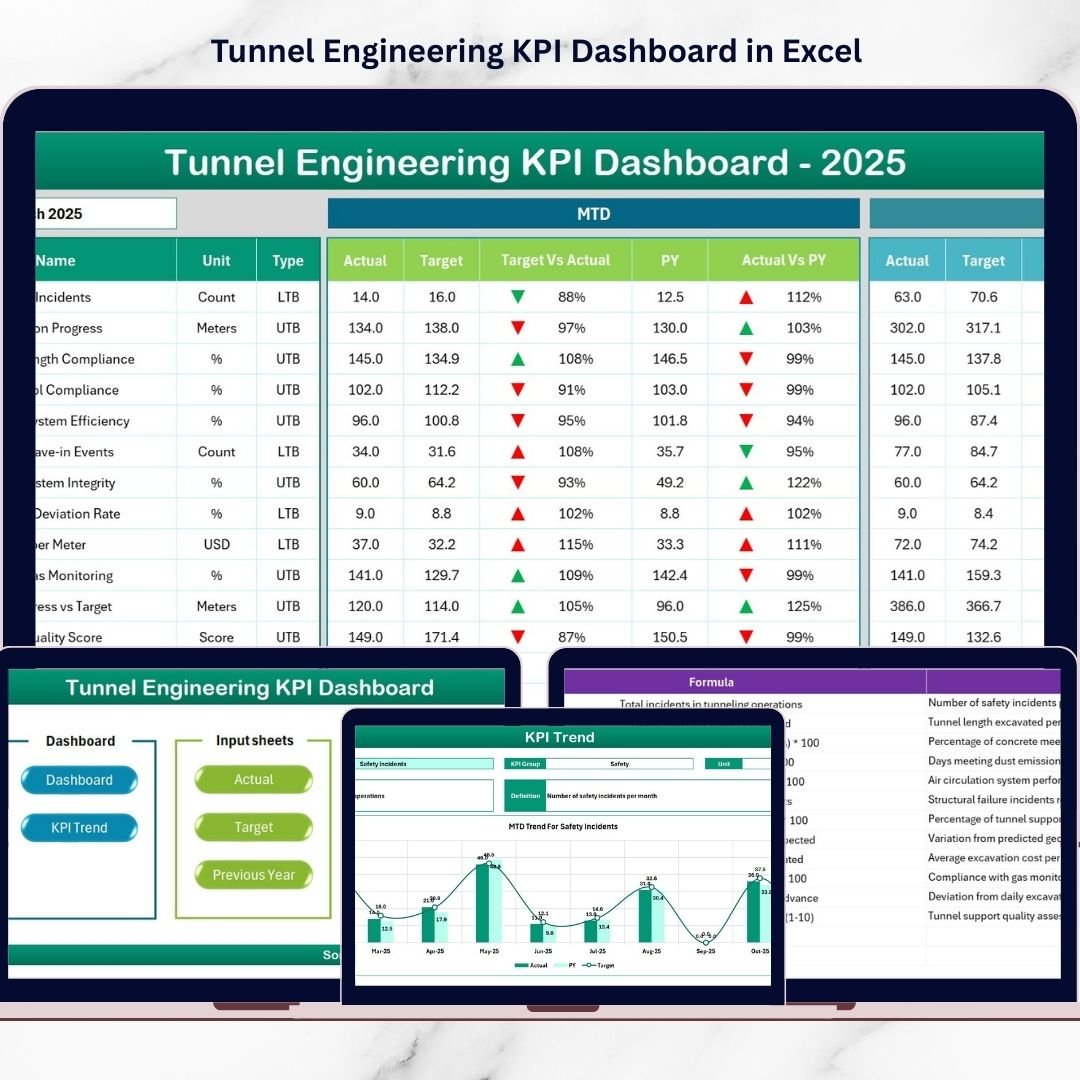
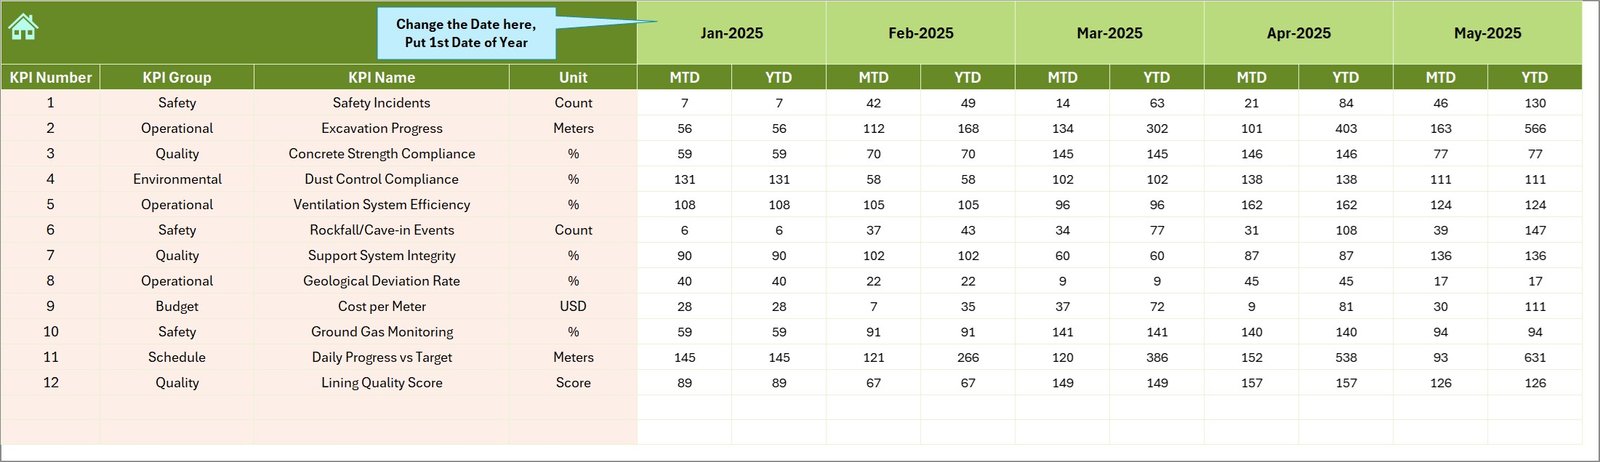
📊 MTD and YTD Performance Analysis
Track Month-To-Date and Year-To-Date performance indicators to understand both short-term and long-term project performance.
🎯 Target vs Actual Comparison
Instantly compare planned targets with actual project performance to identify gaps and improve decision-making.
📉 Previous Year Comparison
Evaluate current performance against previous year data to measure improvement or identify potential issues.
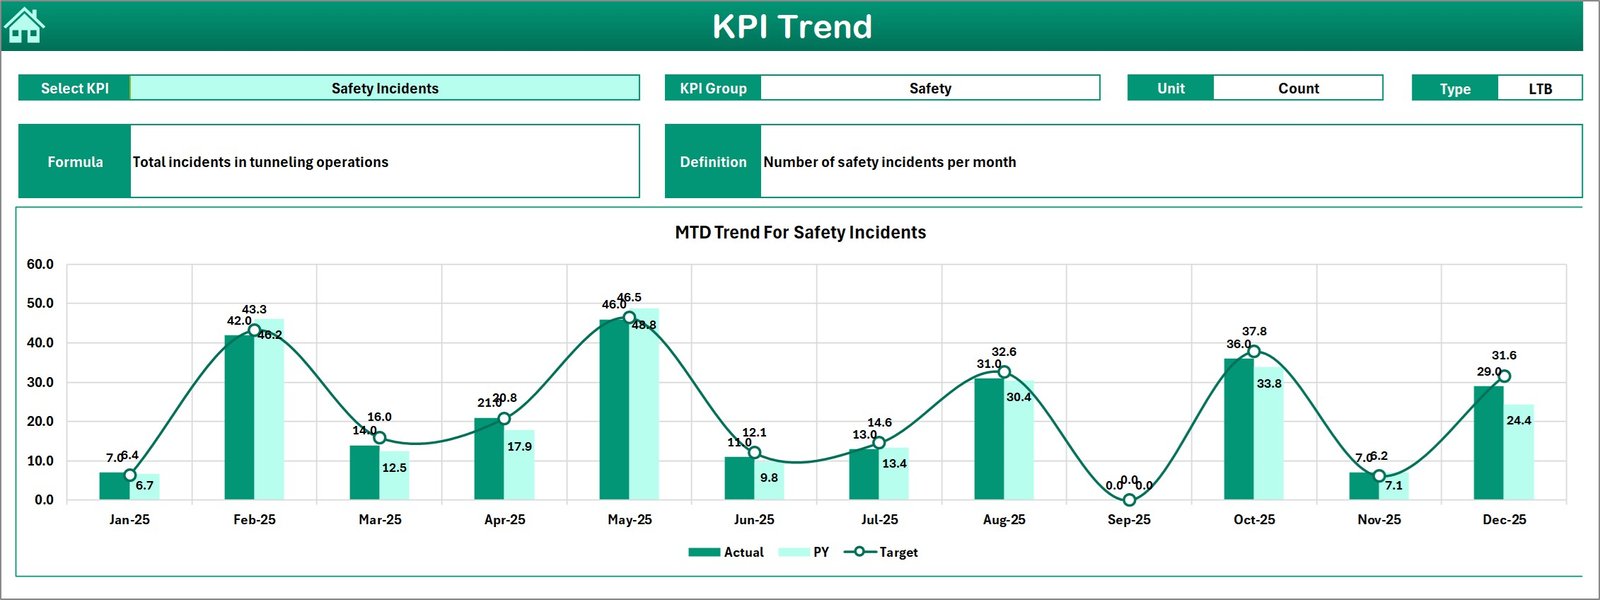
📈 KPI Trend Analysis Charts
Analyze KPI performance trends using dynamic charts that visualize progress across months.
⚠️ Performance Indicators with Conditional Formatting
Up and down arrows highlight KPI performance quickly, allowing managers to identify issues instantly.
🧭 Easy Navigation System
The summary page includes navigation buttons that allow users to jump to different worksheets effortlessly.
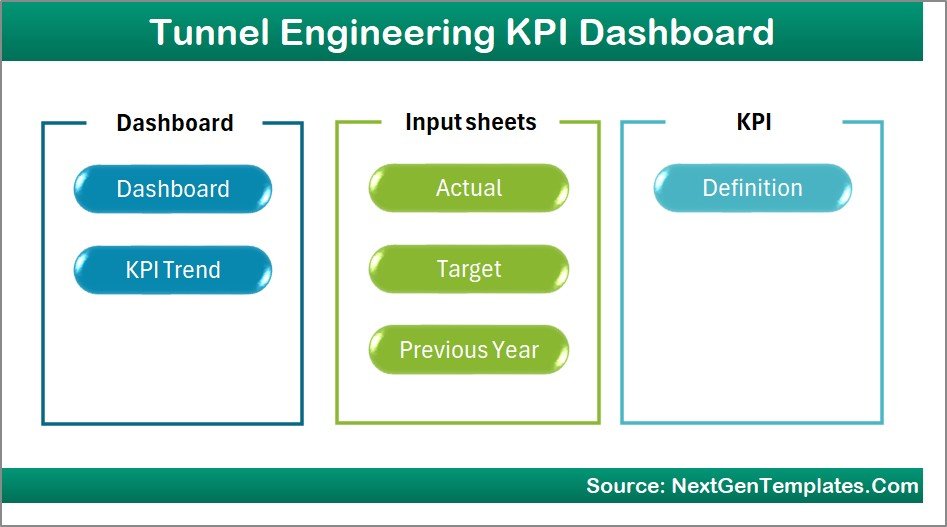
What’s Inside the Tunnel Engineering KPI Dashboard in Excel
📄 7 Structured Excel Worksheets
✔ Summary Page
Acts as the navigation hub of the dashboard with interactive buttons that help users jump to other sheets quickly.
✔ Dashboard Sheet
The main analytical page where users can view all KPIs with MTD and YTD performance comparisons.
✔ Trend Analysis Sheet
Displays KPI trend charts and detailed KPI information such as KPI group, formula, definition, and measurement unit.
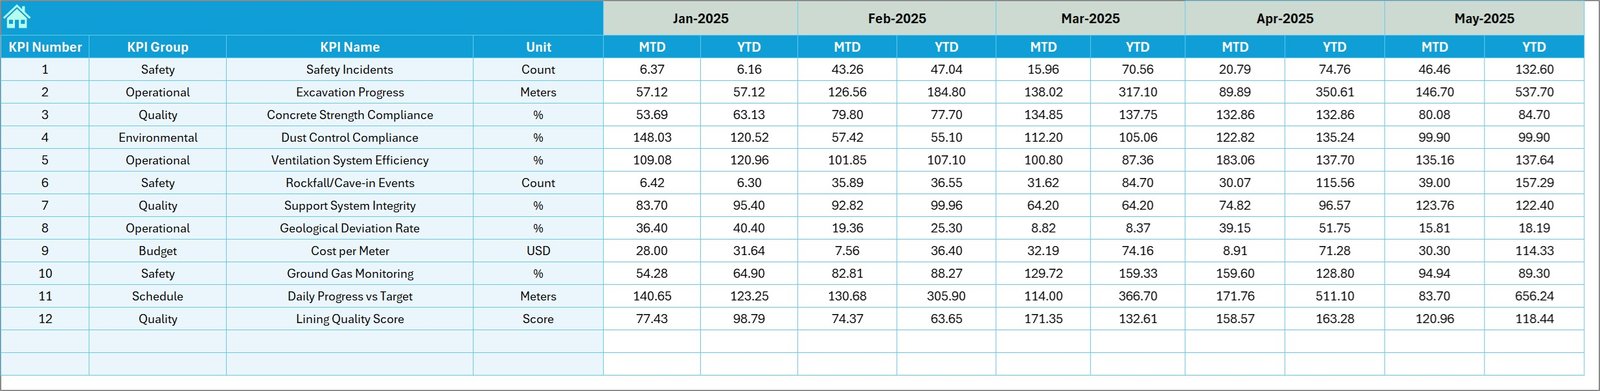
✔ Actual Numbers Input Sheet
Allows users to enter KPI performance data for each month. Once data is entered, the dashboard updates automatically.
✔ Target Sheet
Stores expected KPI performance targets so that the dashboard can compare actual results against planned goals.
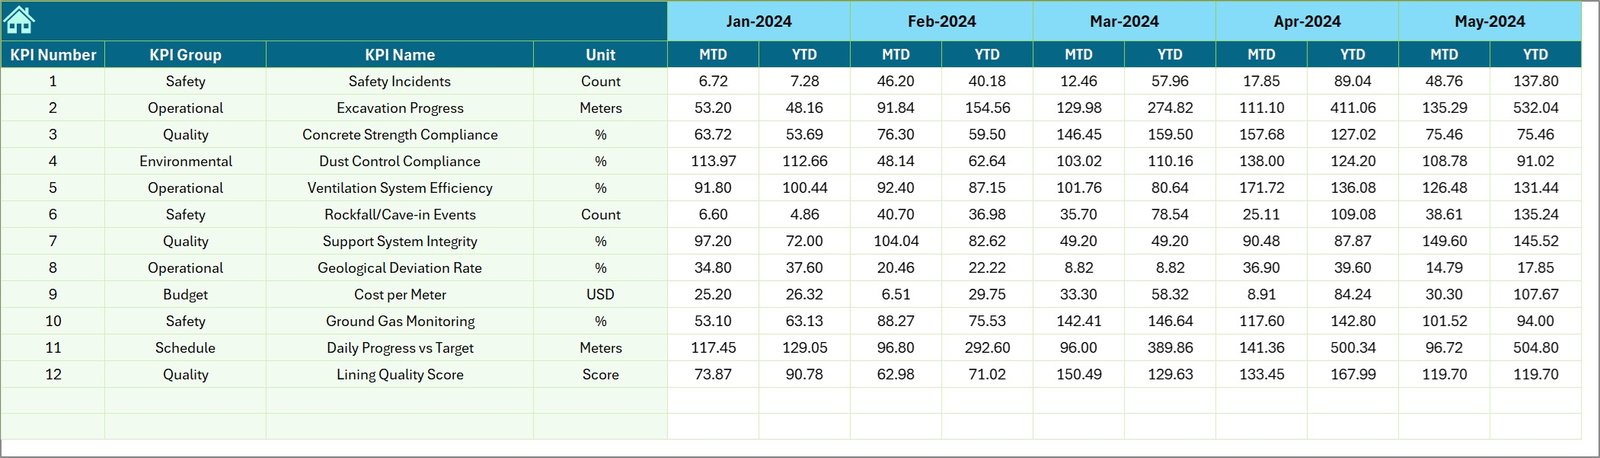
✔ Previous Year Data Sheet
Stores historical KPI values for year-over-year comparison and performance benchmarking.
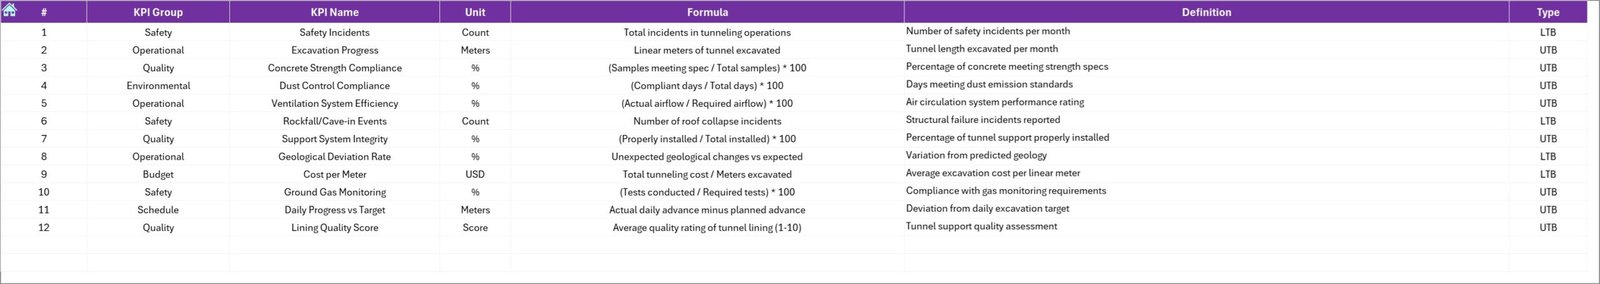
✔ KPI Definition Sheet
Contains detailed documentation of KPIs including formula, definition, measurement unit, and KPI category.
How to Use the Tunnel Engineering KPI Dashboard in Excel
⚙️ Step 1: Define Your KPIs
Start by entering KPI details in the KPI Definition Sheet including KPI name, formula, and measurement unit.
📊 Step 2: Set KPI Targets
Enter expected performance targets in the Target Sheet to measure whether project performance meets expectations.
📅 Step 3: Input Actual Performance Data
Enter Month-To-Date and Year-To-Date KPI values in the Actual Numbers Sheet for each reporting month.
📈 Step 4: Analyze Dashboard Insights
Select the reporting month and monitor performance indicators, comparisons, and trend charts.
🔎 Step 5: Identify Performance Gaps
Use the dashboard to identify delays, safety issues, or cost overruns and take corrective action quickly.
Who Can Benefit from This Tunnel Engineering KPI Dashboard
🏗 Infrastructure Construction Companies
Monitor tunnel excavation progress, workforce productivity, and equipment utilization.
🚇 Metro and Railway Infrastructure Authorities
Track performance of tunnel construction projects and monitor engineering KPIs.
🏛 Government Infrastructure Agencies
Evaluate project performance, safety compliance, and budget utilization.
📊 Engineering Consulting Firms
Analyze project data and provide insights to clients managing tunnel projects.
📋 Project Management Offices (PMOs)
Monitor multiple tunnel projects and compare performance metrics across projects.
Using the Tunnel Engineering KPI Dashboard in Excel, organizations can significantly improve project visibility, operational control, and performance monitoring.
Instead of relying on scattered reports, teams can manage tunnel construction performance using a structured and data-driven dashboard.
Click here to read the Detailed blog post
Watch the step-by-step video tutorial: