


The Travel & Tourism Dashboard in Excel is your all-in-one solution to transform complex travel data into actionable insights 🌍. Whether you’re running a travel agency, tour company, or hospitality business, this dashboard simplifies analytics and empowers decision-makers with clear, visualized data — no coding, no complex BI tools, just Excel magic! 💡Travel & Tourism Dashboard in Excel
✨ Key Features of Travel & Tourism Dashboard in Excel
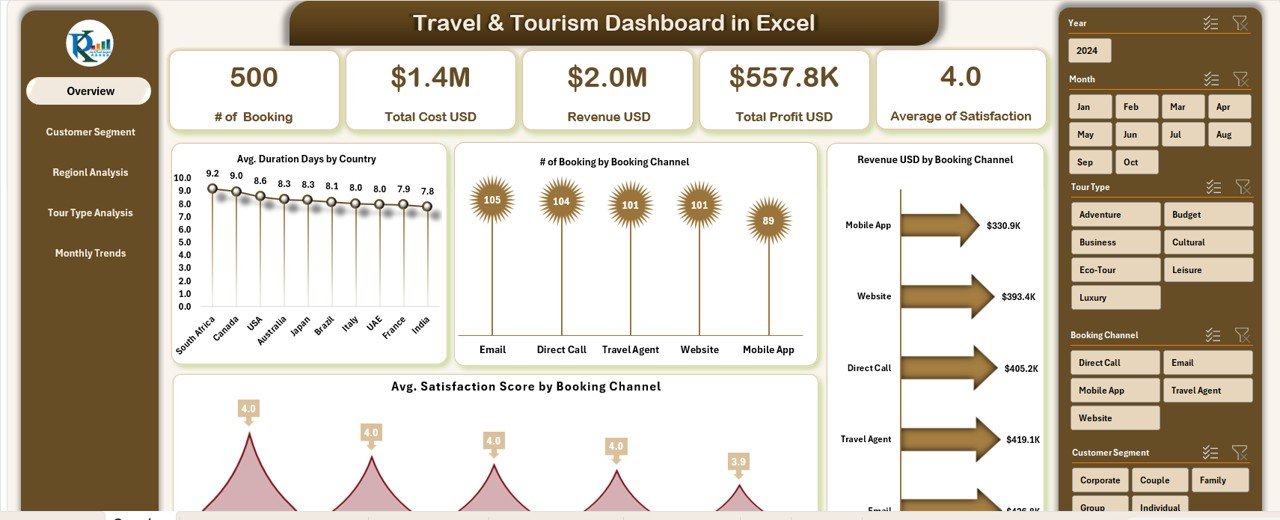
✅ Dynamic KPI Cards & Charts: Instantly view your core performance metrics like total bookings, revenue, actual costs, and profit through visually appealing cards and charts.
📊 Interactive Filters & Slicers: Easily analyze performance by month, region, customer segment, or tour type — making data exploration effortless.
💰 Automated Calculations: Revenue, profit, and satisfaction scores update automatically, ensuring real-time accuracy without manual effort.
🎯 Visual Insights: Includes comparison charts such as Revenue by Booking Channel, Profit by Tour Type, and Satisfaction Score by Segment.Travel & Tourism Dashboard in Excel
🧩 User-Friendly & 100% Excel-Based: Designed with simplicity — no Power BI or macros required.
🧭 Department & Regional Analysis: Track performance across departments and regions to identify high-performing teams and top destinations.
📅 Monthly Trends View: Evaluate your month-by-month performance for bookings, travelers, duration, and profit.
🚀 Completely Customizable: Add new KPIs, modify visuals, or expand data — flexible for every business size.
📦 What’s Inside the Travel & Tourism Dashboard
When you download this ready-to-use Excel file, you get multiple structured sheets — each focused on a unique aspect of tourism analytics:
📋 Overview Sheet: Displays high-level KPIs and key visuals for quick decision-making.
👥 Customer Segment Analysis: Understand different customer types, their duration preferences, and satisfaction levels.
🏢 Department Analysis: Compare costs, revenue, and efficiency across departments.
🌎 Regional Analysis: Track where your customers are coming from and where profits are highest.
🧳 Tour Type Analysis: Evaluate profitability and popularity across adventure, business, cultural, or luxury tours.
📈 Monthly Trends: Spot seasonal patterns, plan promotions, and forecast future performance.
🗂️ Data Sheet: The backbone of your dashboard — input all booking, cost, and satisfaction data seamlessly.
This structured format ensures your entire team works with consistent, up-to-date information, enabling smarter business moves.
⚙️ How to Use the Travel & Tourism Dashboard
Using this dashboard is incredibly simple 💼:
1️⃣ Open the Excel File and navigate to the Overview Sheet.
2️⃣ Select the Month or Filter (Country, Segment, or Tour Type) from the dropdowns or slicers.
3️⃣ Analyze Results: Instantly view updated KPIs, charts, and trends.
4️⃣ Drill Down Deeper: Visit Department, Customer, or Region tabs for detailed insights.
5️⃣ Add or Update Data: Enter new bookings, costs, and satisfaction scores in the Data Sheet — the dashboard updates automatically.
Within minutes, you’ll have a professional, data-driven performance report ready for management reviews or client presentations 📊.
👥 Who Can Benefit from This Travel & Tourism Dashboard
🌍 Travel Agencies: Track bookings, channels, and profitability with ease.
🏨 Hospitality Businesses: Analyze guest satisfaction and occupancy efficiency.
🏢 Tour Operators: Identify profitable tour types and seasonal trends.
💼 Corporate Travel Teams: Manage vendors, expenses, and traveler satisfaction.
🏛️ Tourism Boards: Visualize regional trends and demographic insights.
🧭 Consultants & Analysts: Provide professional reporting for clients in tourism or hospitality sectors.
This tool fits perfectly for professionals who value time, accuracy, and data-backed decision-making.
🧠 Why Choose This Dashboard?
The Travel & Tourism Dashboard in Excel is more than just numbers — it’s a decision engine for your business. It helps you boost revenue, increase customer happiness, and reduce manual work. Whether you’re planning next season’s marketing strategy or optimizing operations, this Excel template keeps your insights clear and your actions focused.


Reviews
There are no reviews yet.