


Managing a training budget is one of the most important responsibilities for HR, L&D, and finance teams. While organizations want to upskill employees and invest in professional development, the challenge lies in tracking costs, managing approvals, and ensuring value for money. Traditional spreadsheets often fall short because they require too much manual work and make it difficult to spot overspending.
That’s why many organizations are adopting a Training Budget Dashboard in Power BI. It transforms financial and training data into interactive, easy-to-read visuals, helping businesses monitor utilization, detect inefficiencies, and plan smarter.
🔎 What is a Training Budget Dashboard in Power BI?
A Training Budget Dashboard in Power BI is a ready-to-use analytics tool that integrates training and budget data from Excel or other sources. Instead of scrolling through rows of numbers, HR teams and managers get real-time insights into training expenses, approvals, and trends.
With this dashboard, you can:
-
Track training spend across departments and programs.
-
Compare budget allocation vs actual utilization.
-
Identify departments or trainers that overspend.
-
Monitor monthly and yearly trends.
-
Make faster, data-driven decisions on training investments.
📑 Main Components of the Dashboard
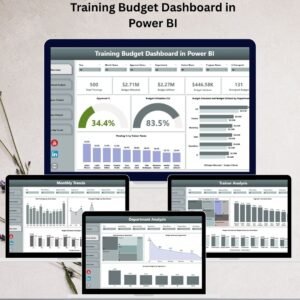
The dashboard is organized into five interactive pages, each serving a unique purpose:
1. Overview Page – The Big Picture

-
🚀 KPI Cards: Approved %, Utilization %, Pending %, Budget Allocation vs Utilized.
-
🎛 Slicers: Filter by department, trainer, program, or month.
-
📊 Instant snapshot of training budget health.
2. Department Analysis – Fund Utilization by Teams
-
📊 Total Trainings by Department.
-
📊 Budget Variance by Department.
-
📊 Overspend % by Department.
-
✅ Helps compare department-wise performance and cost control.
3. Program Analysis – Evaluate Training Programs
-
📊 Total Trainings by Program.
-
📊 Budget Variance by Program.
-
📊 Budget Allocation vs Utilized by Program.
-
🎯 Identify which programs are cost-effective and which need restructuring.
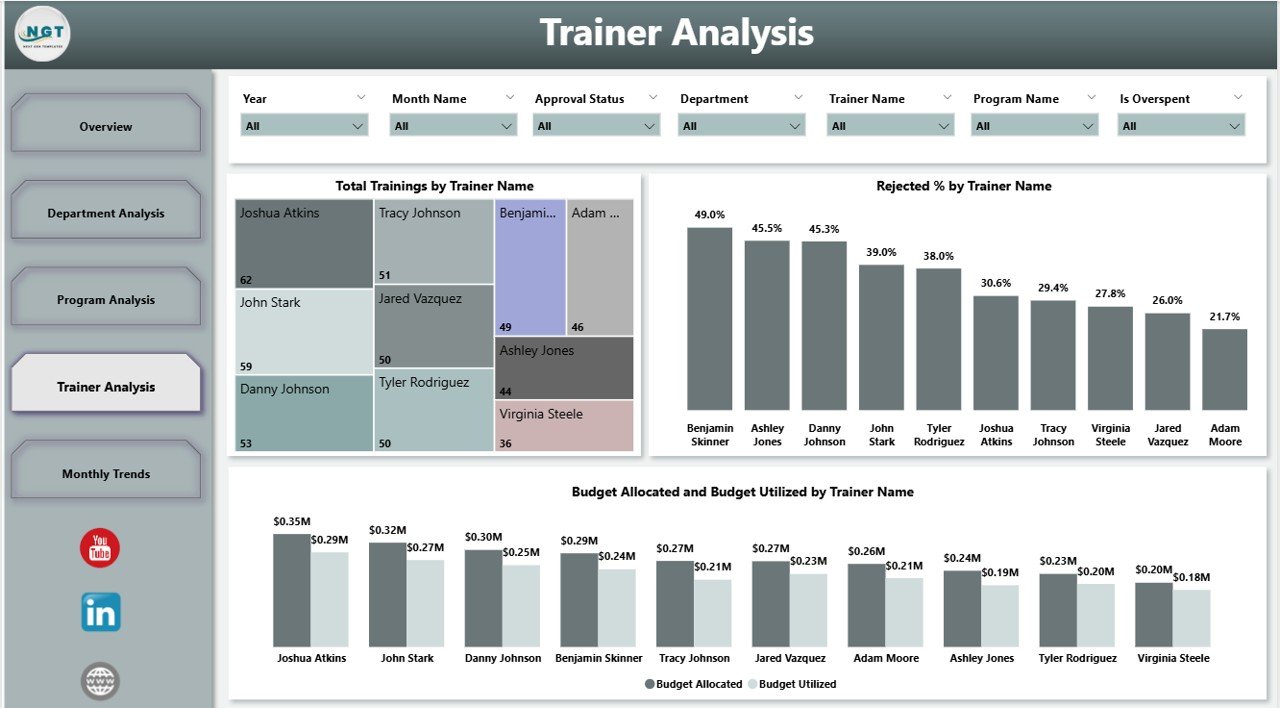
4. Trainer Analysis – Trainer Performance & Cost
-
📊 Trainings by Trainer.
-
📊 Reject % by Trainer.
-
📊 Budget Utilized vs Allocated per Trainer.
-
🔎 Useful for reviewing trainer efficiency and ROI.
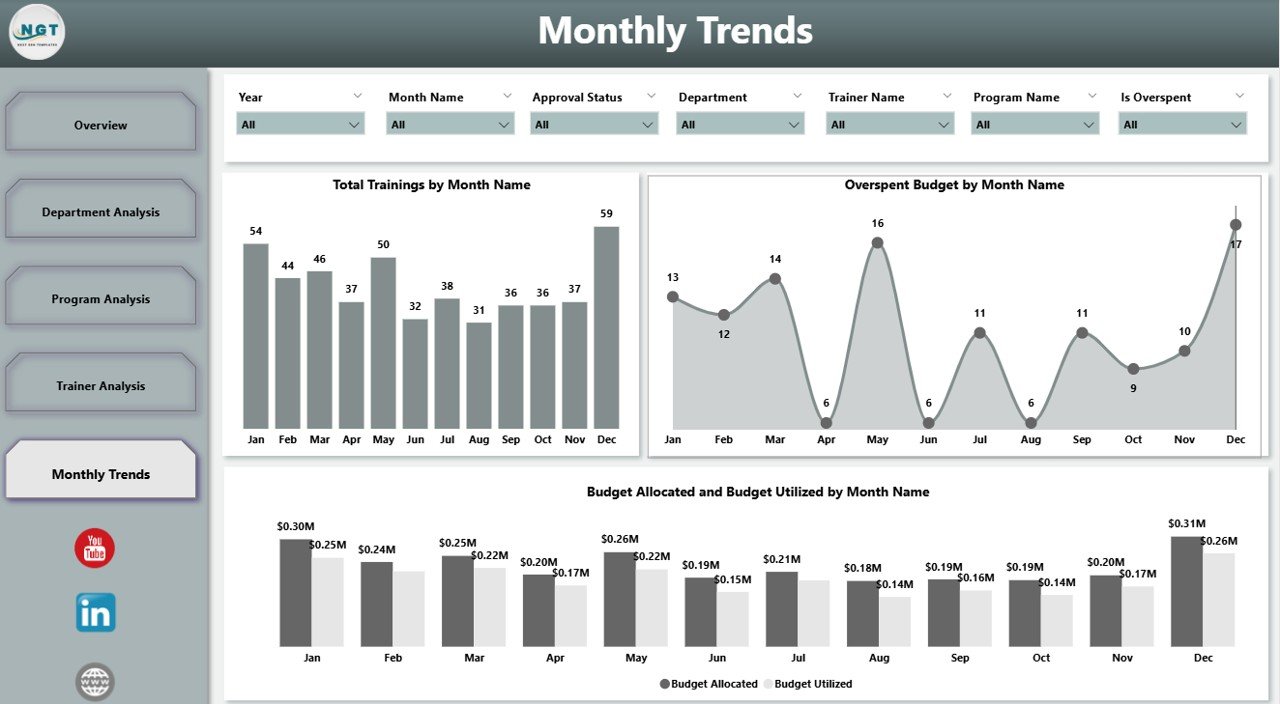
5. Monthly Trends – Seasonality & Planning
-
📊 Trainings by Month.
-
📊 Overspend by Month.
-
📊 Budget Allocation vs Utilized (Month).
-
📅 Detect seasonal patterns and adjust training schedules.
🏆 Why Businesses Need This Dashboard
Managing training costs is not just about saving money — it’s about making every training dollar count. This dashboard enables organizations to:
-
Gain real-time budget visibility.
-
Reduce human errors from spreadsheets.
-
Make faster, smarter financial decisions.
-
Compare cross-department efficiency.
-
Track trainer and program ROI.
🚀 Key Advantages
-
✅ Ease of Use – Interactive filters and visuals.
-
✅ Time-Saving – No manual report building.
-
✅ Cost Control – Spot overspending quickly.
-
✅ Transparency – Align HR, Finance & Management.
-
✅ Scalable – Works for small businesses and large enterprises.
💡 Opportunities for Improvement
Organizations can further enhance this dashboard by:
-
🔗 Integrating with HR systems for real-time updates.
-
🤖 Using AI for predictive budget forecasting.
-
📱 Creating mobile-optimized views for managers.
-
🔔 Setting up alerts for overspending or underutilization.
-
⭐ Including employee feedback scores to track training effectiveness.
📌 Best Practices
-
Keep data clean & updated – refresh monthly.
-
Use slicers effectively for deep analysis.
-
Focus on core KPIs: Utilization %, Variance, Overspend.
-
Share insights with HR, Finance, and Department Heads.
-
Use monthly trends to plan future training budgets.
🎓 Conclusion
A Training Budget Dashboard in Power BI gives organizations the power to track expenses, monitor utilization, and optimize training programs. With clear visuals and real-time insights, managers can cut waste, improve ROI, and make informed workforce development decisions.
If your organization wants to control training costs, improve efficiency, and maximize employee development, this dashboard is the right solution.
❓ Frequently Asked Questions (FAQs)
Q1. What is the main purpose of a Training Budget Dashboard in Power BI?
To help organizations monitor training expenses, compare budgets vs utilization, and spot overspending.
Q2. Who benefits from this dashboard?
HR managers, L&D teams, finance departments, and business leaders.
Q3. Can it be customized?
Yes. You can add KPIs, visuals, or filters specific to your company.
Q4. How does it work with Excel?
It connects to Excel data sources and refreshes automatically.
Q5. Can small businesses use it?
Absolutely. It works for organizations of any size.
👉 Visit our YouTube Channel for step-by-step tutorials.
🔗 Click here to read the Detailed blog post
Watch the step-by-step video tutorial:


Reviews
There are no reviews yet.