
Toy & Games Industry KPI Dashboard in Excel Managing a toy and games business is challenging because trends shift quickly, customer preferences change every season, and competition keeps growing. To stay ahead, businesses need a fast, simple, and powerful way to track performance across sales, production, inventory, and customer experience. That’s exactly why we created the Toy & Games Industry KPI Dashboard in Excel—a complete, ready-to-use performance tracking system designed for retailers, manufacturers, distributors, wholesalers, and e-commerce brands.Toy & Games Industry KPI Dashboard in Excel
This dashboard gives you total visibility into your business with MTD, YTD, and Previous Year comparisons, automated charts, interactive slicers, KPI tables, and trend analysis. Whether you’re planning new product launches, optimizing stock, analyzing marketing results, or boosting store performance, this dashboard provides every insight you need—without any complex software.
🎯 Key Features of the Toy & Games Industry KPI Dashboard in Excel
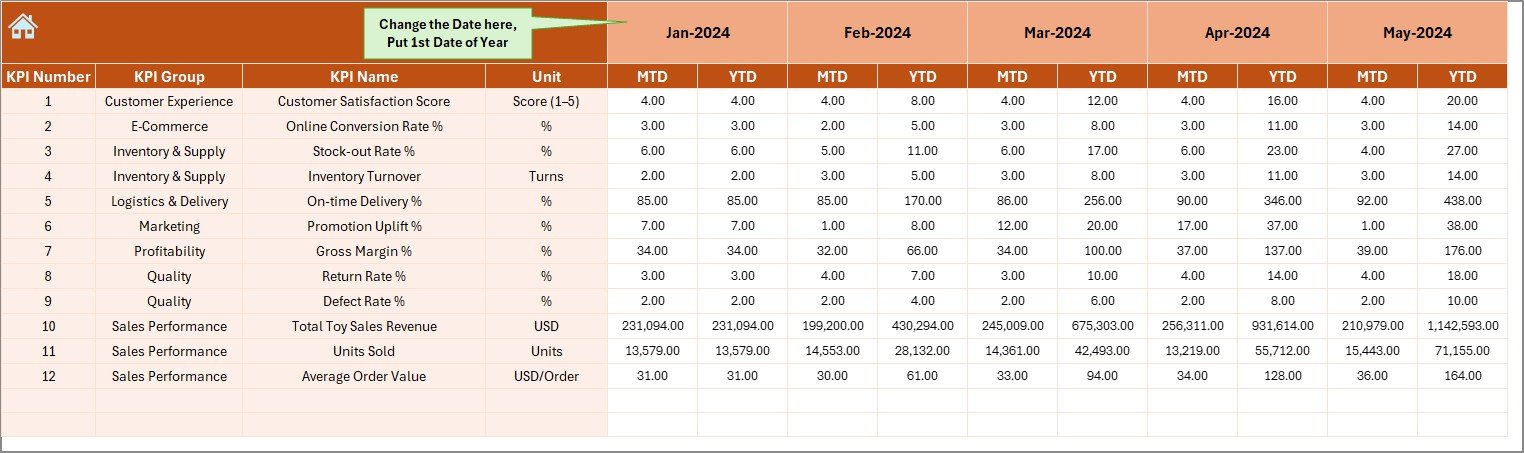
📊 1. All-In-One Performance View
Toy & Games Industry KPI Dashboard in Excel See all essential KPIs—Sales, Customer, Inventory, Production, and Marketing—in one organized layout. MTD and YTD numbers update instantly when you select a month.Toy & Games Industry KPI Dashboard in Excel
⬆️⬇️ 2. Powerful Visual Insights
Conditional formatting arrows highlight improvements and declines, making performance easy to understand at a glance.
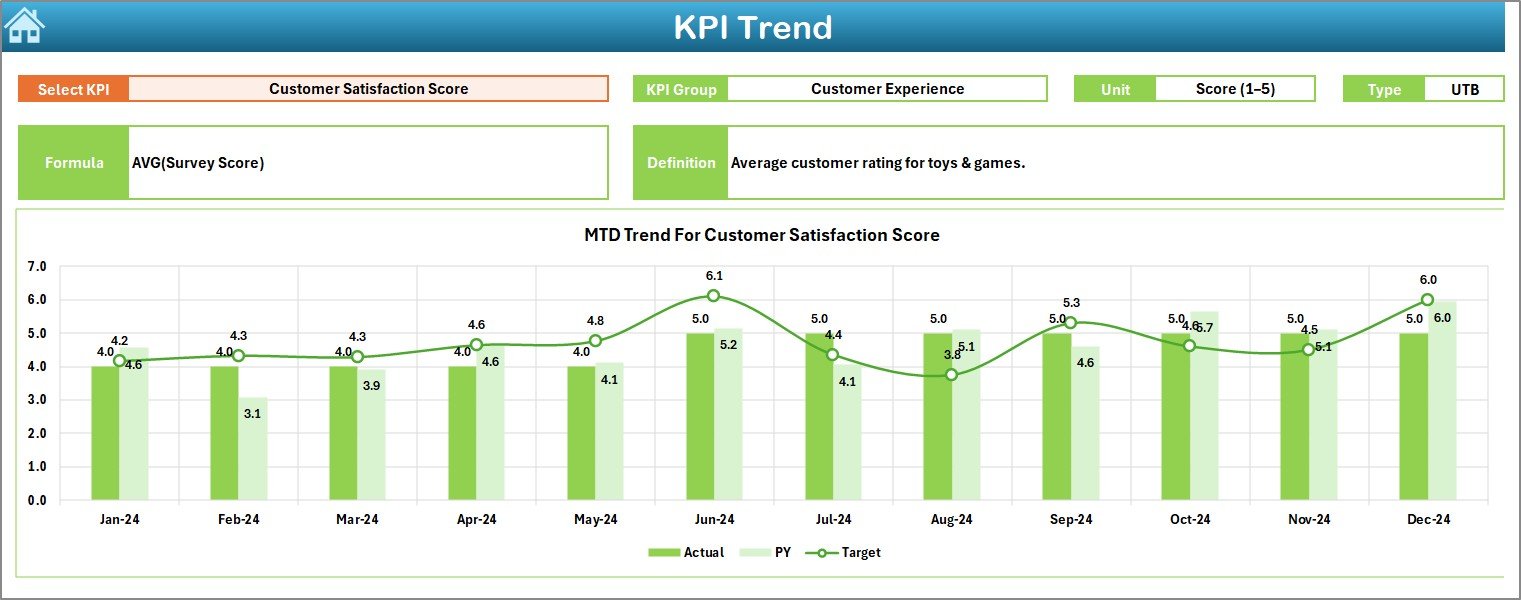
📈 3. Trend Analysis Sheet
Analyze month-by-month movement with MTD and YTD trend charts. Compare Actual vs Target vs Previous Year for any KPI using the drop-down selector.
🗂️ 4. Smart Navigation Panel
Jump to any section using the Summary Page buttons—no scrolling, no confusion.
📥 5. Fully Editable Excel Sheets
Modify KPIs, formulas, targets, and definitions as per your business needs. All sheets are unlocked for easy customization.
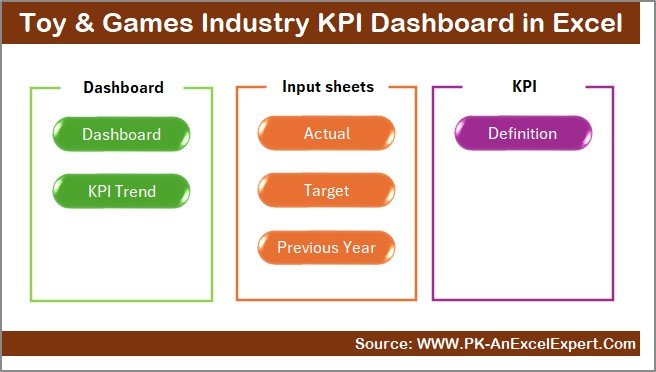
📦 What’s Inside the Toy & Games Industry KPI Dashboard in Excel
📝 1. Summary Page
A clean index page with quick navigation buttons.Toy & Games Industry KPI Dashboard in Excel
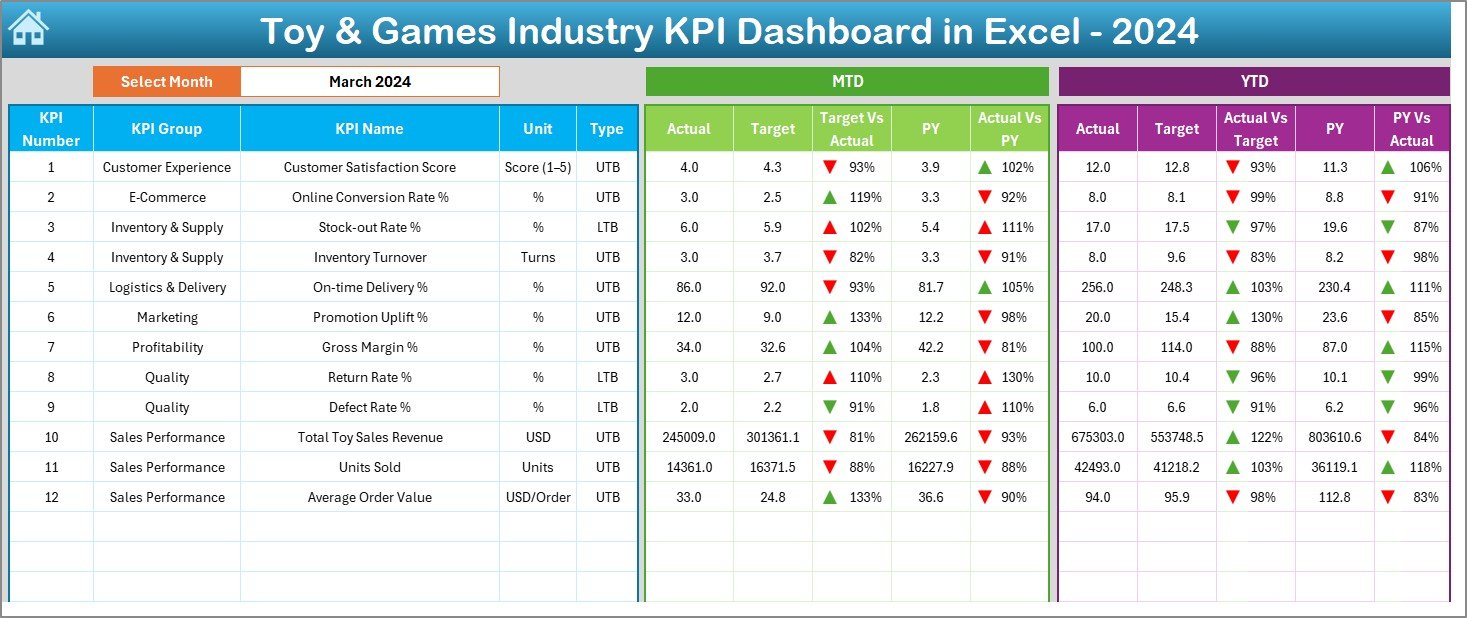
📊 2. Dashboard Page
The main performance screen showing all KPIs with MTD, YTD, PY, and comparison indicators.
📈 3. Trend Page
Dropdown-based KPI trend analysis with charts and KPI details.
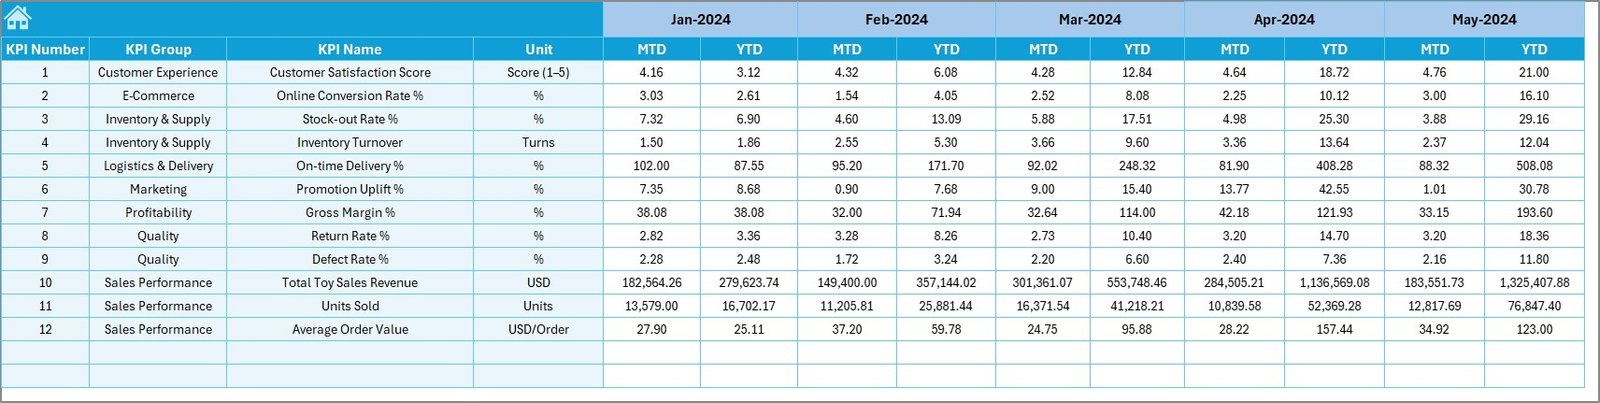
✏️ 4. Actual Numbers Sheet
Enter your monthly actual data—everything updates instantly.
🎯 5. Target Sheet
Set monthly MTD and YTD targets for every KPI.
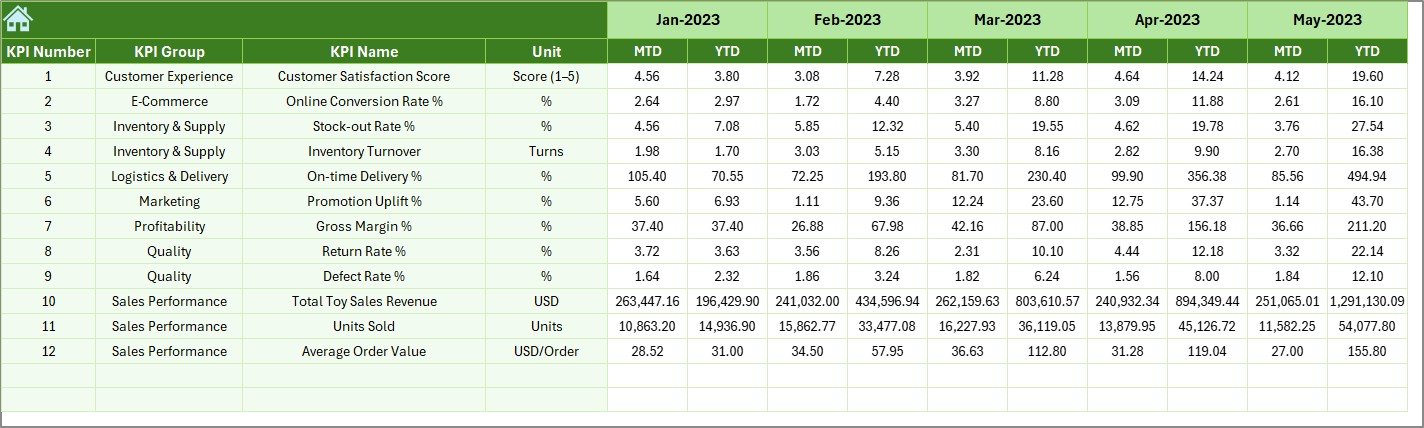
📅 6. Previous Year Sheet
Compare your current performance with last year’s numbers.
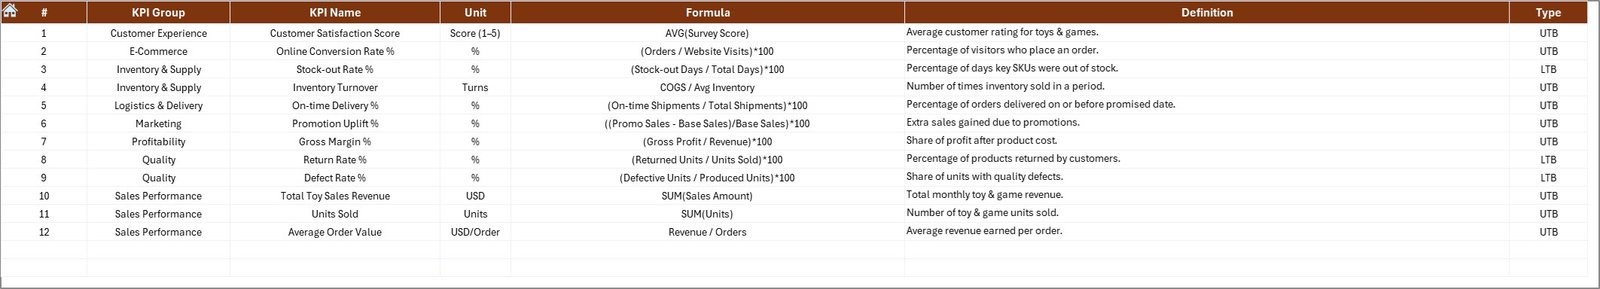
📚 7. KPI Definition Sheet
A structured database containing KPI names, formulas, units, definitions, and KPI types (UTB/LTB).
🛠️ How to Use the Toy & Games Industry KPI Dashboard in Excel
🔹 Step 1:
Enter monthly actual values in the Actual Numbers Sheet.Toy & Games Industry KPI Dashboard in Excel
🔹 Step 2:
Fill MTD and YTD targets in the Target Sheet.
🔹 Step 3:
Update last year’s data in the Previous Year Sheet.
🔹 Step 4:
Go to the dashboard and select a month from the drop-down.
🔹 Step 5:
Toy & Games Industry KPI Dashboard in Excel Review performance using trends, charts, and target comparisons.
🔹 Step 6:
Use insights to improve sales planning, inventory management, marketing ROI, and customer service.
That’s it! The dashboard does all calculations automatically using Excel’s built-in formulas.Toy & Games Industry KPI Dashboard in Excel
👥 Who Can Benefit from This Toy & Games Industry KPI Dashboard in Excel
🏬 Retail Toy Stores
Track sales, returns, customer satisfaction, and fast-moving products.
🧸 Toy Manufacturers
Monitor production volume, defect rate, manufacturing cost, and timelines.
🚚 Distributors & Wholesalers
Analyze distribution performance, stock health, and delivery timelines.Toy & Games Industry KPI Dashboard in Excel
🛒 E-commerce Toy Sellers
Review online vs offline sales, conversion rates, and customer complaints.
📦 Category Managers & Analysts
Understand category growth, product trends, and slow-moving items.
If you manage toys, games, collectibles, kids’ products, or seasonal merchandise—this dashboard is for you.
### Click here to read the Detailed blog post
Watch the step-by-step video tutorial:


Reviews
There are no reviews yet.