


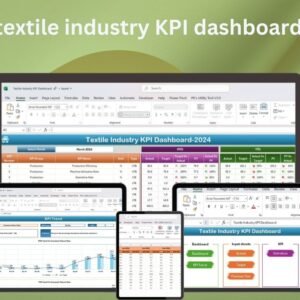
The Textile Industry KPI Dashboard in Excel is a comprehensive tool designed to help textile industry professionals track, analyze, and visualize key performance indicators (KPIs) related to production, inventory, sales, and more. This customizable Excel dashboard offers a real-time snapshot of your textile operations, enabling businesses to monitor essential metrics and make data-driven decisions.
Whether you’re overseeing production efficiency, inventory levels, or sales performance, this KPI dashboard provides a clear and organized way to visualize your data. With easy-to-read charts, graphs, and automated data tracking, this tool helps streamline your workflow and improve decision-making across your textile business.
Key Features of the Textile Industry KPI Dashboard in Excel
📊 Real-Time Data Tracking: Track KPIs such as production output, sales, inventory levels, and production efficiency in real-time.
⚙️ Customizable Dashboard: Tailor the dashboard to suit the specific needs of your textile business, from raw material costs to finished goods performance.
📈 Production Performance Analysis: Monitor the efficiency of production lines, track order completion rates, and identify bottlenecks.
📅 Sales and Revenue Tracking: Keep track of sales performance, revenue, and market trends to boost profitability.
📉 Inventory Management: Visualize inventory turnover rates, stock levels, and reorder points for better supply chain management.
🔄 Dynamic and Interactive Features: Drill down into individual KPIs for deeper insights and track historical performance trends.
🧑💼 User-Friendly Interface: A simple layout and intuitive design make it easy for users of all levels to manage the dashboard.
Why You’ll Love the Textile Industry KPI Dashboard in Excel
✅ Simplifies Textile Operations: Gain full visibility into production, inventory, and sales metrics in one central dashboard.
✅ Enhances Decision Making: Make data-driven decisions using real-time insights on performance, trends, and inventory.
✅ Increases Productivity: Identify areas of improvement by tracking KPIs such as production efficiency and sales performance.
✅ Customizable and Scalable: Adapt the dashboard to your unique textile industry needs and scale as your business grows.
✅ Easy to Use: No technical expertise required to set up or use the dashboard effectively.
What’s Inside the Textile Industry KPI Dashboard in Excel?
📊 Real-Time Tracking of KPIs: Monitor key metrics such as production output, sales revenue, and inventory levels.

⚙️ Customizable Widgets: Adjust the layout and design to suit the specific KPIs that matter most to your textile business.
📈 Visual Data Representation: Use charts, graphs, and tables to visualize production and sales data at a glance.
📅 Time-Based Trends: Analyze production performance, sales growth, and inventory turnover over various time periods.
🔄 Interactive Features: Dive deeper into specific data points for a detailed analysis of your textile operations.
How to Use the Textile Industry KPI Dashboard in Excel
1️⃣ Download the Dashboard Template – Instantly access the Excel file upon purchase.
2️⃣ Customize KPIs: Adjust the dashboard to include your specific textile production, inventory, and sales metrics.
3️⃣ Input Your Data: Add your current performance data and see the charts update automatically.
4️⃣ Monitor Performance: Use the real-time tracking features to monitor production efficiency, sales, and inventory levels.
5️⃣ Generate Reports: Create reports and visual insights for decision-making and presentations.
Who Can Benefit from the Textile Industry KPI Dashboard in Excel?
🔹 Textile Manufacturers
🔹 Production Managers
🔹 Inventory Managers
🔹 Sales Teams
🔹 Business Analysts
🔹 Small and Medium Enterprises (SMEs)
🔹 Textile Industry Consultants
Optimize your textile operations, increase productivity, and track performance with this easy-to-use and customizable Excel dashboard.
Click here to read the detailed blog post
Visit our YouTube channel to learn step-by-step video tutorials


Reviews
There are no reviews yet.